ES 5-2-16 and other See I told ya so numbers
Gonna post this video for those who may be trading post 9 a.m and will edit to include my can't fail S.I.T.Y.S ( see i told ya so ) numbers.. 64 - 67 is first key short zone and we missed the Overnight midpoint in Fridays trade...a low probability we fail at Overnight midpoints two days in a row and weakness on Friday usually spills to Monday at least early on. So getting short. Keep in mind that there is a high probability we hit one of the weekly numbers as per pivot formula and the closest one is at 67 but that is auto generated...I'm using 64 - 67 as a short zone !!
ok here are numbers that have a 99 % chance of hitting. The problem is you don't know which ones will hit and neither do I . Perhaps this is no better than saying the market will go up or down but some folks are good breakout and trend traders so these would be targets if you had a good signal. I'm going to refer back to this post and say " See I told ya so" when they do hit....like a child, for fun !!!!
ok by months end we will print 2139 and/or 1978
by weeks end we will print 2098 and/or 2018
the idea behind these would really be to take trades on smaller times frames in an attempt to hold for longer term targets. For example, if you get a good short today then it might be worth trying to hold something to target the 2040 since my S.I.T.Y.S ( "see I told ya so" - said in a snotty kids voice) will hit 99% of the time ! Or if we start holding above the 64 - 67 zone and you think you have a good WEEKLY long then it might be worth trying to hold for 2078 !
For even smaller time frame traders TODAY we have 67 and 2050 as our S.I.T.Y.S numbers ! and gaps count so if we were to gap open above 67 then I would consider that 67 to have traded and count as hitting.
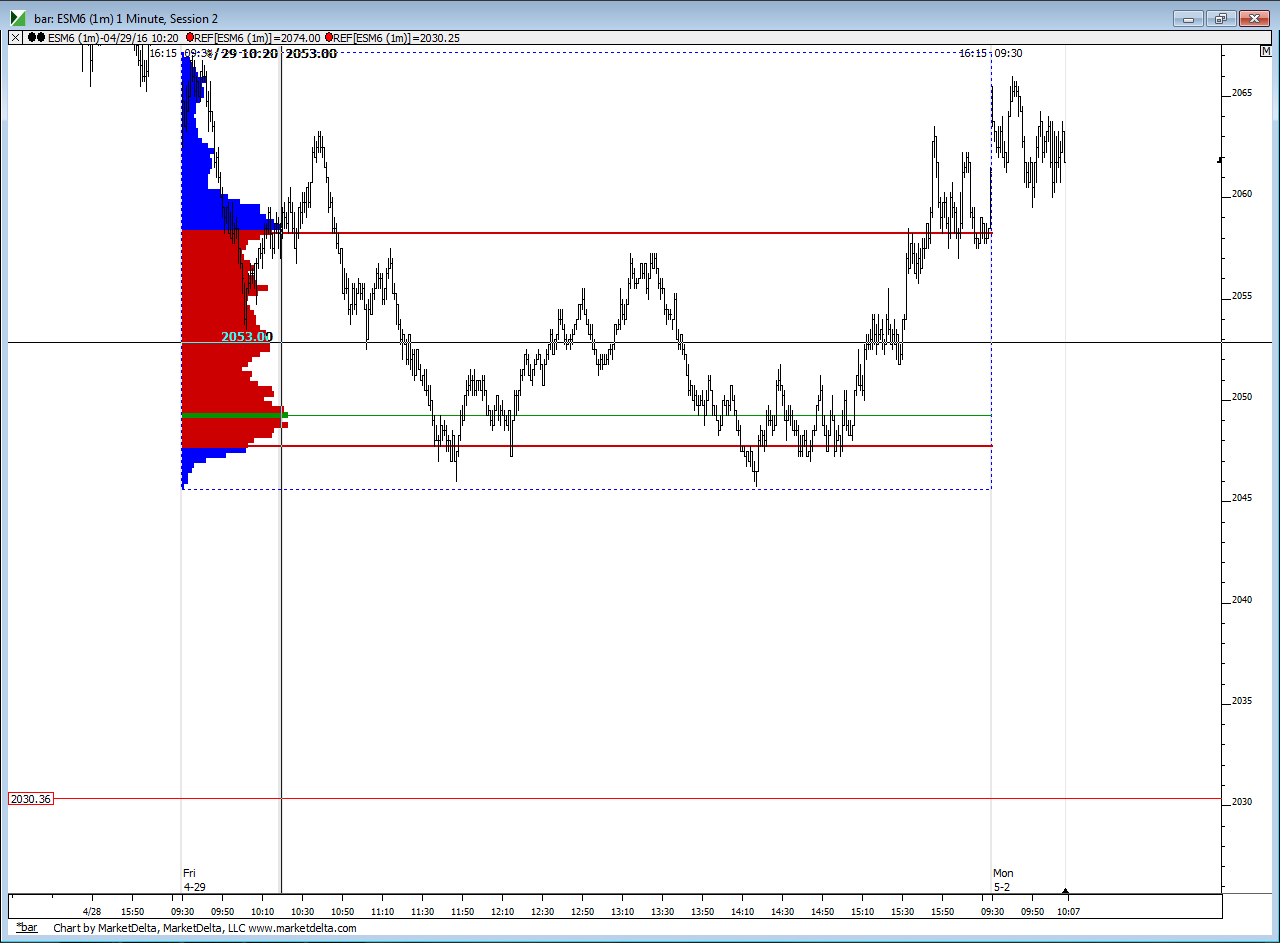
shorted 66.25 trying for 64 test and will add if I see 67.50 pop in day session but my further and better target will be 2 tics above the Overnight midpoint
remember newkids idea that 95 % of the time we will hit SOME floor trader number and I have confirmed this...so will it be R1 at 2070 or the pivot at 2058 ?? Hope it will be the pivot and will scale on the way down..we know overnight midpoint is below the open print too....so keep some probabilities in mind...whatever you do, don't sit in front of your machine all day trying to catch all these swings...have a plan and stick to it !!
coming out heavy at 61.50 that is 2 tics above midpoint......ok to be tortured on runners but part of core trades need to come off as soon as you can with defined targets in pieces at a time
lets not forget the rat numbers too.good to see you bruce
oh yeah...the rats are great for confluence......we have a rat at 67.50 and that is near the S.I.T.Y.S number and overnight high! Thanks Duck
Originally posted by duck
lets not forget the rat numbers too.good to see you bruce
a longer term MP trader would want to see price start to consolidate under the 64 - 67 area breakdown point . That would imply acceptance of the breakdown with the hopes of leading to further selling. A great concept but it is by no means perfect. What is ? In my world I'd like to see the POC of time ( on my one minute chart ) stay under the Overnight high and have price drop down to print the daily pivot and maybe as low as 2050 but that SITYS number is a long way off and the one at 67 seems easier for them to target ...either way take your small pieces and be happy. This is a real day traders opening and we are stuck between two floor trader pivot numbers and neither has printed.....YET !!!!
sure wish they would give me 58.25 but they aren't letting this second campaign go so smooth
from friday low to today high 2056.25 is the 50% and rat number so i be buying
another reason I like 58.25 beside PIVOT being there...lots of time spent there on friday here is a pic...
Click image for original size
try selling 68.75 no fill try 68.25 no fill..just cant bring myself to use market order..now i try the selling the 70.50
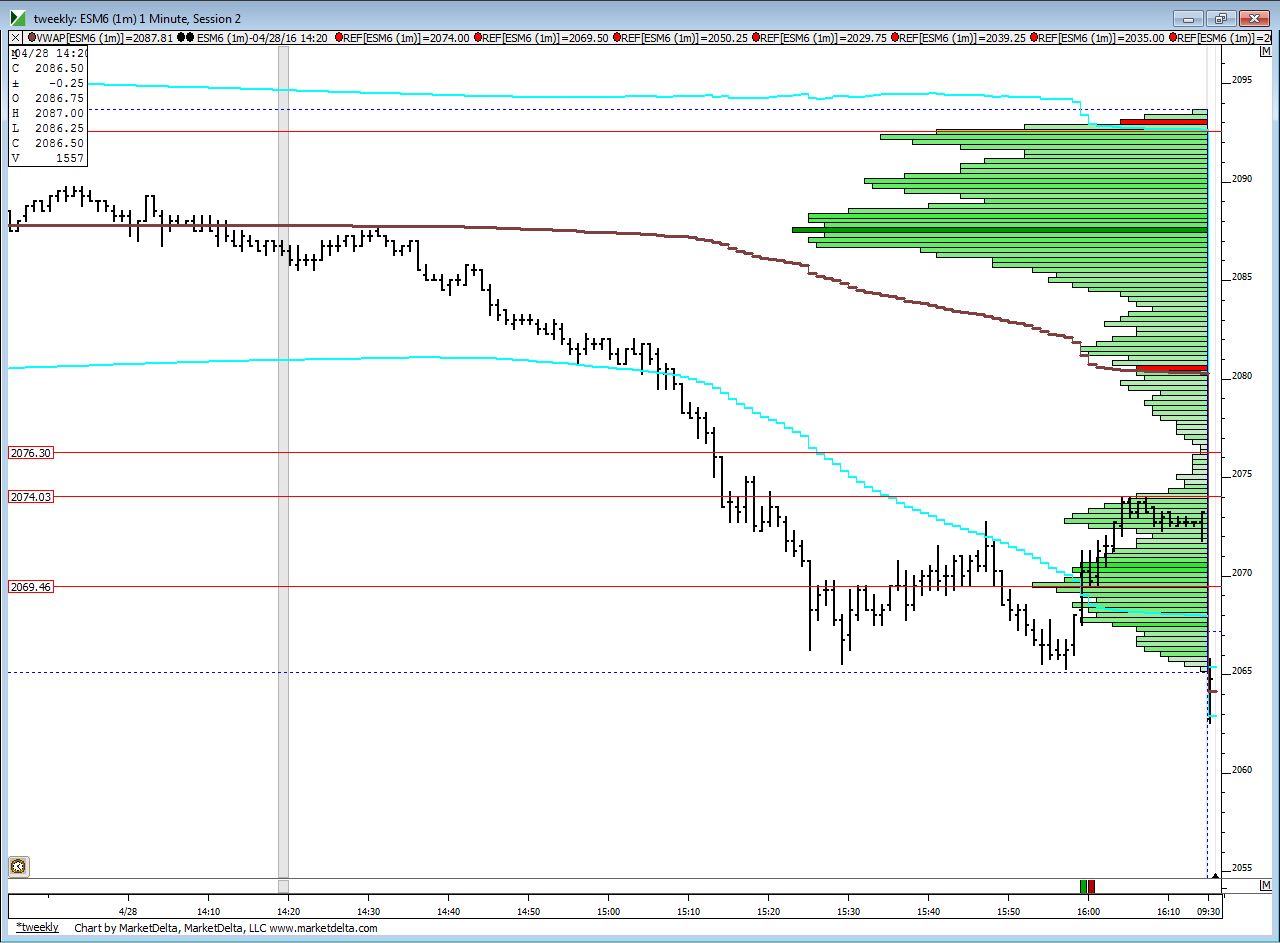
two for the road...note the price action ( the swing high at 74 ) and the low time spot at 76.25 from Thursdays trade...the time histogram helps me define the price action areas quite often
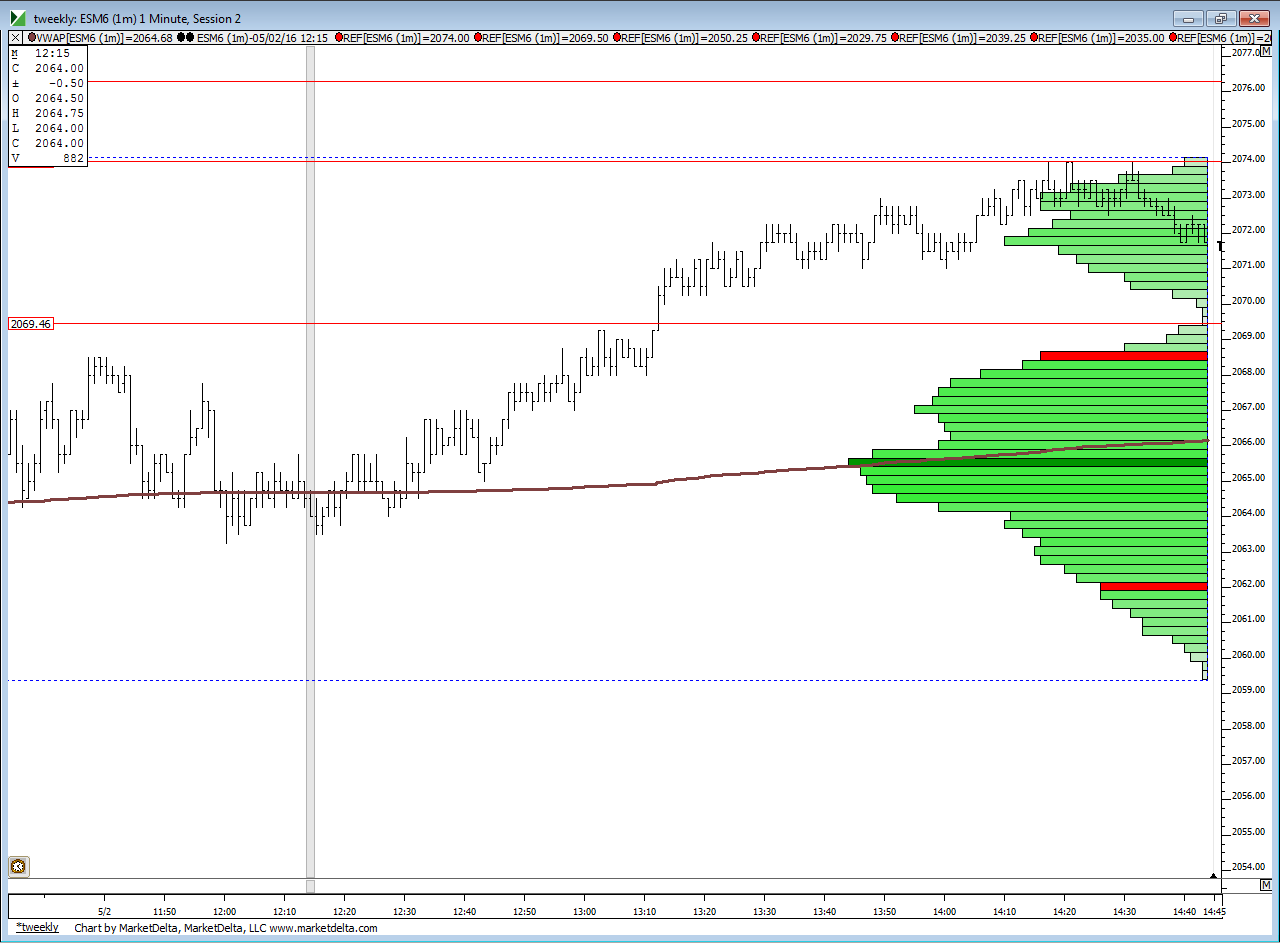
and here is today...note the low time at 69.50.....I'd like to see them drop down but will come out if given the chance ahead of that low time area
Click image for original size
and here is today...note the low time at 69.50.....I'd like to see them drop down but will come out if given the chance ahead of that low time area
Click image for original size
Emini Day Trading /
Daily Notes /
Forecast /
Economic Events /
Search /
Terms and Conditions /
Disclaimer /
Books /
Online Books /
Site Map /
Contact /
Privacy Policy /
Links /
About /
Day Trading Forum /
Investment Calculators /
Pivot Point Calculator /
Market Profile Generator /
Fibonacci Calculator /
Mailing List /
Advertise Here /
Articles /
Financial Terms /
Brokers /
Software /
Holidays /
Stock Split Calendar /
Mortgage Calculator /
Donate
Copyright © 2004-2023, MyPivots. All rights reserved.
Copyright © 2004-2023, MyPivots. All rights reserved.