Starting it off.
Al
RA
rat89
Rep: 0
Posts: 7,015
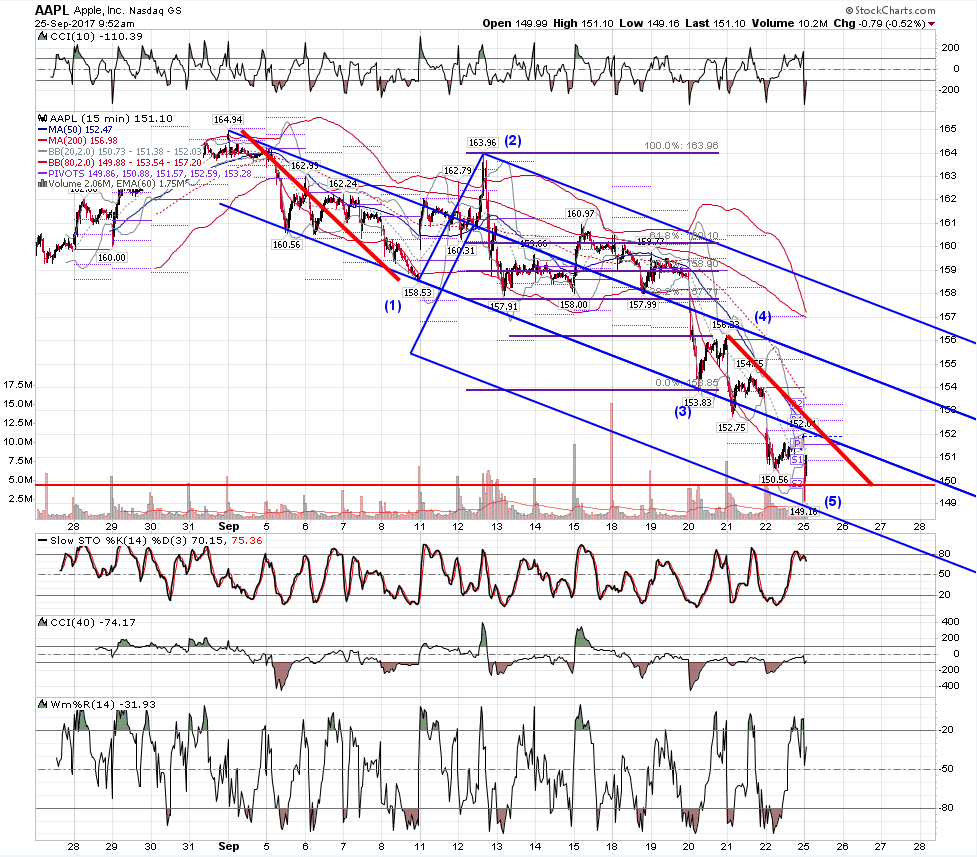
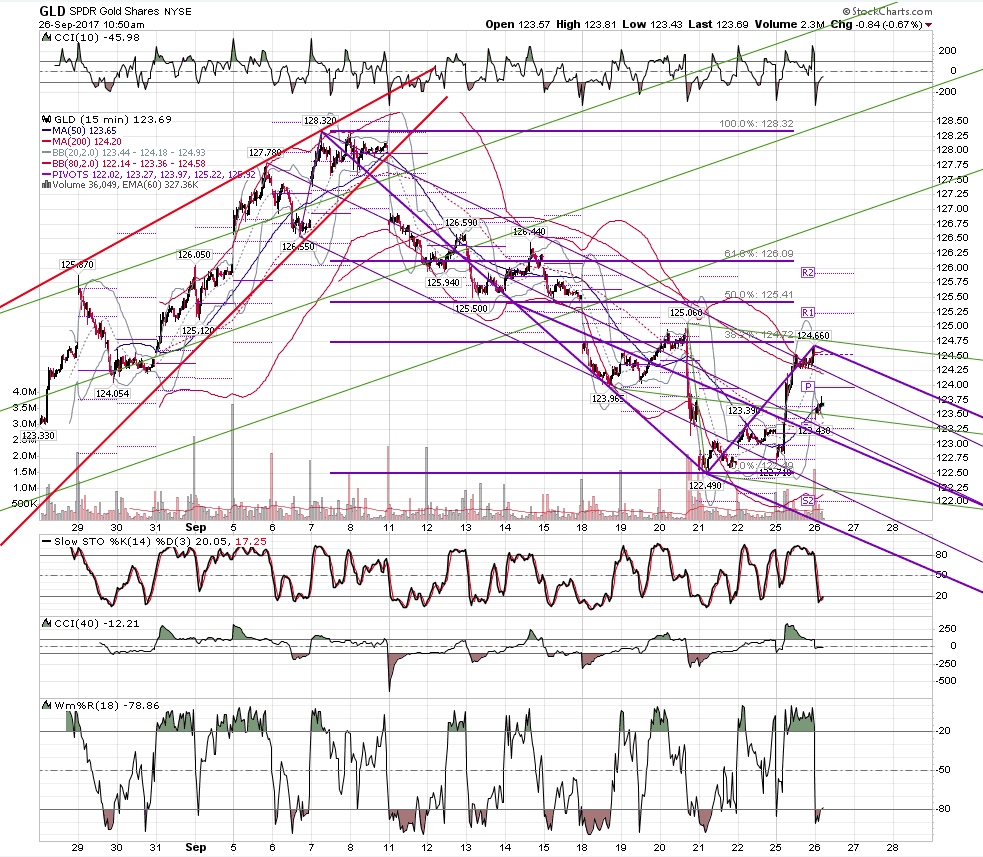
don't be short aapl here, the wave pattern is complete at 149.82
Click image for original size
MA
MarcinO
Rep: 67
Posts: 5,506
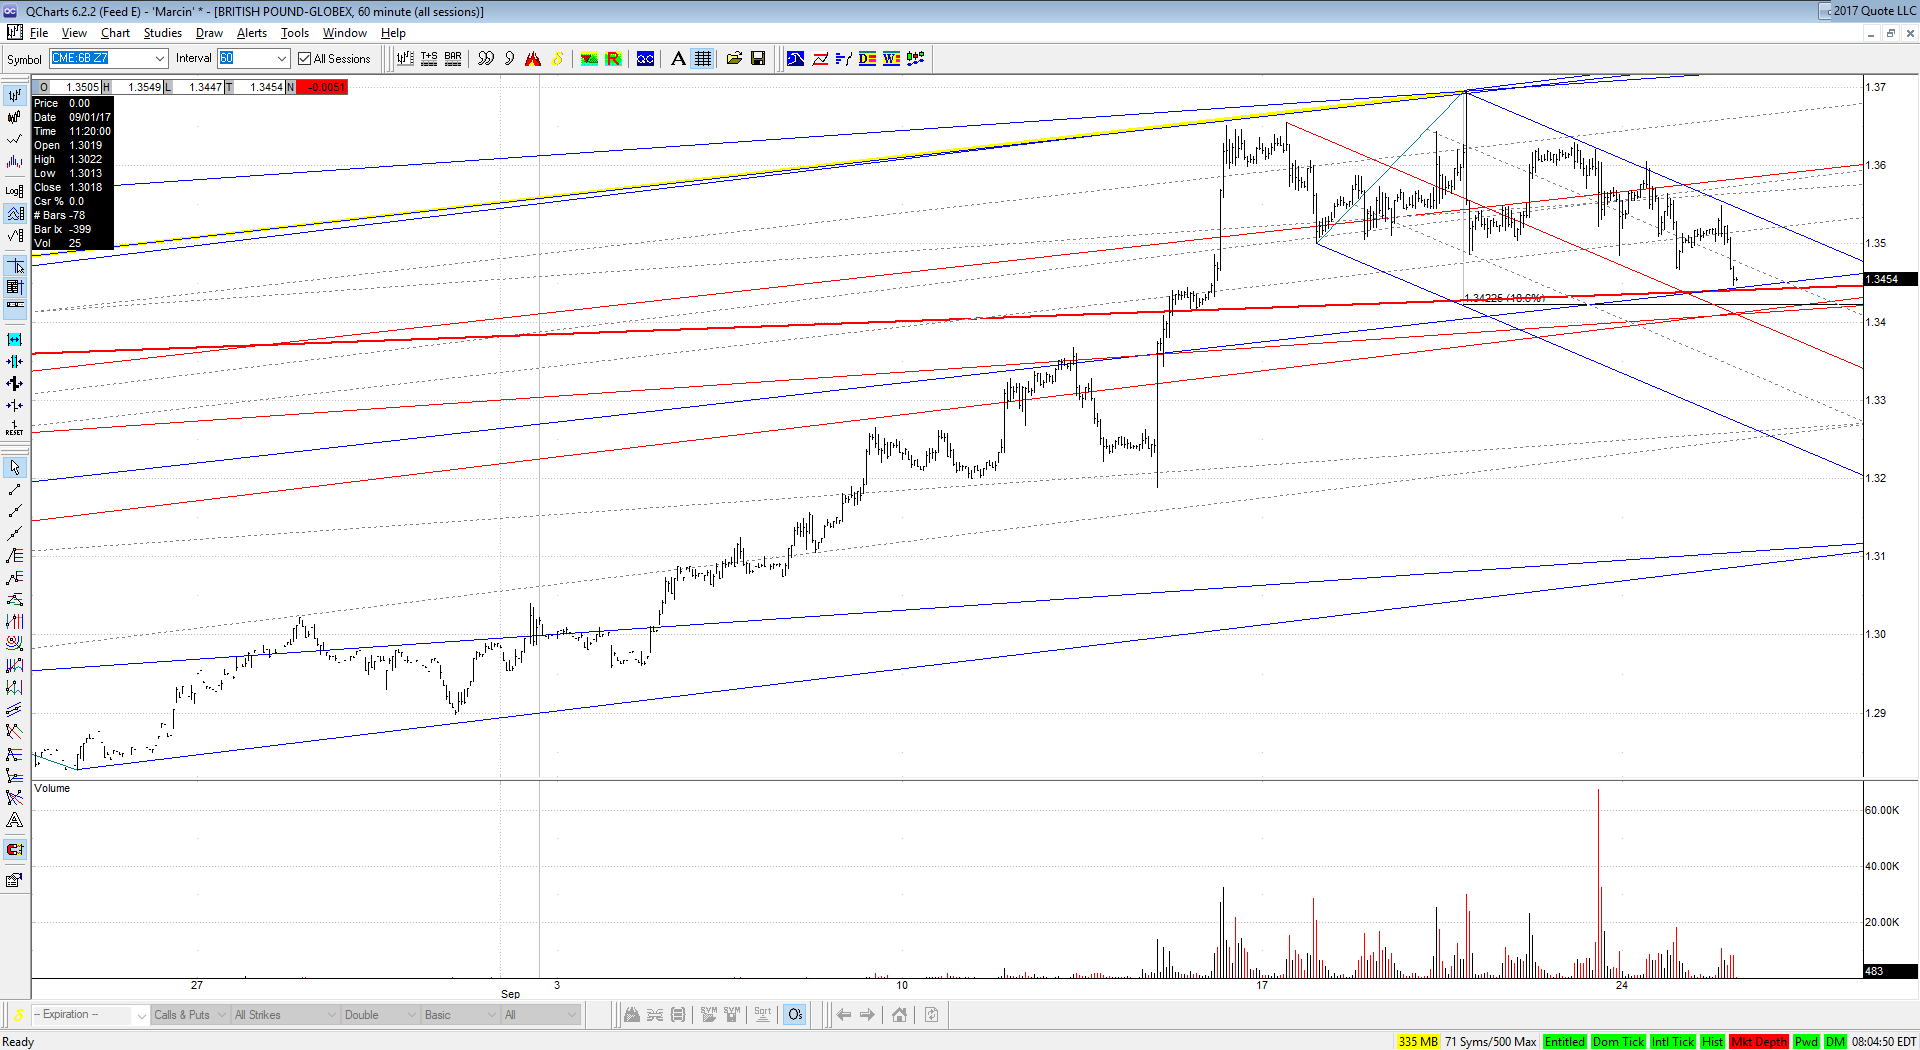
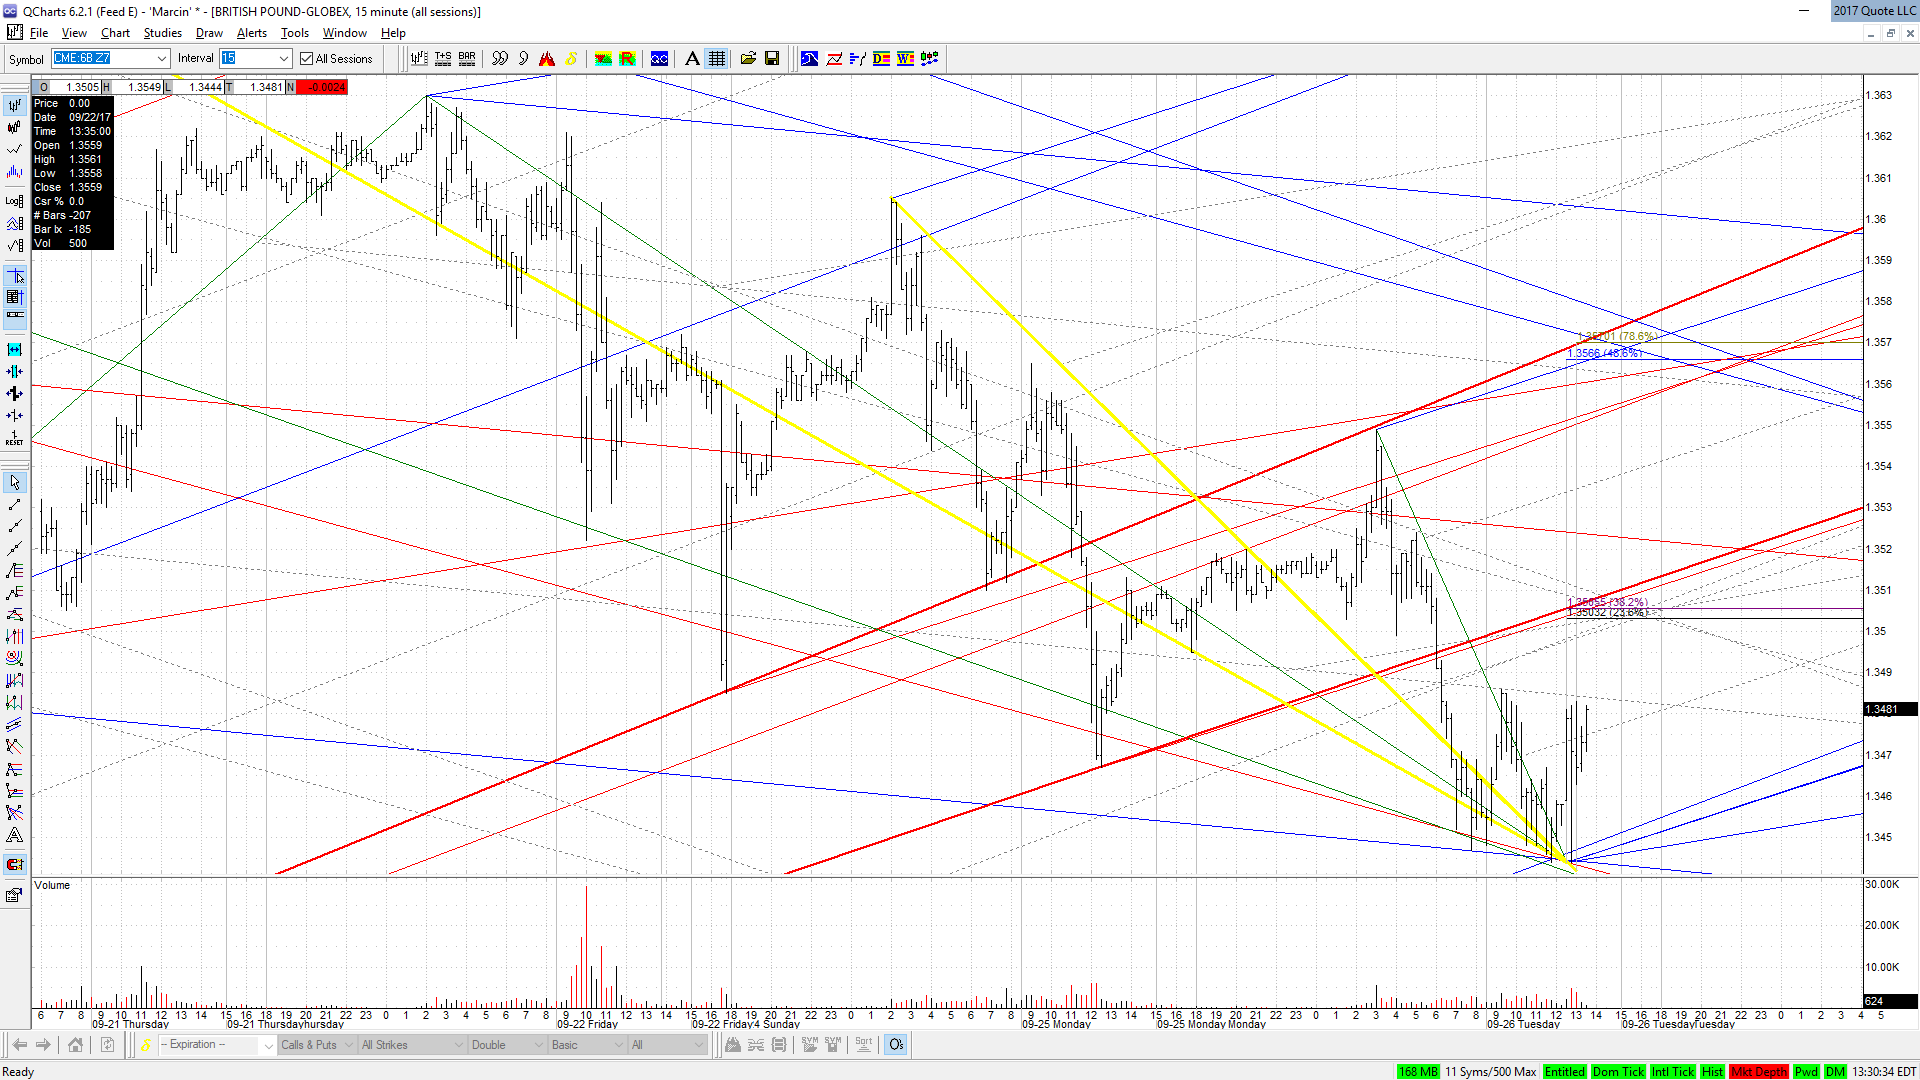
Lots of lines between 1.3410 and 1.3440.
Anyway, this is just a minor support area, I guess. We are ahead of larger droo.
Anyway, this is just a minor support area, I guess. We are ahead of larger droo.
Click image for original size
MA
MarcinO
Rep: 67
Posts: 5,506
1.3440 stopped Cable, indeed.
I think it needs to correct up to 1.3560-70. Smaller resistance just above 1.35.
I think it needs to correct up to 1.3560-70. Smaller resistance just above 1.35.
Click image for original size
RA
rat89
Rep: 0
Posts: 7,015
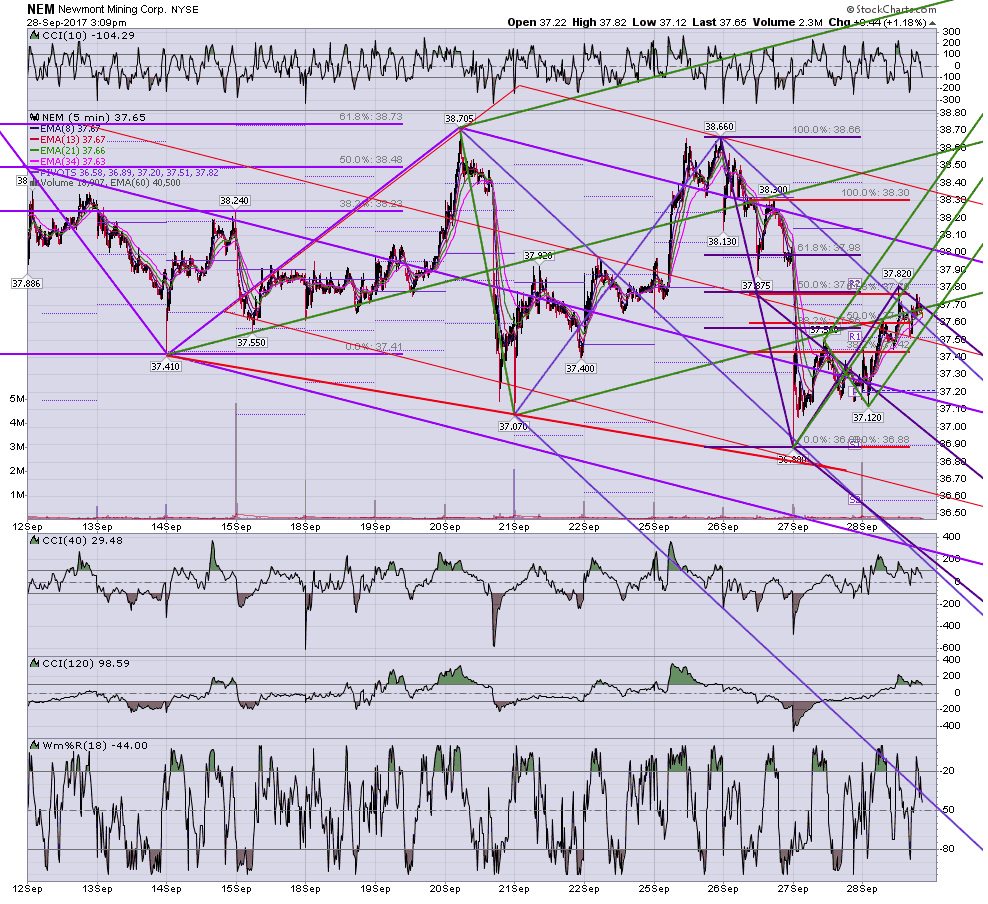
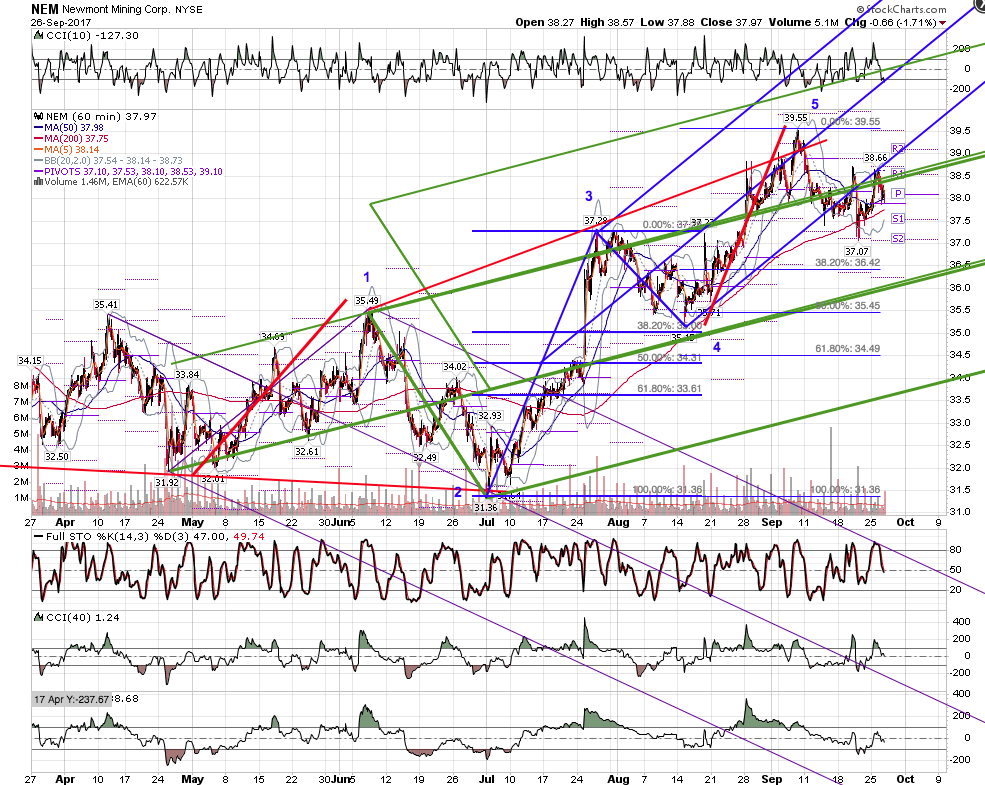
nem 60 - wave count illustration. There is more than one type of wave count, but to keep it simple, primary moves are usually in 5 waves, and corrective moves are in 3 waves. There are many variations to that. Wave 2 typically retraces .618 - .786 of wave 1, but it can go deeper, which is why I often hunt for the .886 retrace. Wave 2 can retrace ALL of wave 1, or more, in a flat. Wave 3 is typically 1.62 x wave 1 - 2.00 x wave 1. Wave 4 typically retraces .23 - .382 of wave 3, not the whole move. Wave 5 typically is equal to wave 1, but it can be .886, .786, .618, .50 x wave 1, or even extend, to 1.23 x wave 1.
In the nem chart you can see 5 distinct waves. Most traders would say the move up started at 31.36 in early july, but this scenario proposes that it started earlier, at 31.92 in late april. Wave 1 ended at 35.49. Wave 2 ended at 31.36, retracing ALL of wave 1, and then some. This may have thrown traders off. Then, wave 3 ran to 1.62 x wave 1 at 37.28 (perfection was at 37.14). Wave 4 then retraced .382 of wave 3, and wave 5 = 1.23 x wave 1 at 39.54 (perfection was at 39.55). If this count is correct, then nem has a ways to go to the downside.
An alternate scenario is that if the move DID start in early july, then wave 3 is shorter than wave 1, and once wave 4 completes, we could see a wave 5 that is shorter than wave 3, for an ending or leading diagonal.
Click image for original size
MA
MarcinO
Rep: 67
Posts: 5,506
Wow, rat. That is awesome analysis. I have a similar model of Cable in my mind. By similar I do not mean the same numbers regarding wave count or retracements, but the whole, standard behaviour pattern. It took me a lot of time to build it, but it works most of the time.
Apart from typical number of waves and retracement levels Cable likes the most, over time I have added a couple of other aspects which are quite helpful:
1) Couple of variations to my 'standard' model, which at the beginning seemed like anomalies to me, but now are integral part of my analysis. What makes it pretty useful is that once one of these variants starts to show it will be repeated on different timeframes for a few days, which gives you time to apply the best tactics for given behaviour.
2) Day of week effect. Up to now, I managed to identify patterns for Monday and Friday. The latter one violates standard model, but I know when to expect it, so I am prepared.
3) Placing retracement and number of waves in wider context. For example when a move consisting of standard number of waves retraces .886 or more but cannot make it above 1.0, it usually means reversal. This is very similar to 'failed wave 5' concept in traditional Elliot analysis. This is one of many signals which can be used to notice that the 'standard' model is going to fail in given case and tactics needs to be adjusted.
4) 'Local' fractals - any pattern which starts to be repeatable. By pattern I mean not only price formation, but any other behaviour like time of the day when moves starts, geometry it follows, current range of moves or retracements it likes.
Originally posted by rat89
nem 60 - wave count illustration. There is more than one type of wave count, but to keep it simple, primary moves are usually in 5 waves, and corrective moves are in 3 waves. There are many variations to that. Wave 2 typically retraces .618 - .786 of wave 1, but it can go deeper, which is why I often hunt for the .886 retrace. Wave 2 can retrace ALL of wave 1, or more, in a flat. Wave 3 is typically 1.62 x wave 1 - 2.00 x wave 1. Wave 4 typically retraces .23 - .382 of wave 3, not the whole move. Wave 5 typically is equal to wave 1, but it can be .886, .786, .618, .50 x wave 1, or even extend, to 1.23 x wave 1.
In the nem chart you can see 5 distinct waves. Most traders would say the move up started at 31.36 in early july, but this scenario proposes that it started earlier, at 31.92 in late april. Wave 1 ended at 35.49. Wave 2 ended at 31.36, retracing ALL of wave 1, and then some. This may have thrown traders off. Then, wave 3 ran to 1.62 x wave 1 at 37.28 (perfection was at 37.14). Wave 4 then retraced .382 of wave 3, and wave 5 = 1.23 x wave 1 at 39.54 (perfection was at 39.55). If this count is correct, then nem has a ways to go to the downside.
An alternate scenario is that if the move DID start in early july, then wave 3 is shorter than wave 1, and once wave 4 completes, we could see a wave 5 that is shorter than wave 3, for an ending or leading diagonal.
RA
rat89
Rep: 0
Posts: 7,015
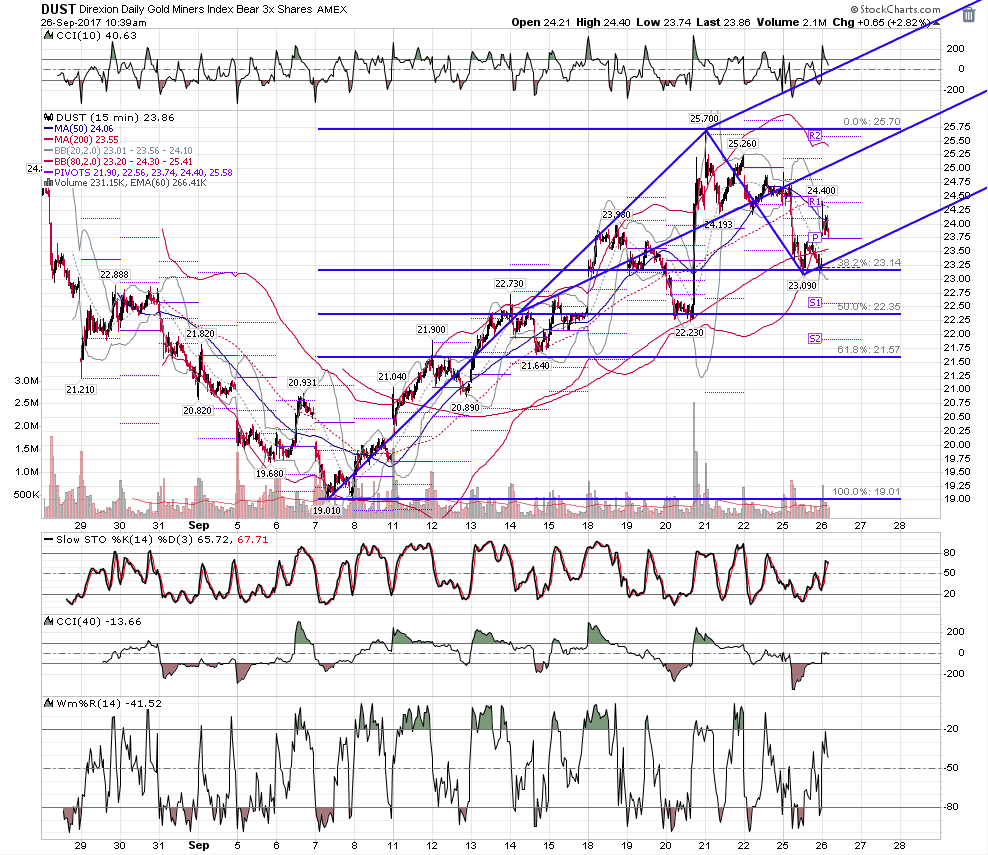
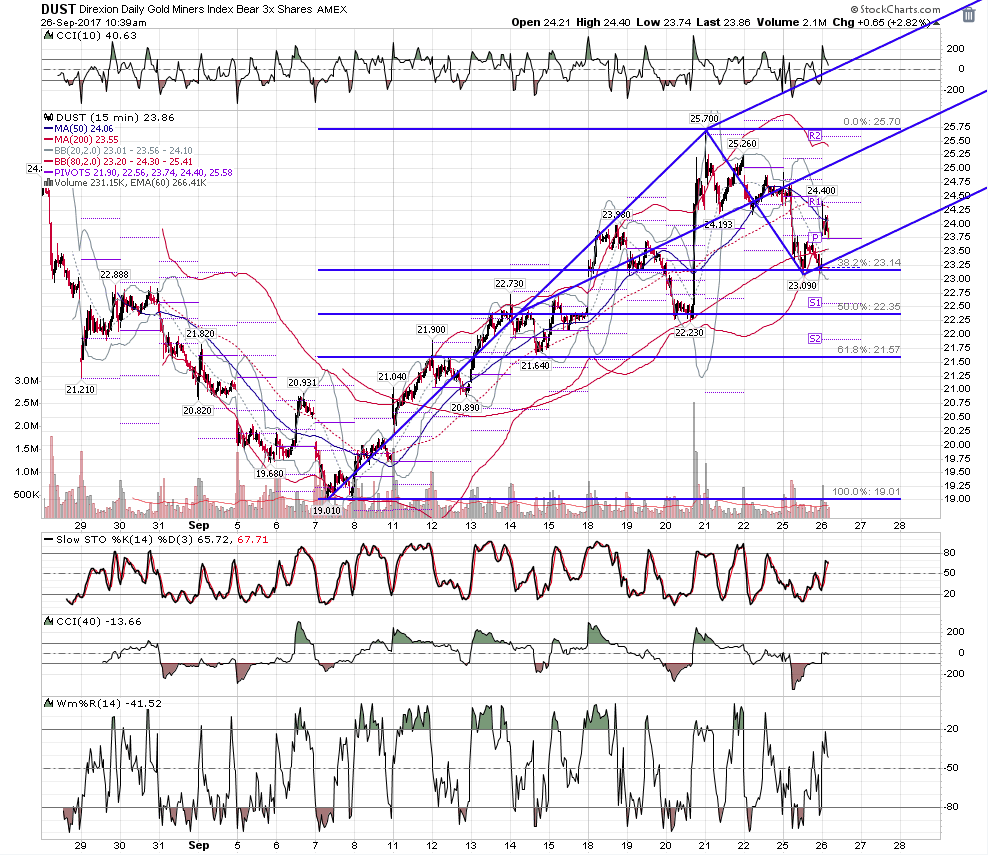
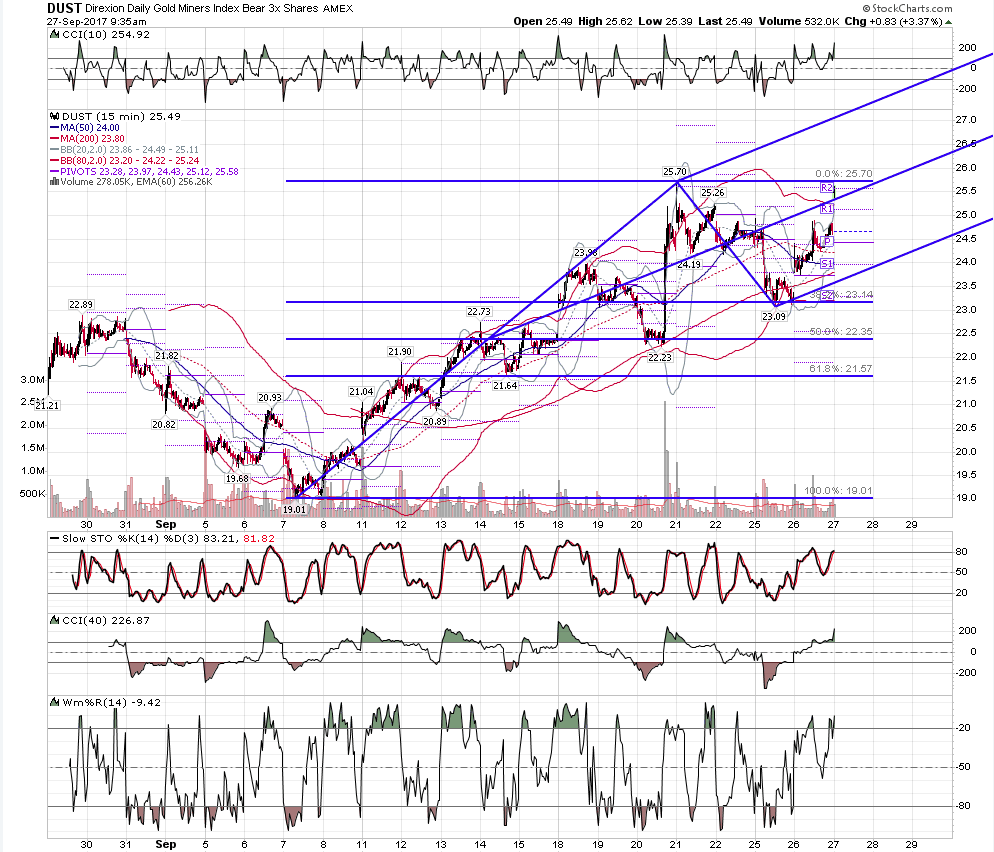
dust then and now
Click image for original size
Click image for original size
RA
rat89
Rep: 0
Posts: 7,015
Thank you for the kind words Marcin. One observation: roofer was the one who pointed me in the direction of ew work, and before that time I would wonder why a reversal setup with all the various tools in place would sometimes fail miserably. I learned that in most of those cases, it was because the tools set up at the end of a wave 3, so the move started, but it was actually in the context of a wave 4, which as we know is shallow, and sets up wave 5 to complete the move.
MA
MarcinO
Rep: 67
Posts: 5,506
Yes, this is absolutely right. What one needs to keep in mind is that typical number of waves for each market can be different, so you should rely rather on your observations than theory.
Another thing, which can make a market read you mentioned tricky, are extended and/or composed waves. Following your example, one may think that W5 is done but it turns out that it was simply W1 of much longer W5.
Another thing, which can make a market read you mentioned tricky, are extended and/or composed waves. Following your example, one may think that W5 is done but it turns out that it was simply W1 of much longer W5.
Originally posted by rat89
Thank you for the kind words Marcin. One observation: roofer was the one who pointed me in the direction of ew work, and before that time I would wonder why a reversal setup with all the various tools in place would sometimes fail miserably. I learned that in most of those cases, it was because the tools set up at the end of a wave 3, so the move started, but it was actually in the context of a wave 4, which as we know is shallow, and sets up wave 5 to complete the move.