Starting it off.
Al
RA
rat89
Rep: 0
Posts: 7,015
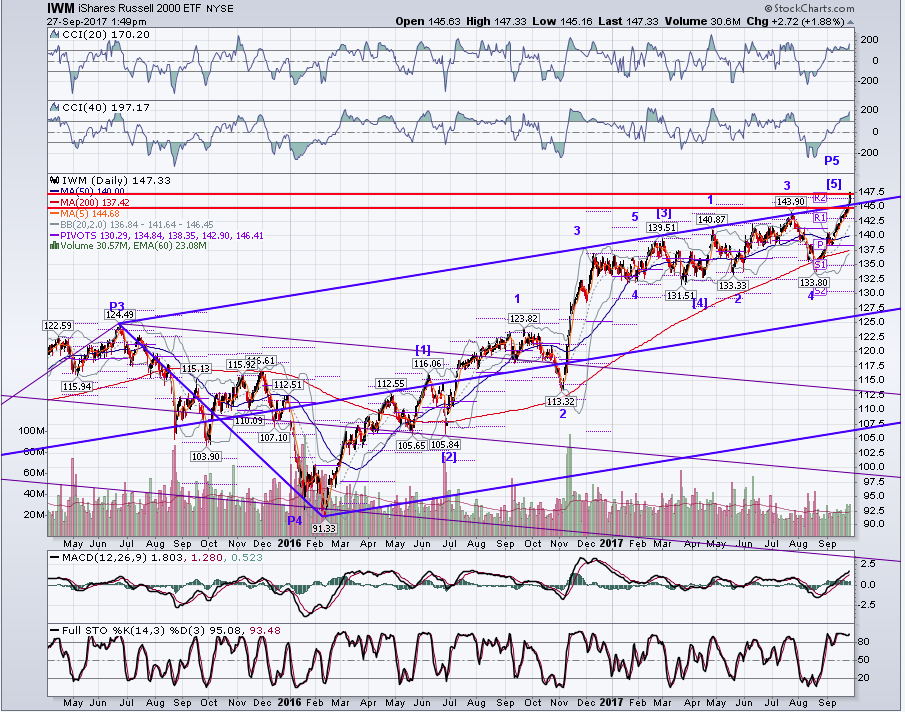
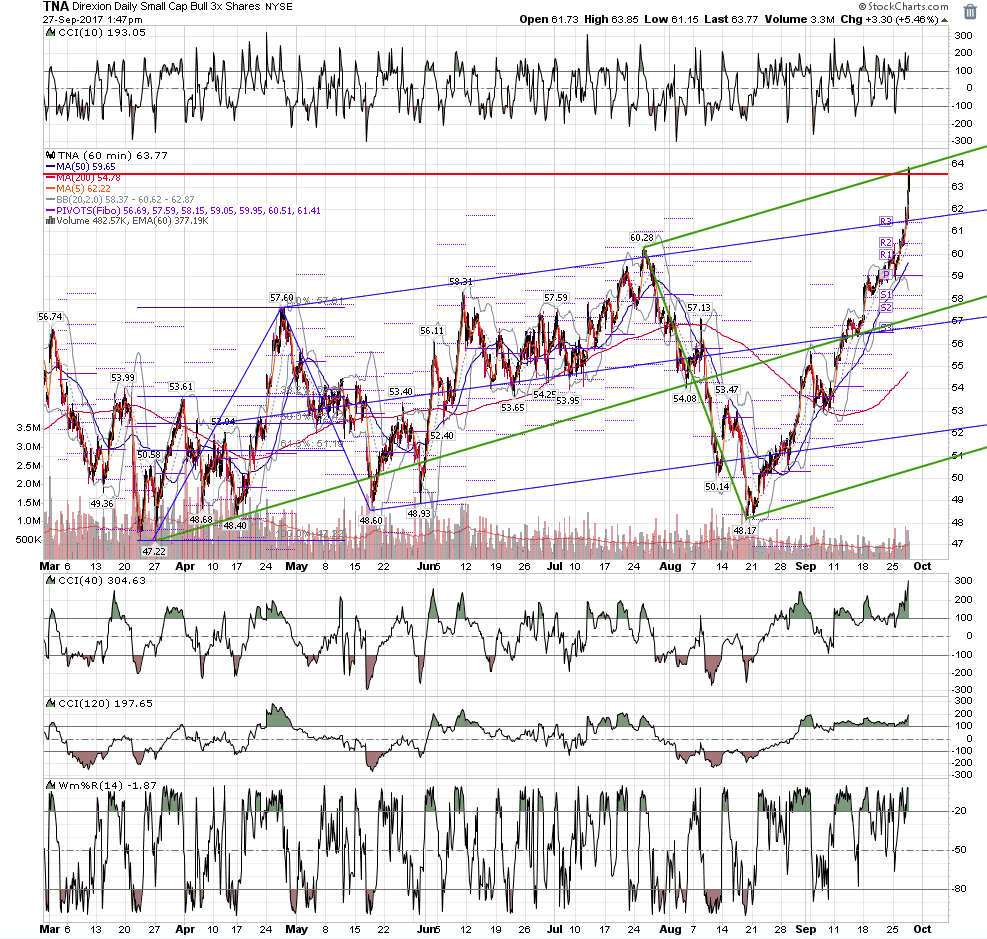
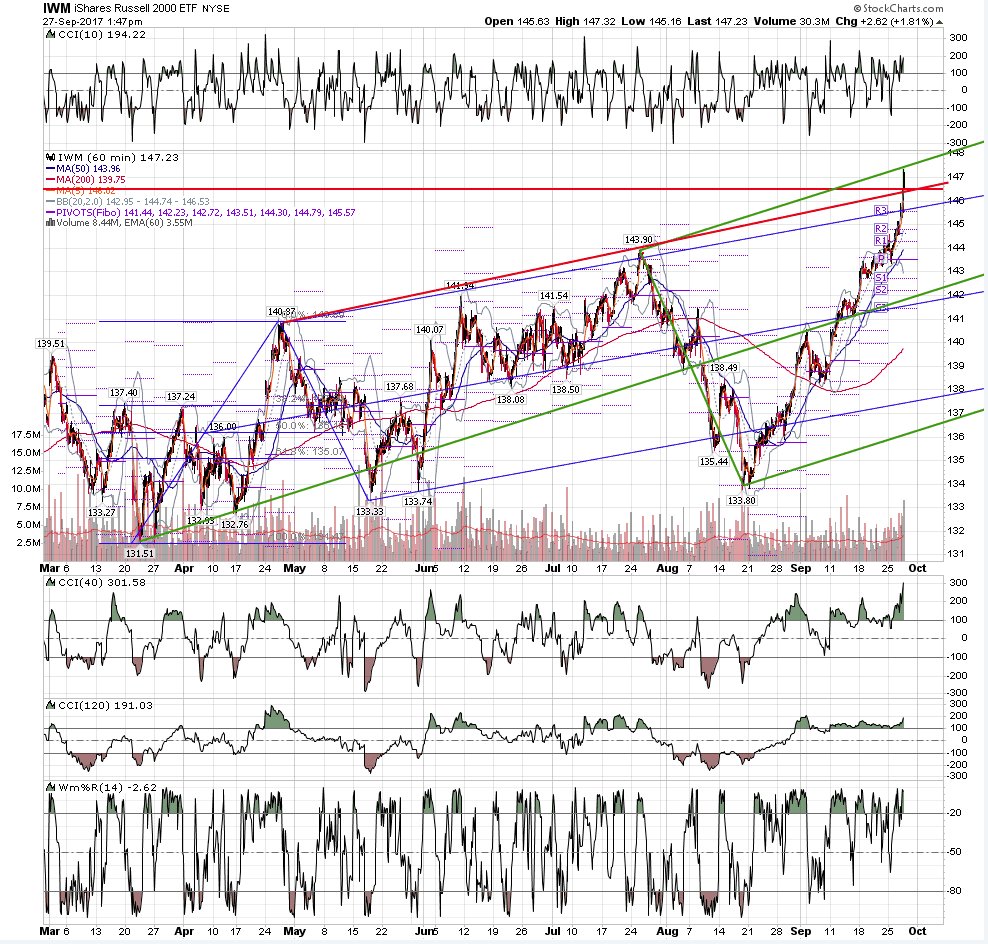
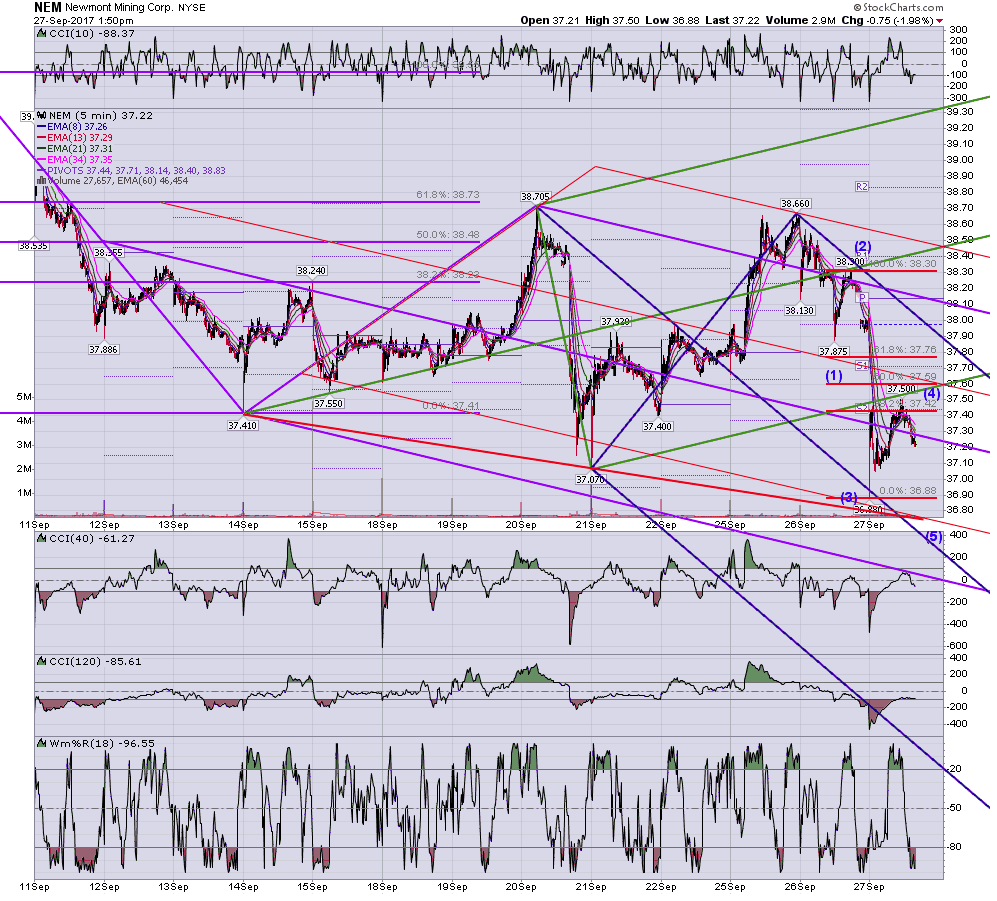
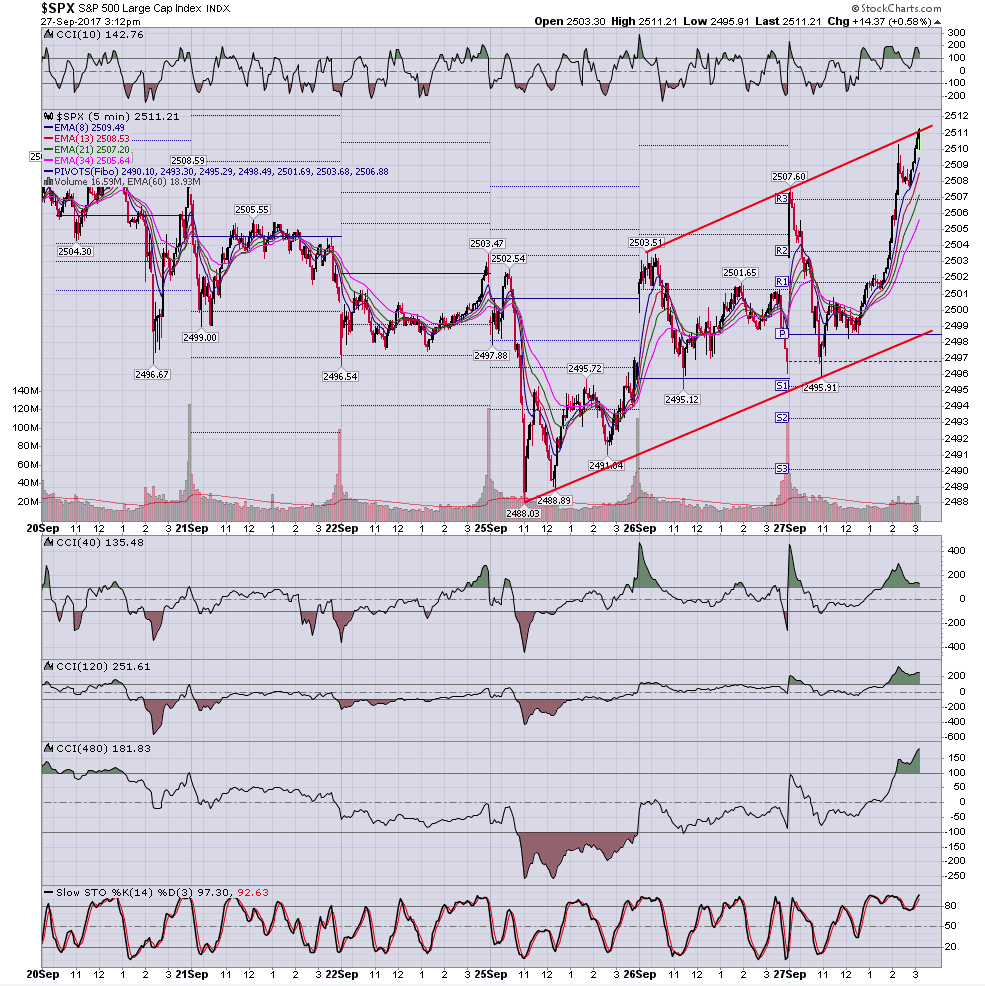
Exactly right. This looming 2513 - 2525 area on spx for instance...is that the end of Major [5] or Major [1]? We won't know until we see what the pullback is like.
By the way, remember the abcd that ends in the .382 area, as a very high probability that price will then move back up to the high (or the low)? The abcd is a wave 4. But of course!
By the way, remember the abcd that ends in the .382 area, as a very high probability that price will then move back up to the high (or the low)? The abcd is a wave 4. But of course!
Originally posted by MarcinO
Yes, this is absolutely right. What one needs to keep in mind is that typical number of waves for each market can be different, so you should rely rather on your observations than theory.
Another thing, which can make a market read you mentioned tricky, are extended and/or composed waves. Following your example, one may think that W5 is done but it turns out that it was simply W1 of much longer W5.
Originally posted by rat89
Thank you for the kind words Marcin. One observation: roofer was the one who pointed me in the direction of ew work, and before that time I would wonder why a reversal setup with all the various tools in place would sometimes fail miserably. I learned that in most of those cases, it was because the tools set up at the end of a wave 3, so the move started, but it was actually in the context of a wave 4, which as we know is shallow, and sets up wave 5 to complete the move.
RA
rat89
Rep: 0
Posts: 7,015
Click image for original size
Click image for original size
Click image for original size
MA
MarcinO
Rep: 67
Posts: 5,506
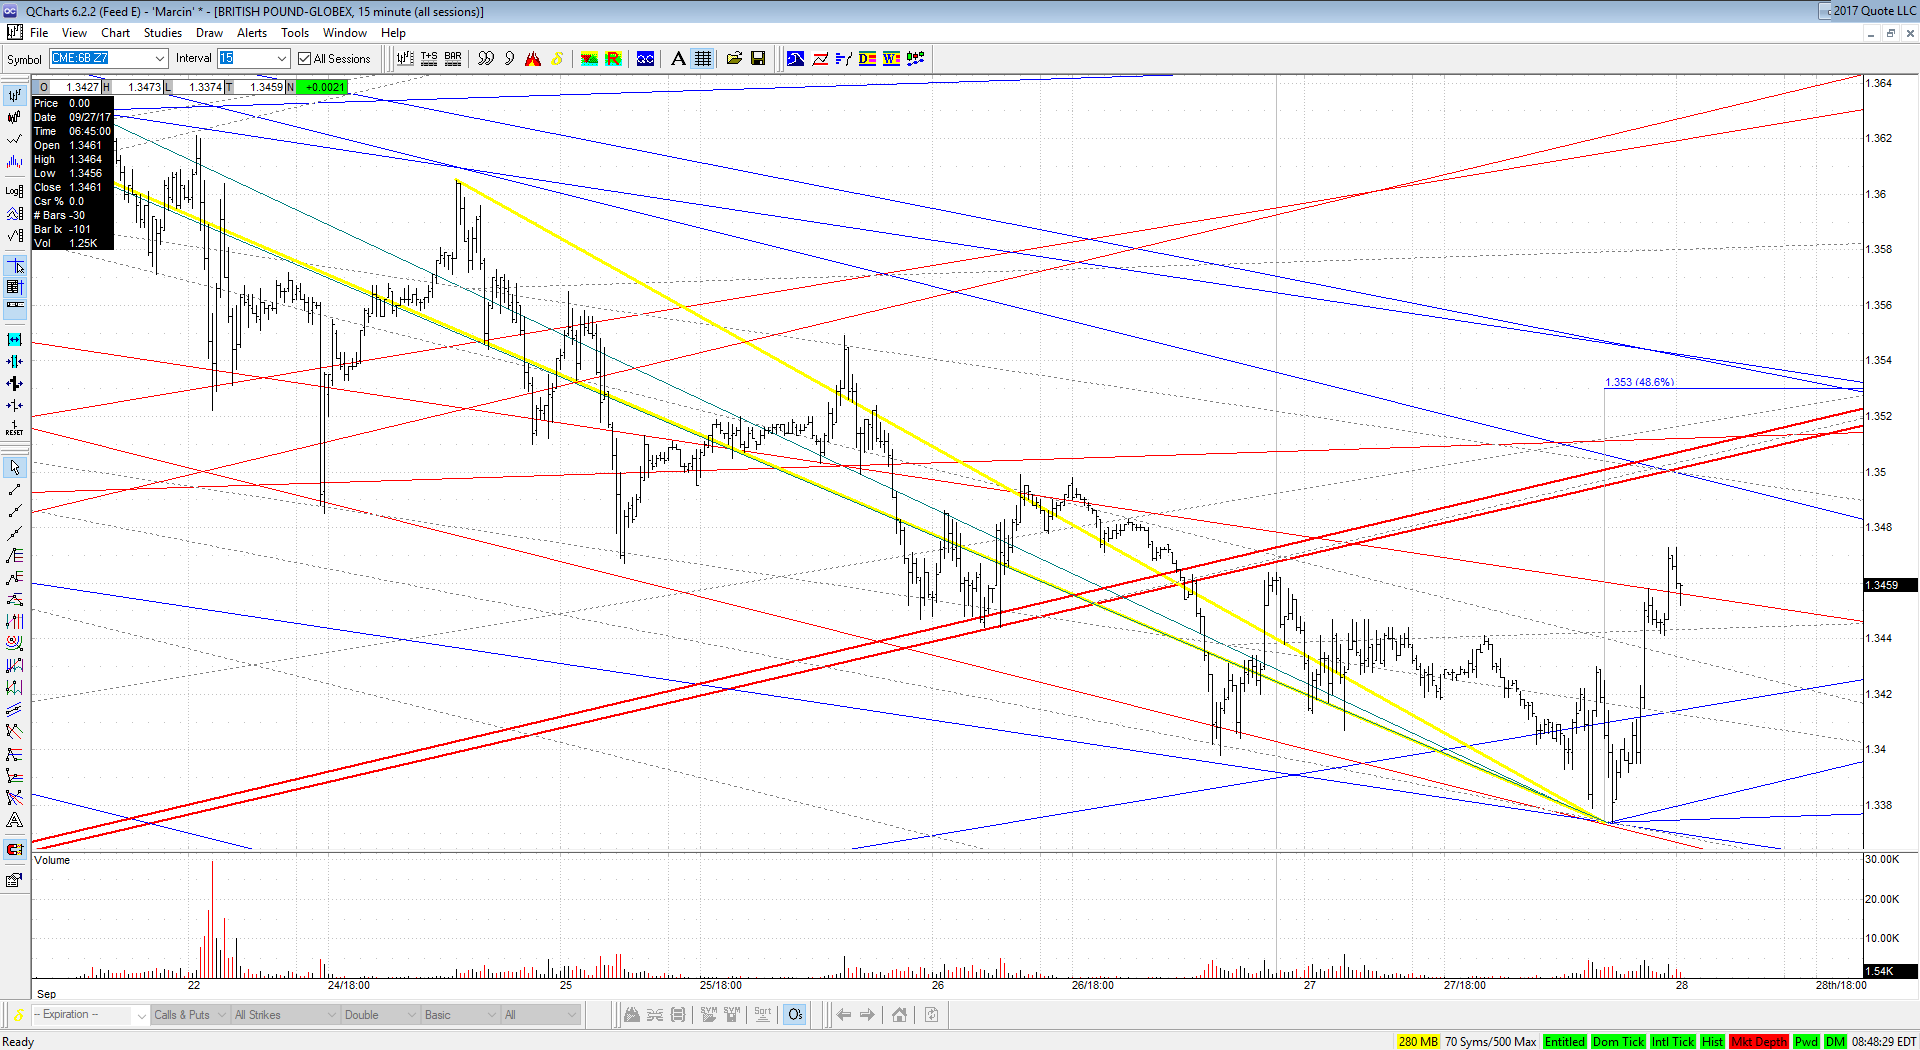
Cable needed to drop belo 1.34 to start a bigger correction.
1.35 and 1.3530-40 are my critical reversal areas.
1.35 and 1.3530-40 are my critical reversal areas.
Click image for original size
MA
MarcinO
Rep: 67
Posts: 5,506
That is right. One more thing that can be used to indicate the most probable size of this waves is your analysis of typical retracements and expansions, but repeated on different timeframes, in other words combining information from waves of different sizes - e.g. my supposed W1, is W1 of W3 of a bigger structure and so on...
I found it very helpful in selecting the most probable scenarios.
But after all, as you wrote, it's the price action which tells you exactly what has just happened.
I found it very helpful in selecting the most probable scenarios.
But after all, as you wrote, it's the price action which tells you exactly what has just happened.
Originally posted by rat89
Exactly right. This looming 2513 - 2525 area on spx for instance...is that the end of Major [5] or Major [1]? We won't know until we see what the pullback is like.
By the way, remember the abcd that ends in the .382 area, as a very high probability that price will then move back up to the high (or the low)? The abcd is a wave 4. But of course!
Originally posted by MarcinO
Yes, this is absolutely right. What one needs to keep in mind is that typical number of waves for each market can be different, so you should rely rather on your observations than theory.
Another thing, which can make a market read you mentioned tricky, are extended and/or composed waves. Following your example, one may think that W5 is done but it turns out that it was simply W1 of much longer W5.
Originally posted by rat89
Thank you for the kind words Marcin. One observation: roofer was the one who pointed me in the direction of ew work, and before that time I would wonder why a reversal setup with all the various tools in place would sometimes fail miserably. I learned that in most of those cases, it was because the tools set up at the end of a wave 3, so the move started, but it was actually in the context of a wave 4, which as we know is shallow, and sets up wave 5 to complete the move.
MA
MarcinO
Rep: 67
Posts: 5,506
Thanks, Al.
Originally posted by albert
rat and marcin, simply amazing work and analyses. I am awed.
Al
AL
albert
Rep: 99
Posts: 3,094
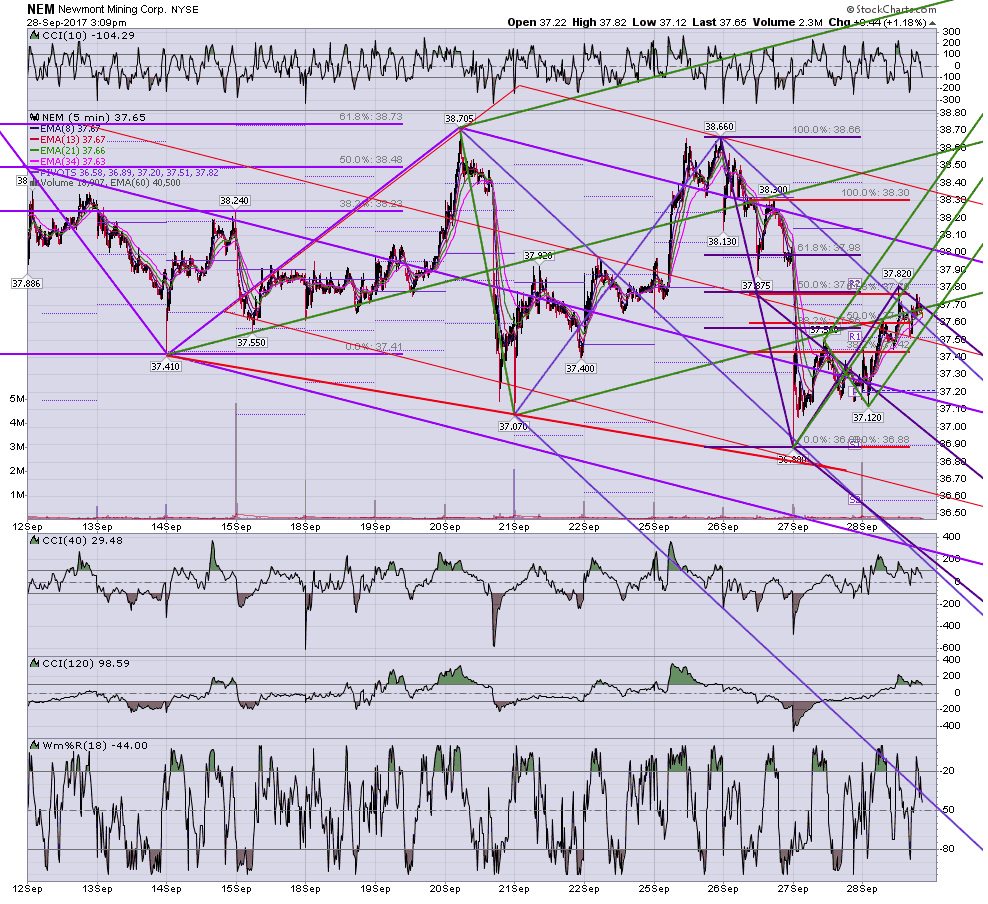
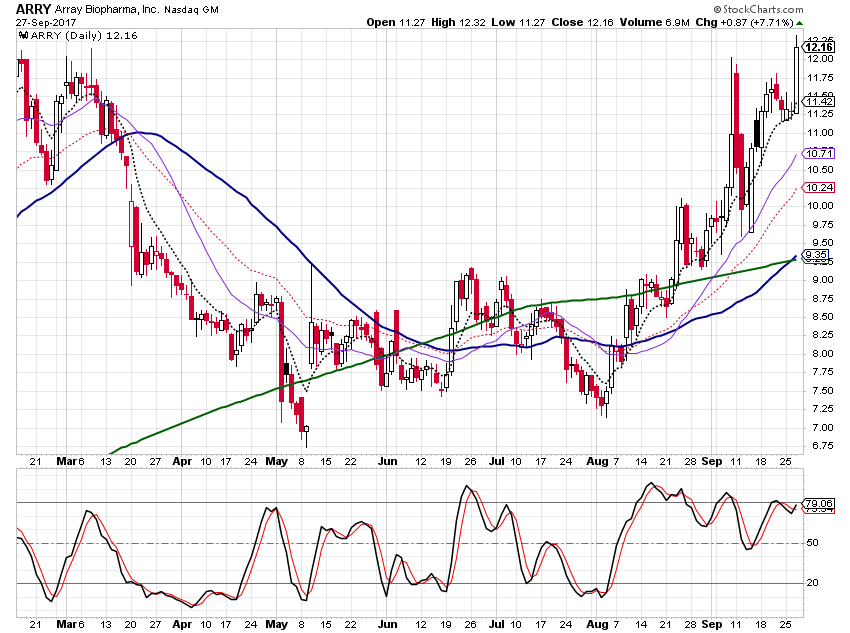
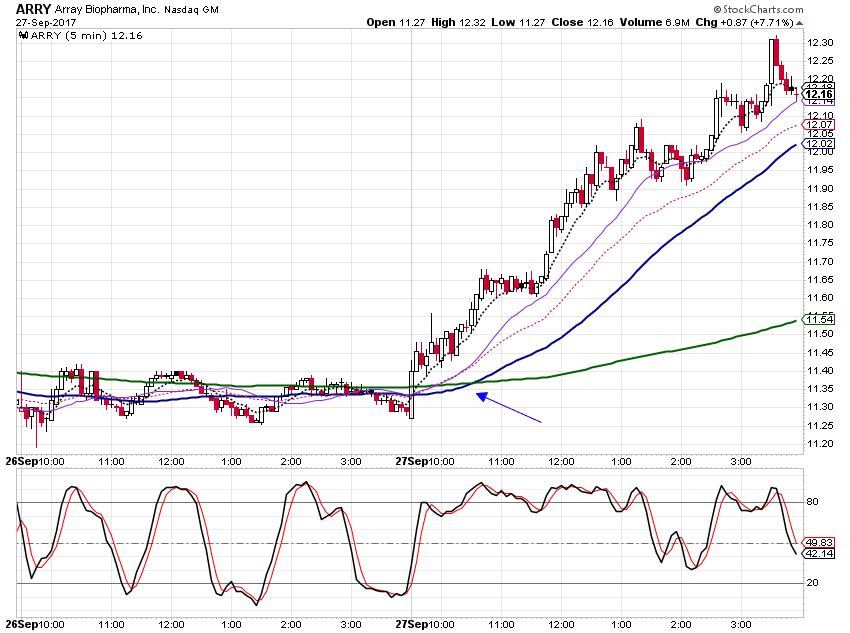
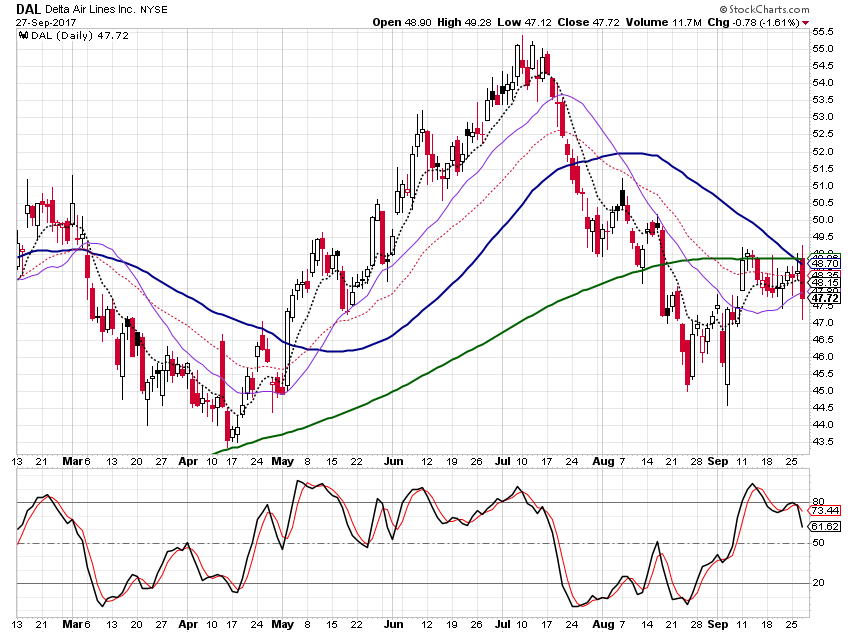
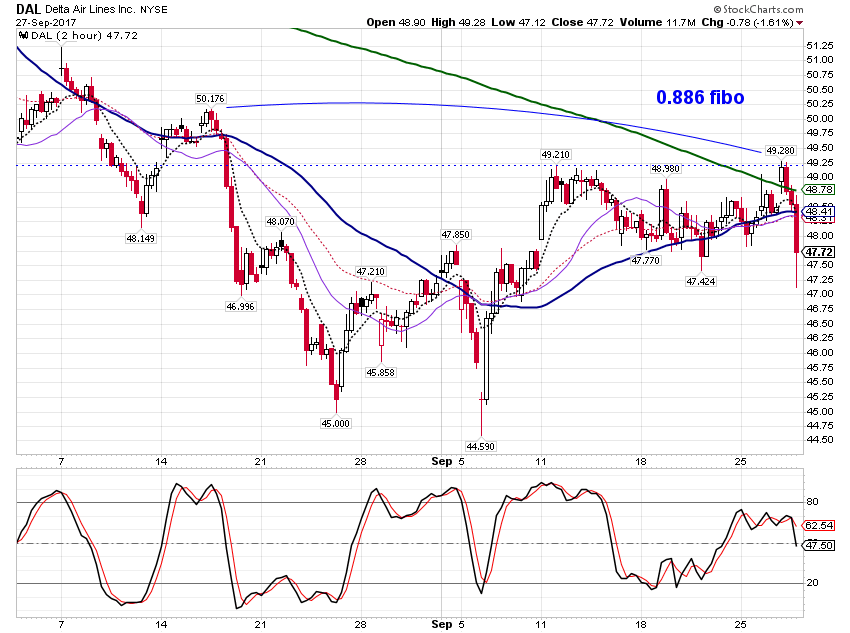
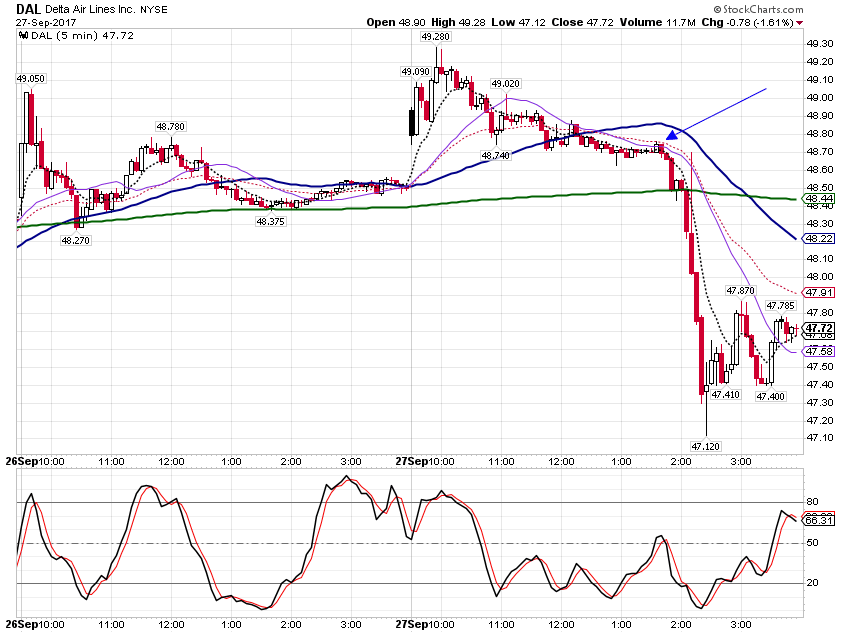
I am trying to master the craft of trading. I made a bit on DAL going long.
Click image for original size
Click image for original size
Click image for original size
Click image for original size
Click image for original size
Click image for original size
Click image for original size
Click image for original size