Starting it off.
Al
RA
rat89
Rep: 0
Posts: 7,015
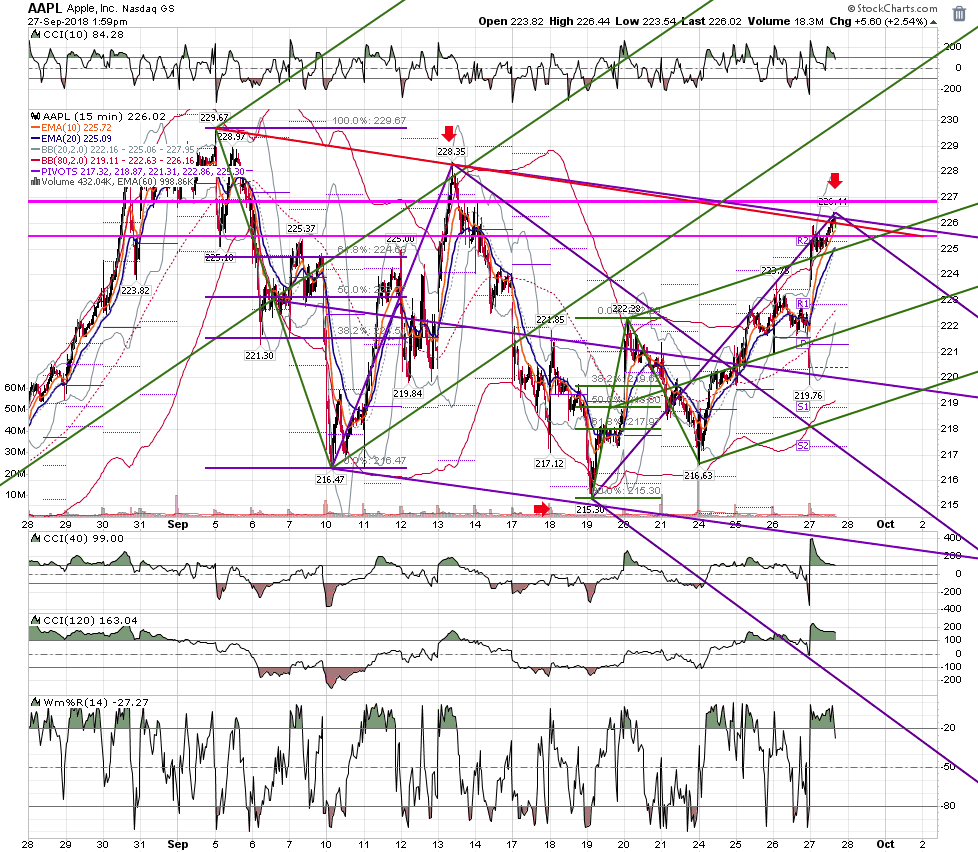
Al, zoom out on your aapl a bit, and you will see the significance of 226.85 = .785 of the first high, and .886 of the second high, with a trend line test.....qqq is dancing around the big .886, it's possible it's waiting for aapl
Click image for original size
RA
rat89
Rep: 0
Posts: 7,015
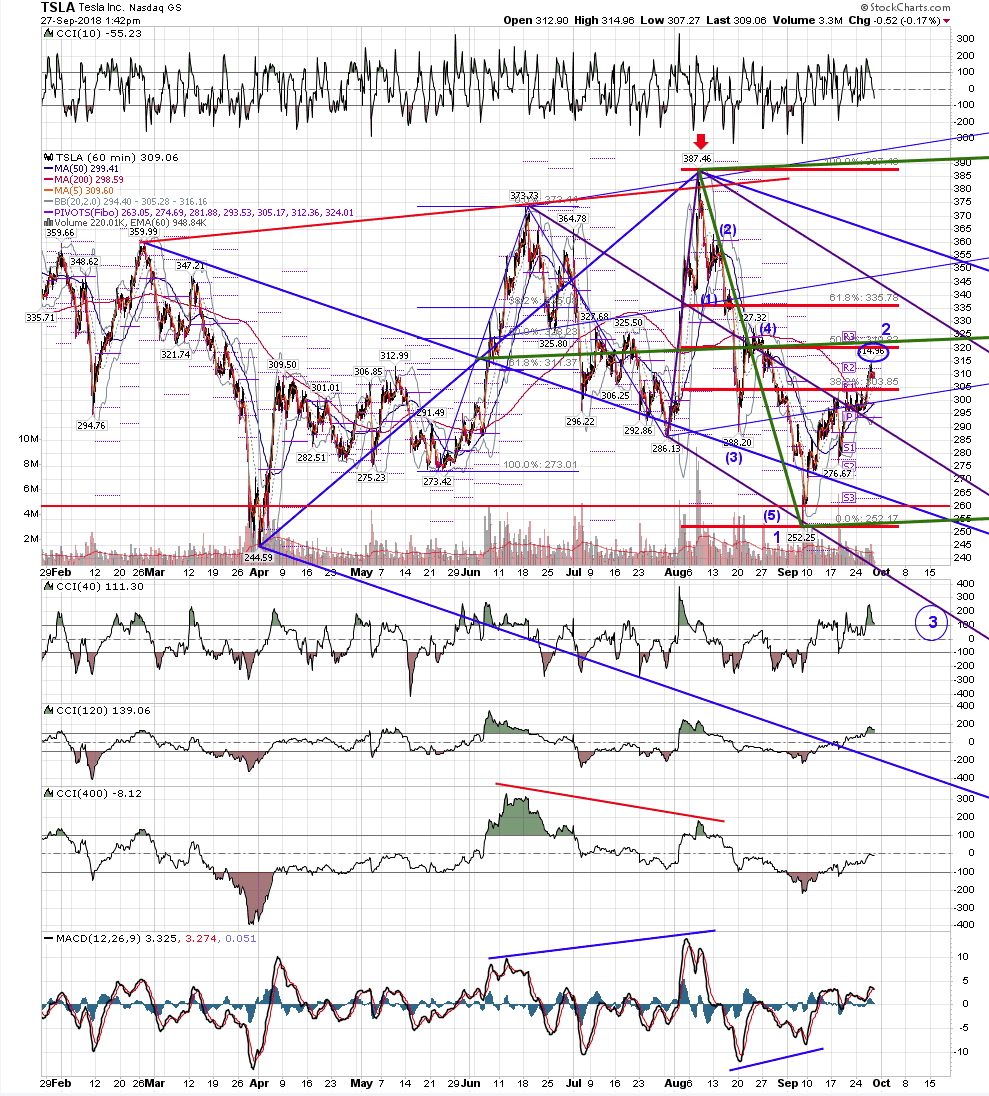
tsla 60 - there is a very nice 5 wave move down from 387.46 to 252.25, where wave (3)=1.62-2.00*(1), and where (5)=1.62*(1). Wave 2 has been heading toward a 50% retrace around 120 at the green median line. Price may have turned today at 115, leaving an unfinished bull move in median line terms, which almost always means price will return to the lower line (green). Once wave 2 is complete, there is likely a sharp move down for wave 3, within the context of wave Major [3] down - wave Major [2] completed at 387.46. We shall see.
Click image for original size
RA
rat89
Rep: 0
Posts: 7,015
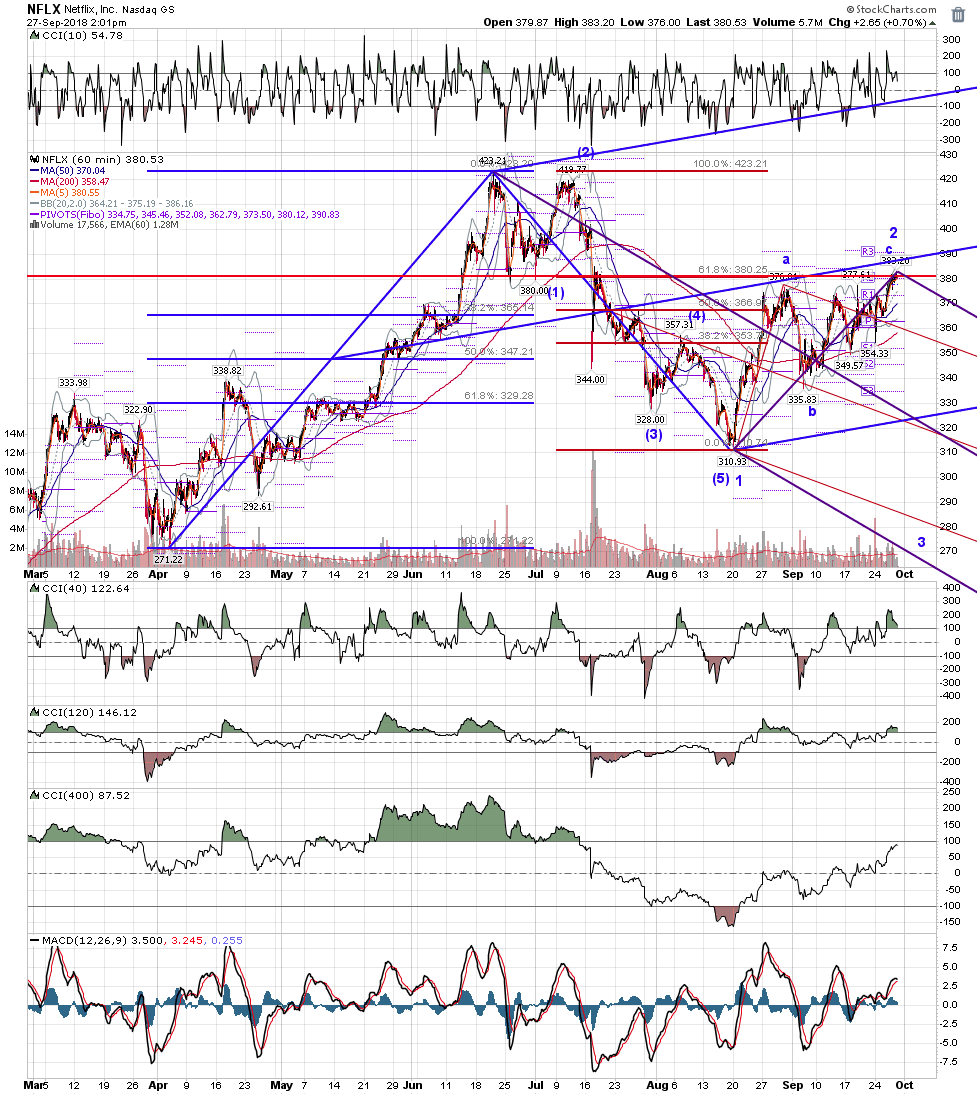
this on is fun....and back up and look at the context
Click image for original size
Click image for original size
RA
rat89
Rep: 0
Posts: 7,015
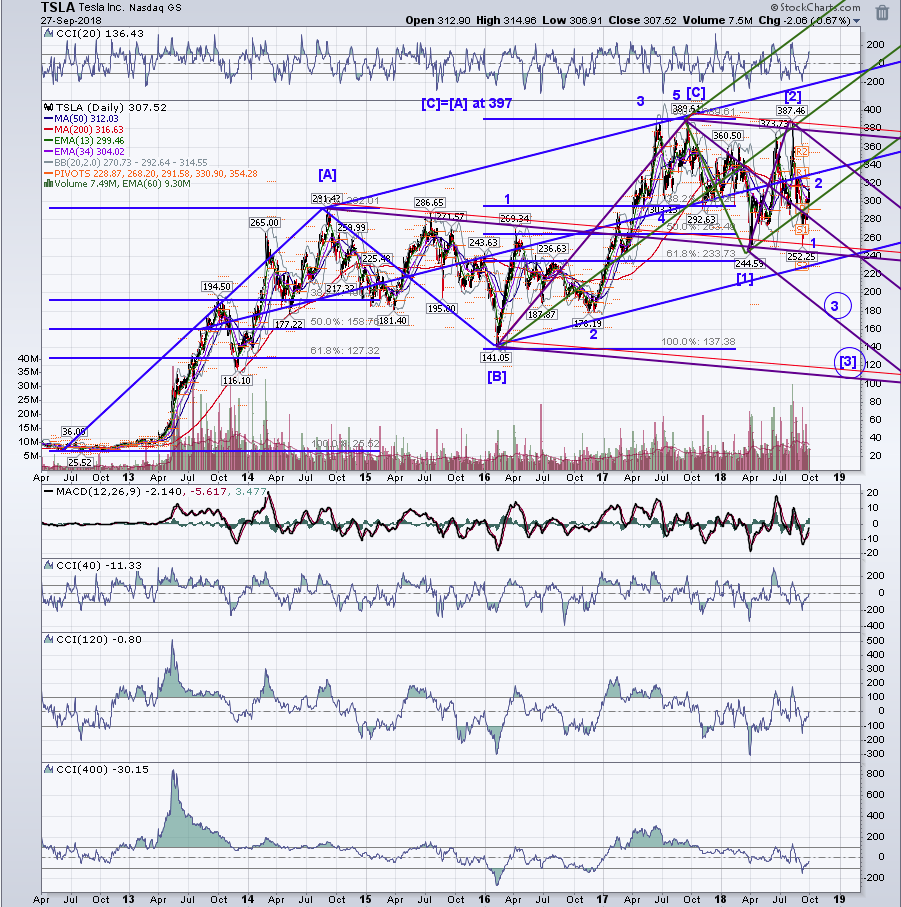
tsla daily - from what I see, wave [C] ended at 389, and it has been in a bear move since mid 2017, with major [1] at 244, major [2] at 387, and now working on major [3]. Within major [3],, minor 1 made five waves down to 252.25, and minor 2 appears to have ended today at 315, just under a 50% retrace of minor 1. It is not in a 3 of [3], and wave 3 in the primary direction is an impulse wave.
Click image for original size
AL
albert
Rep: 99
Posts: 3,094
rat,
I am on it!
Thanks,
Al
I am on it!
Thanks,
Al
Originally posted by rat89
Al, zoom out on your aapl a bit, and you will see the significance of 226.85 = .785 of the first high, and .886 of the second high, with a trend line test.....qqq is dancing around the big .886, it's possible it's waiting for aapl
Click image for original size
AL
albert
Rep: 99
Posts: 3,094
I see the trendline and fibos in the AAPL price reversal at 266.44. I see it!. rat, you are totally awesome. My view of price action in really myopic compared to yours. Thank you for that insight! Simply amazing! You have great insight into the markets!
I will definitely have to include the longer range view in my Trading Plan.
Good Trading,
Al
:--)
I will definitely have to include the longer range view in my Trading Plan.
Good Trading,
Al
:--)
Originally posted by rat89
Al, zoom out on your aapl a bit, and you will see the significance of 226.85 = .785 of the first high, and .886 of the second high, with a trend line test.....qqq is dancing around the big .886, it's possible it's waiting for aapl
Click image for original size
AL
albert
Rep: 99
Posts: 3,094
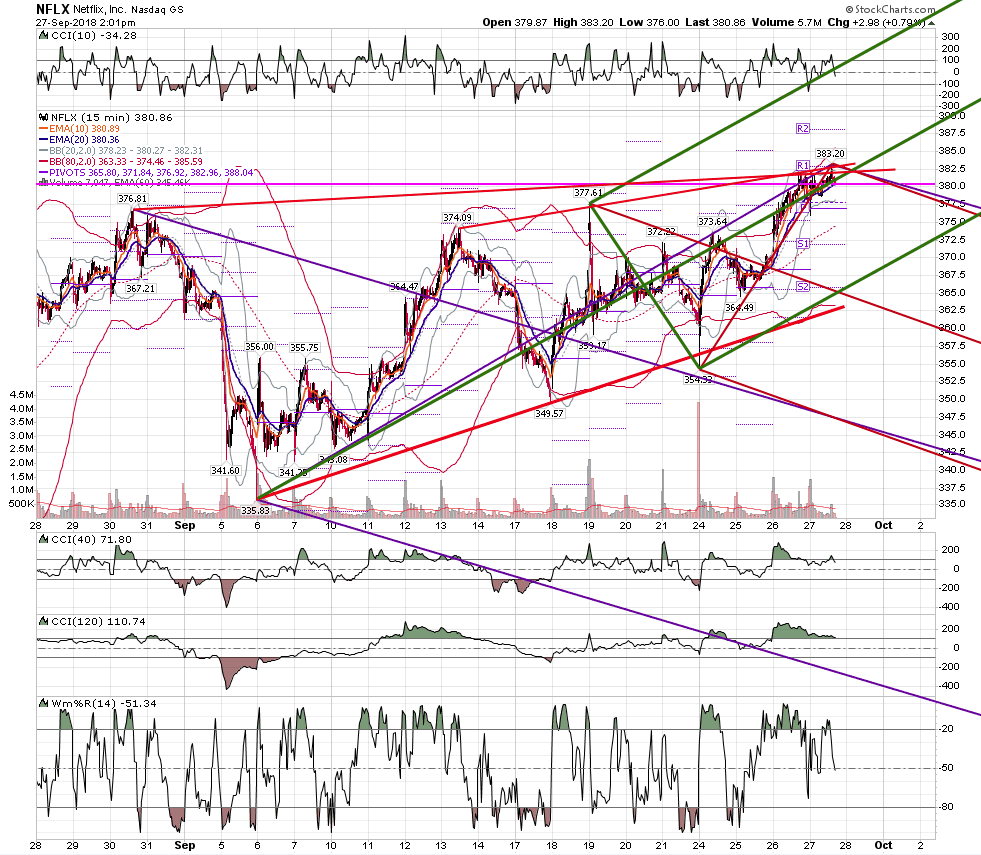
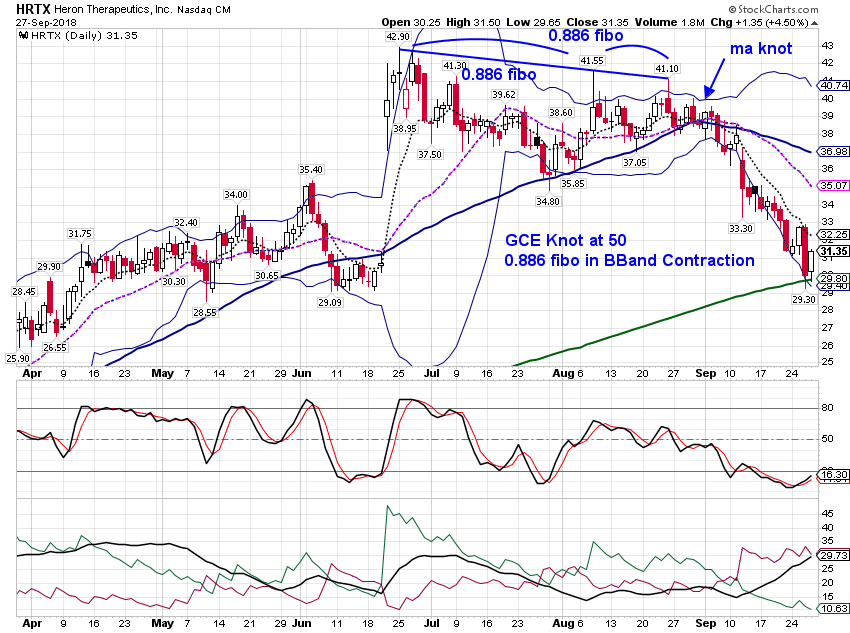
No paper trade, just an interesting chart.
Al
Click image for original size
Al
AL
albert
Rep: 99
Posts: 3,094
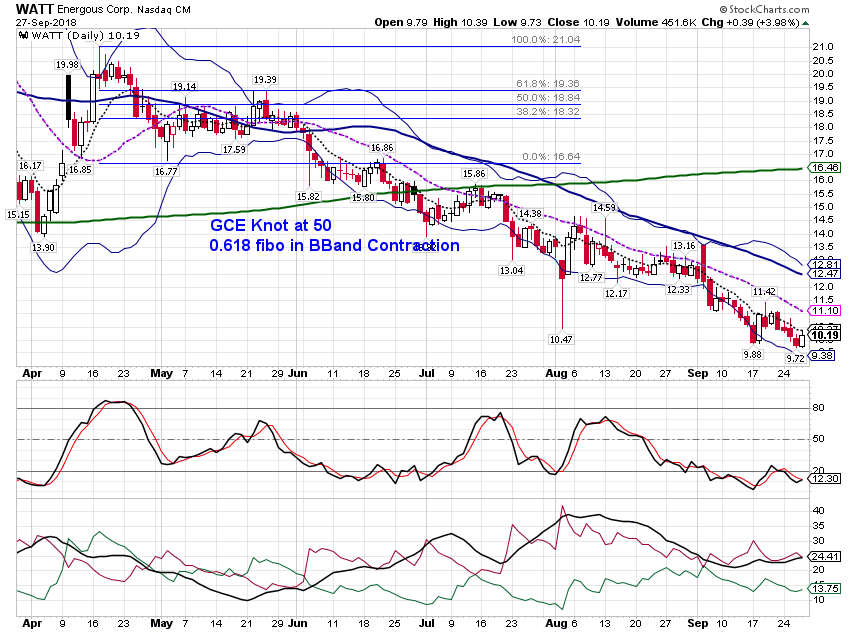
Another one. No paper trade, just an interesting chart. Similar.
Originally posted by albert
No paper trade, just an interesting chart.
Click image for original size
Al
Click image for original size
AL
albert
Rep: 99
Posts: 3,094
rat,
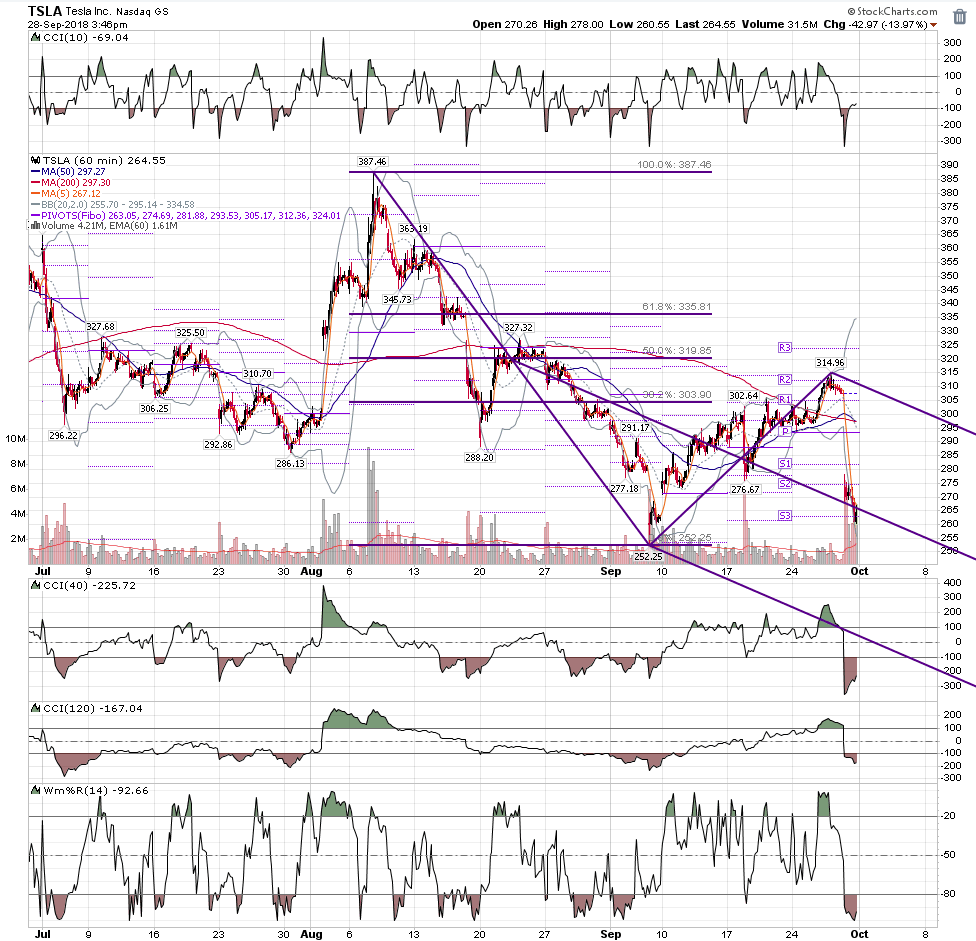
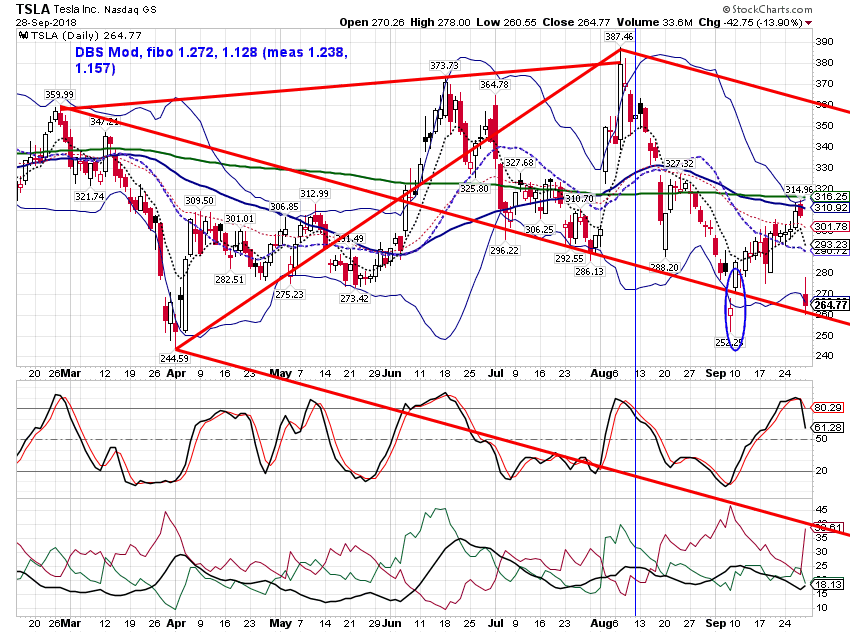
Impressive work. Simply amazing! Your chart inspired me to add a couple of TSLA charts of my own.
I really like to use Double Tops as a base to draw ML sets. I drew a ML set based on what I call a "Double Top followed by a Zig-Zag", in order to see if price reached the ML. It did, and then dropped, as you show. You nailed it! I appreciate your systematic and consistant approach.
Best,
Al
Impressive work. Simply amazing! Your chart inspired me to add a couple of TSLA charts of my own.
Originally posted by rat89
Click image for original size
Click image for original size
Click image for original size
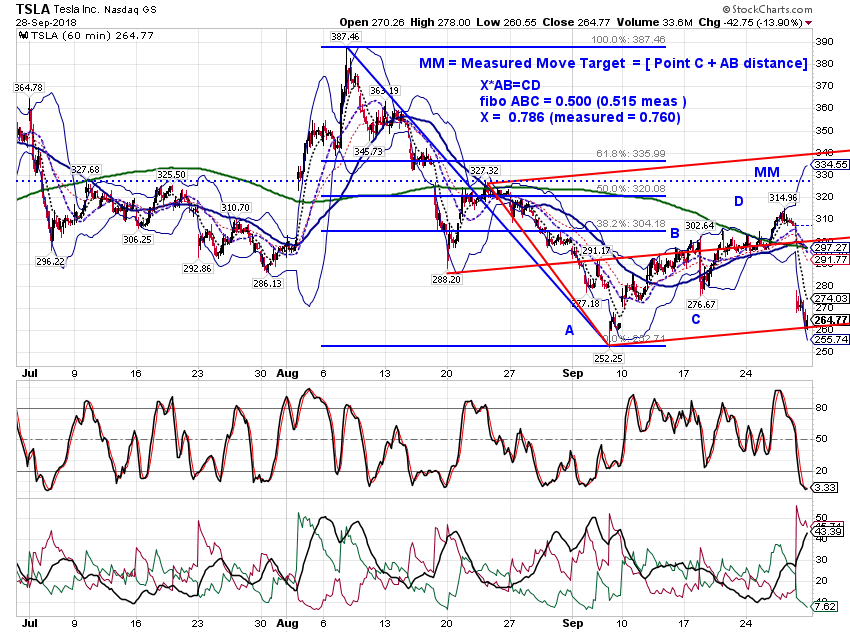
I really like to use Double Tops as a base to draw ML sets. I drew a ML set based on what I call a "Double Top followed by a Zig-Zag", in order to see if price reached the ML. It did, and then dropped, as you show. You nailed it! I appreciate your systematic and consistant approach.
Best,
Al