Starting it off.
Al
AL
albert
Rep: 99
Posts: 3,094
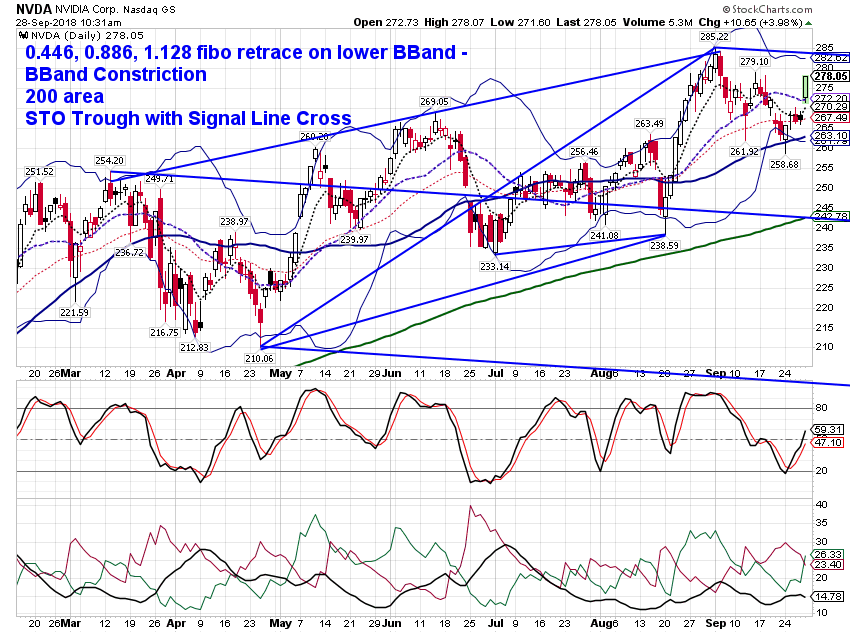
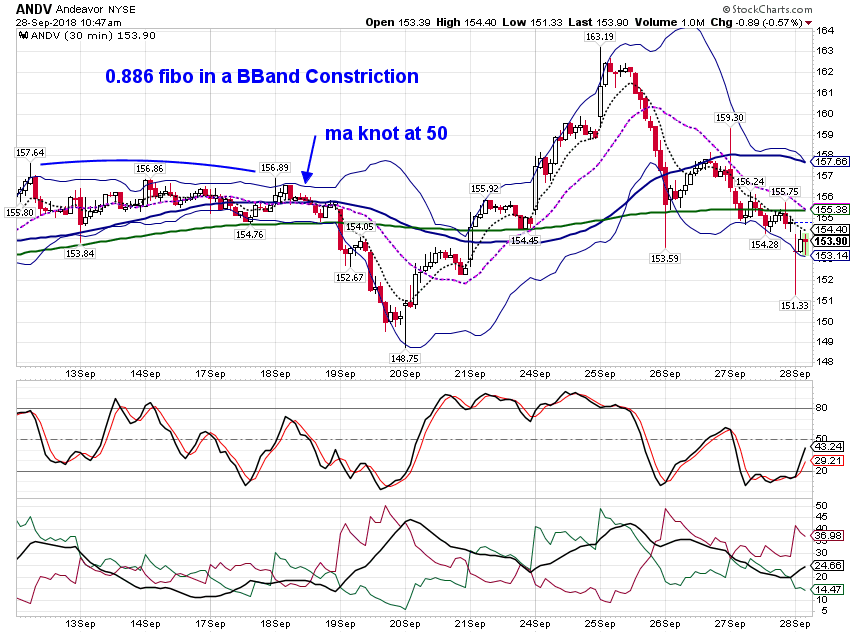
No trades, interesting chart. fibos at BBand constriction.
Al
:--)
Click image for original size
Al
:--)
RA
rat89
Rep: 0
Posts: 7,015
Cool.....trade on the 5 minute, but do the work on the 15 and 60 minute, and once in a while look at the daily chart....
Originally posted by albert
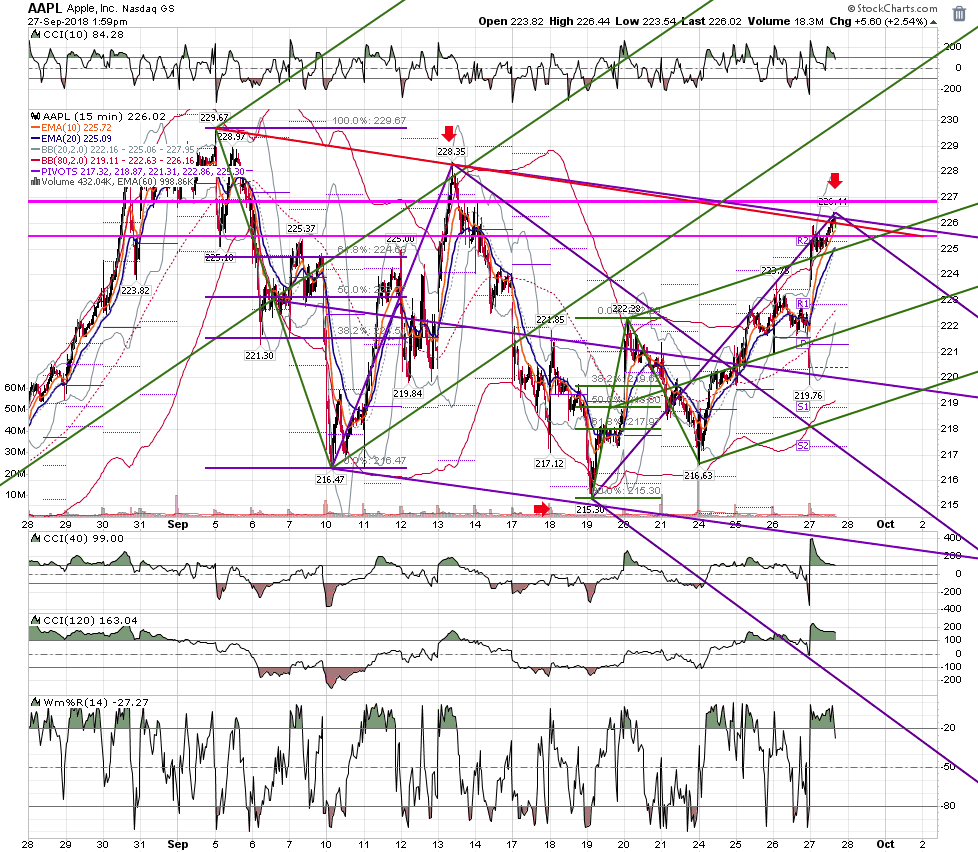
I see the trendline and fibos in the AAPL price reversal at 266.44. I see it!. rat, you are totally awesome. My view of price action in really myopic compared to yours. Thank you for that insight! Simply amazing! You have great insight into the markets!
I will definitely have to include the longer range view in my Trading Plan.
Good Trading,
Al
:--)
Originally posted by rat89
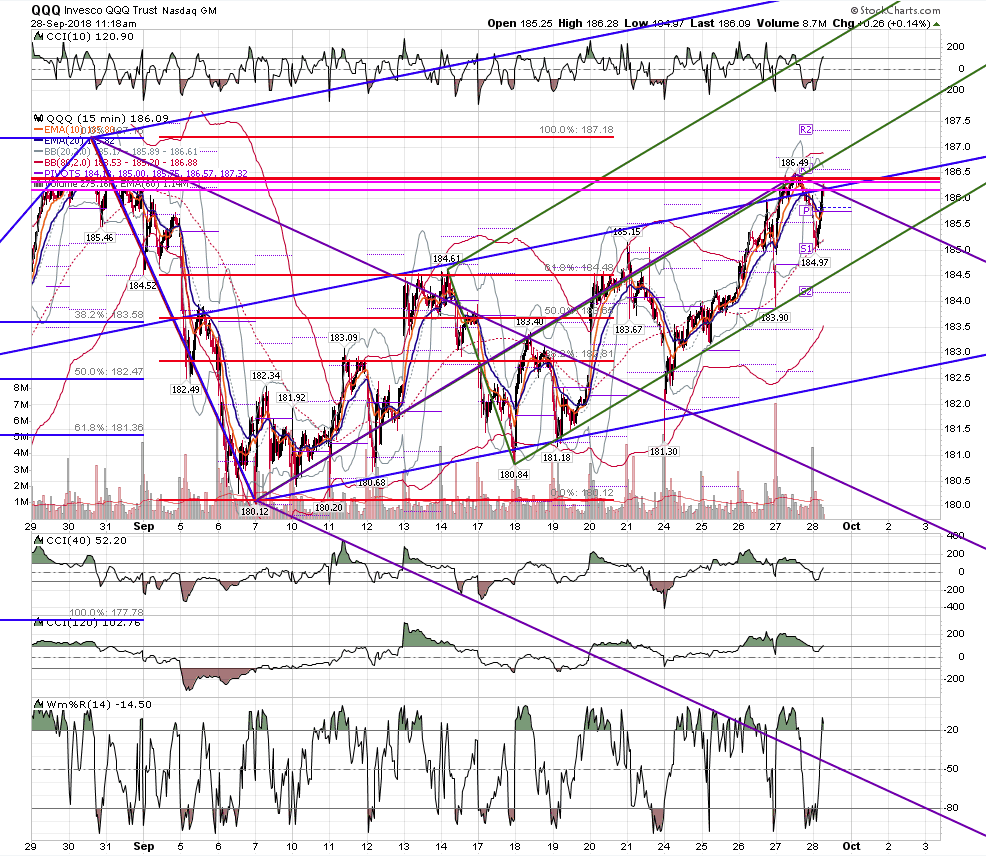
Al, zoom out on your aapl a bit, and you will see the significance of 226.85 = .785 of the first high, and .886 of the second high, with a trend line test.....qqq is dancing around the big .886, it's possible it's waiting for aapl
Click image for original size
RA
rat89
Rep: 0
Posts: 7,015
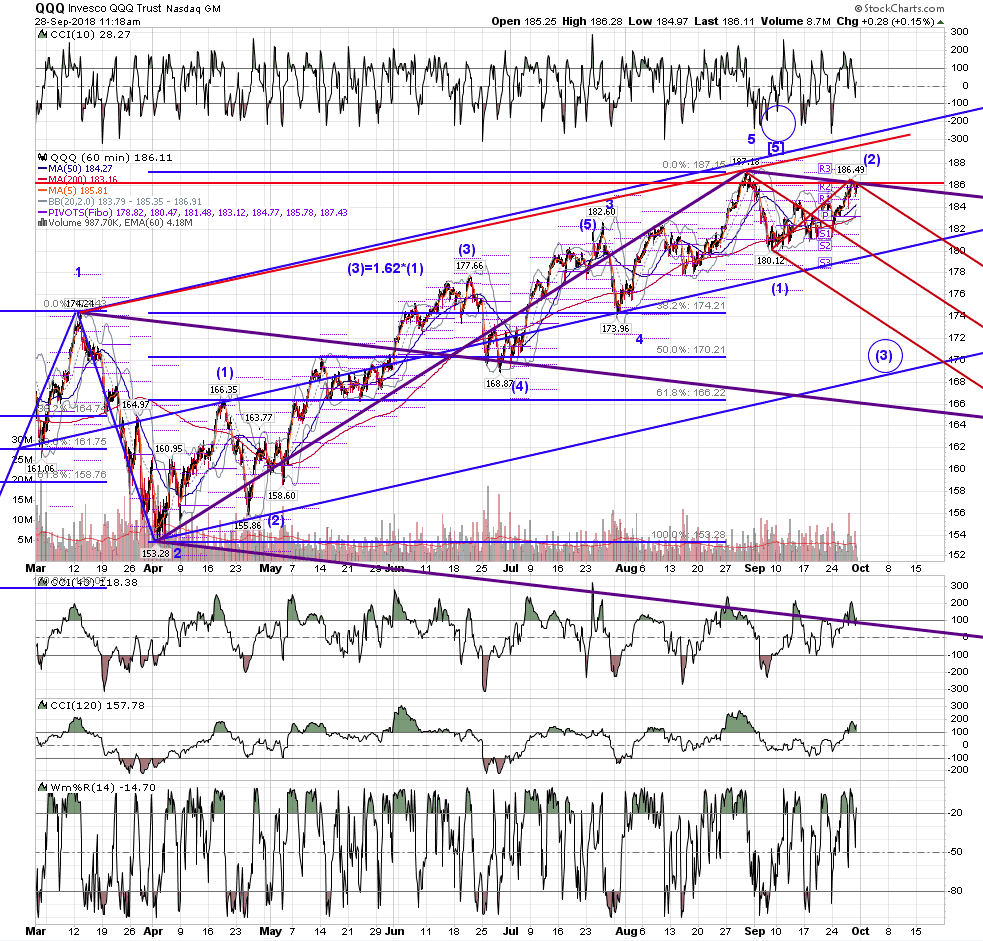
key key key inflection point here......says qqq likely to go down hard over the next several sessions
Click image for original size
Click image for original size
AL
albert
Rep: 99
Posts: 3,094
rat,
I will do it. I will include that in my trading plan and read it and do it,
Al :--)
I will do it. I will include that in my trading plan and read it and do it,
Al :--)
Originally posted by rat89
Cool.....trade on the 5 minute, but do the work on the 15 and 60 minute, and once in a while look at the daily chart....
Originally posted by albert
I see the trendline and fibos in the AAPL price reversal at 266.44. I see it!. rat, you are totally awesome. My view of price action in really myopic compared to yours. Thank you for that insight! Simply amazing! You have great insight into the markets!
I will definitely have to include the longer range view in my Trading Plan.
Good Trading,
Al
:--)
Originally posted by rat89
Al, zoom out on your aapl a bit, and you will see the significance of 226.85 = .785 of the first high, and .886 of the second high, with a trend line test.....qqq is dancing around the big .886, it's possible it's waiting for aapl
Click image for original size
AL
albert
Rep: 99
Posts: 3,094
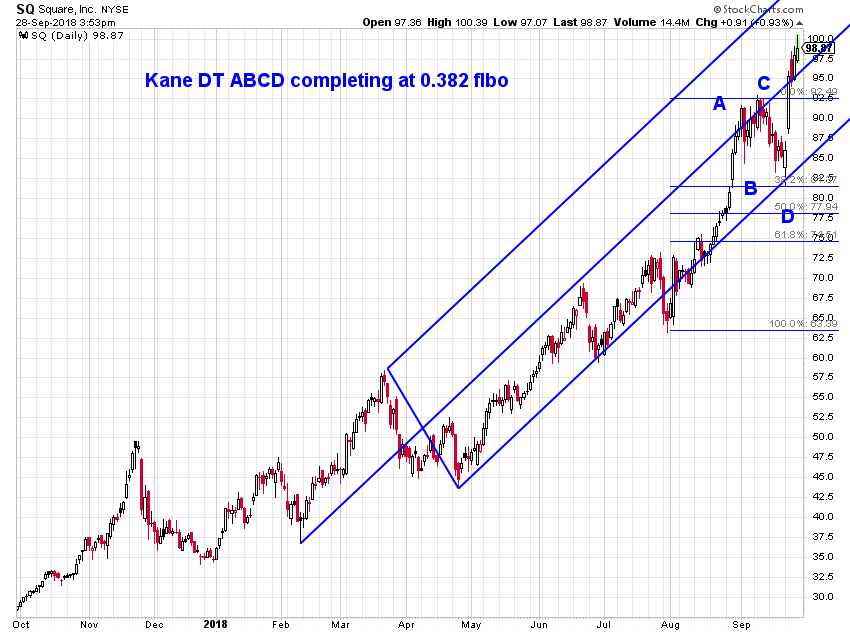
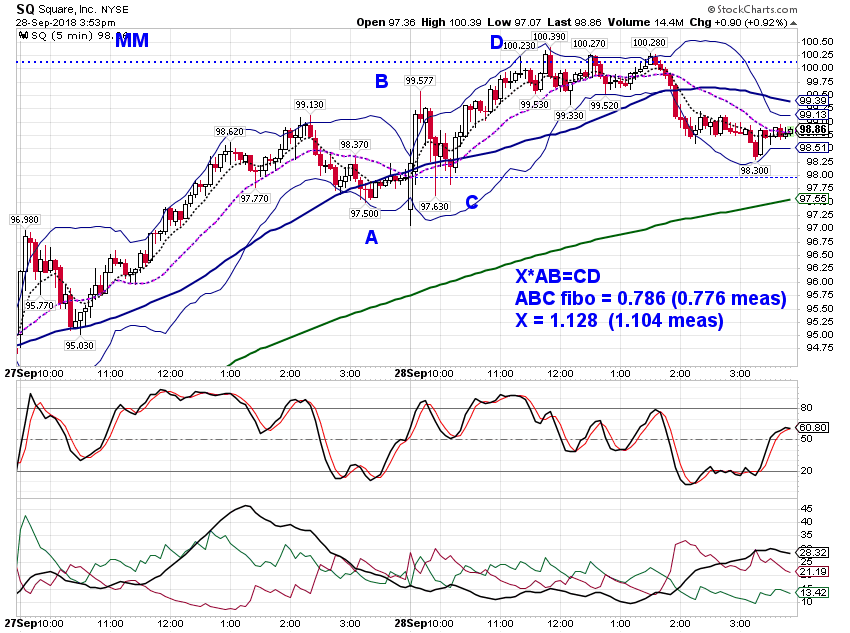
Paper trading Made a bit with a call on SQ.
Al
Al
Click image for original size
Click image for original size
AL
albert
Rep: 99
Posts: 3,094
rat,
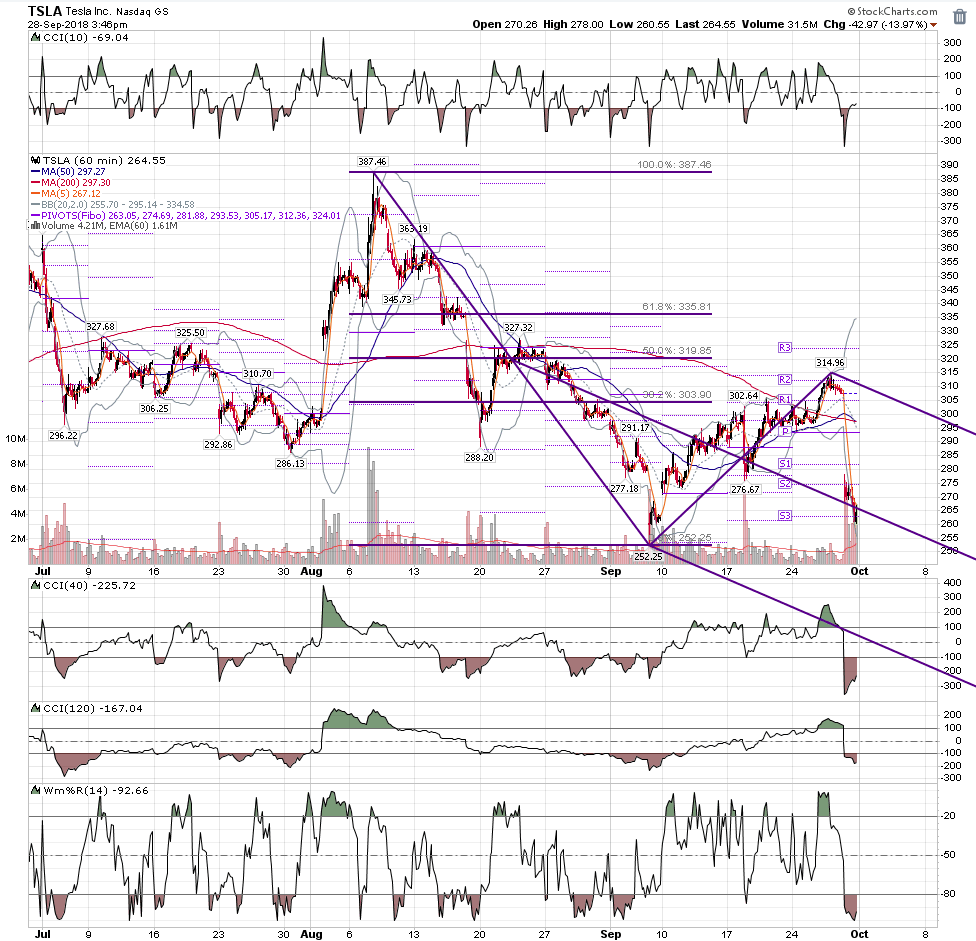
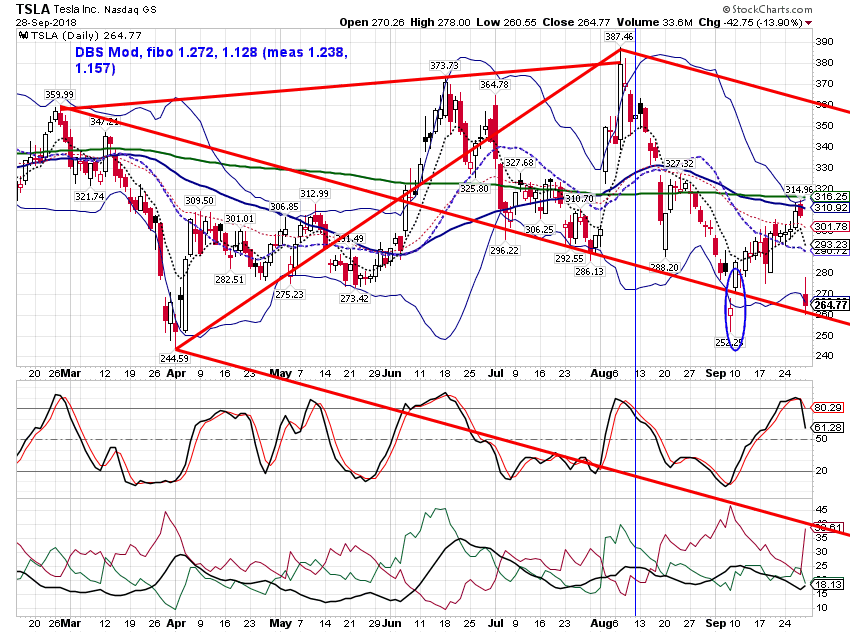
Impressive work. Simply amazing! Your chart inspired me to add a couple of TSLA charts of my own.
I really like to use Double Tops as a base to draw ML sets. I drew a ML set based on what I call a "Double Top followed by a Zig-Zag", in order to see if price reached the ML. It did, and then dropped, as you show. You nailed it! I appreciate your systematic and consistant approach.
Best,
Al
Impressive work. Simply amazing! Your chart inspired me to add a couple of TSLA charts of my own.
Originally posted by rat89
Click image for original size
Click image for original size
Click image for original size
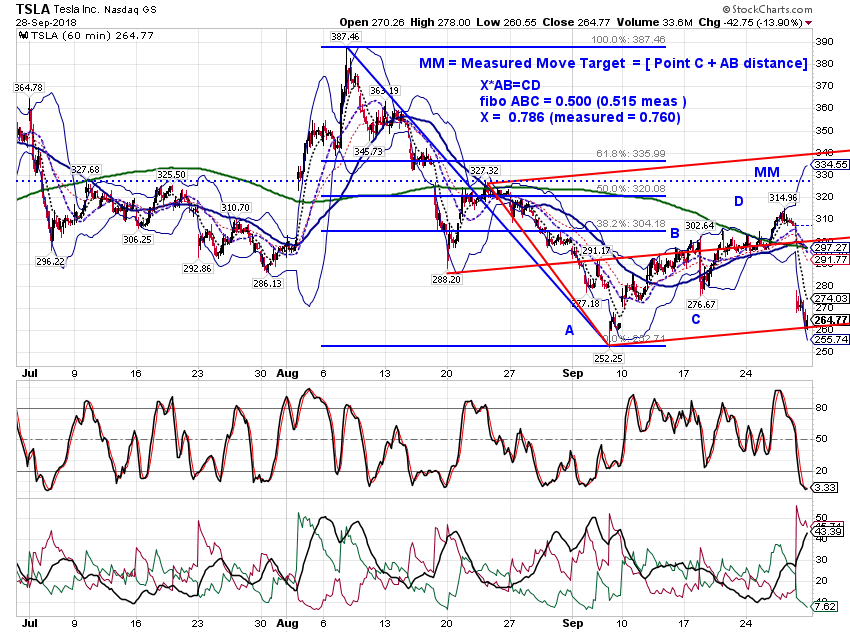
I really like to use Double Tops as a base to draw ML sets. I drew a ML set based on what I call a "Double Top followed by a Zig-Zag", in order to see if price reached the ML. It did, and then dropped, as you show. You nailed it! I appreciate your systematic and consistant approach.
Best,
Al