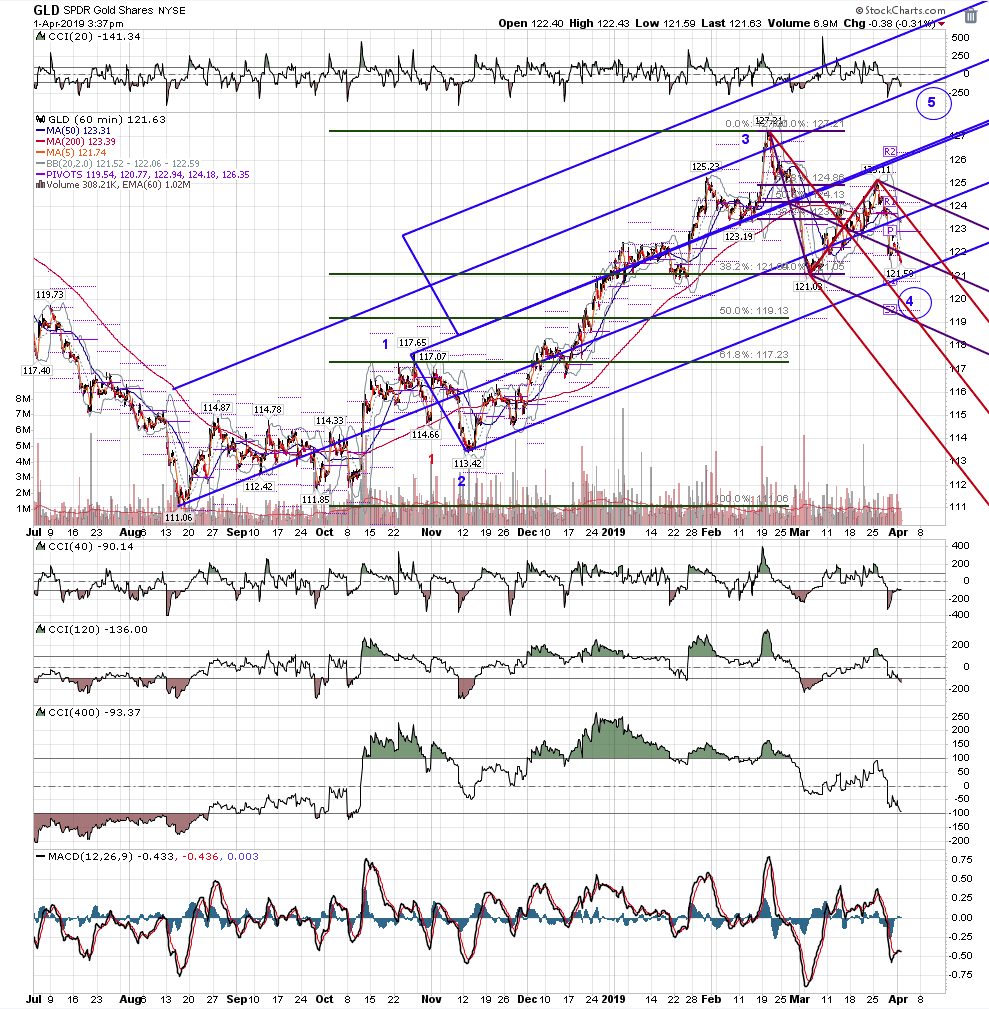
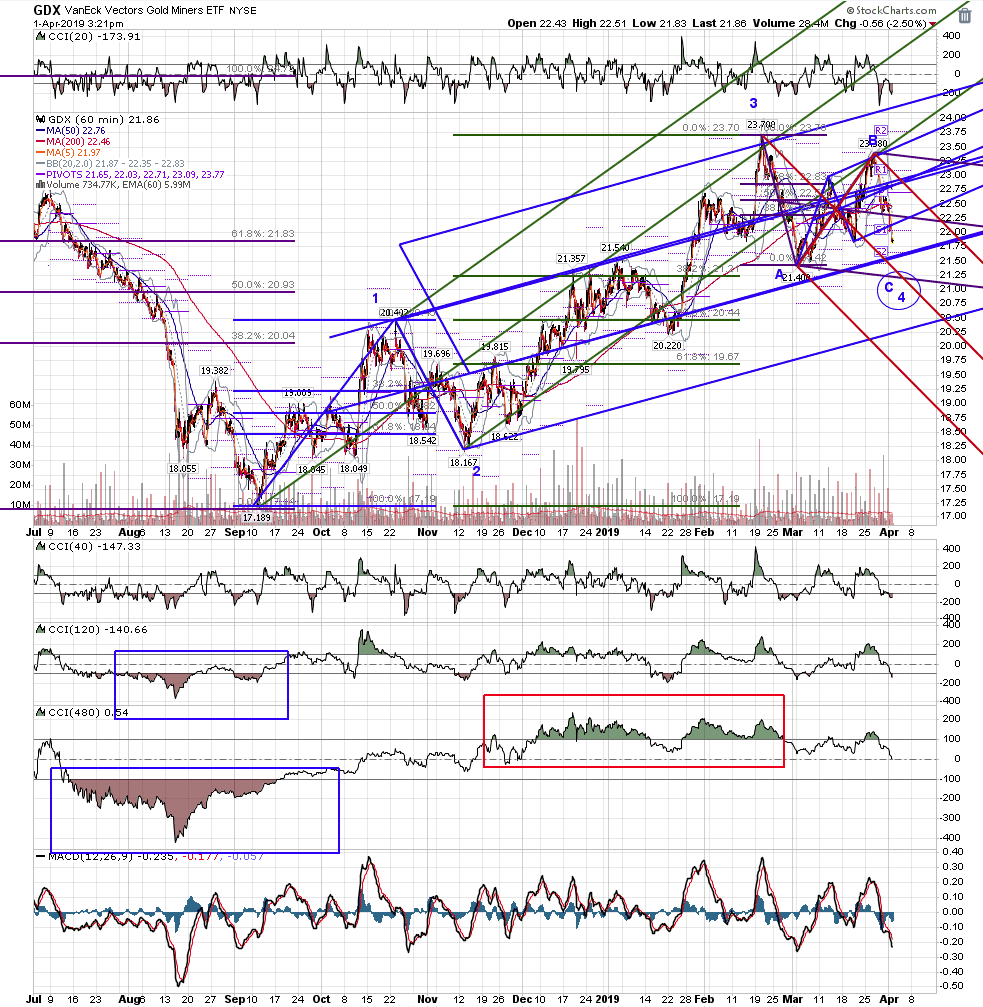
Starting it off.
Al
AL
albert
Rep: 99
Posts: 3,094
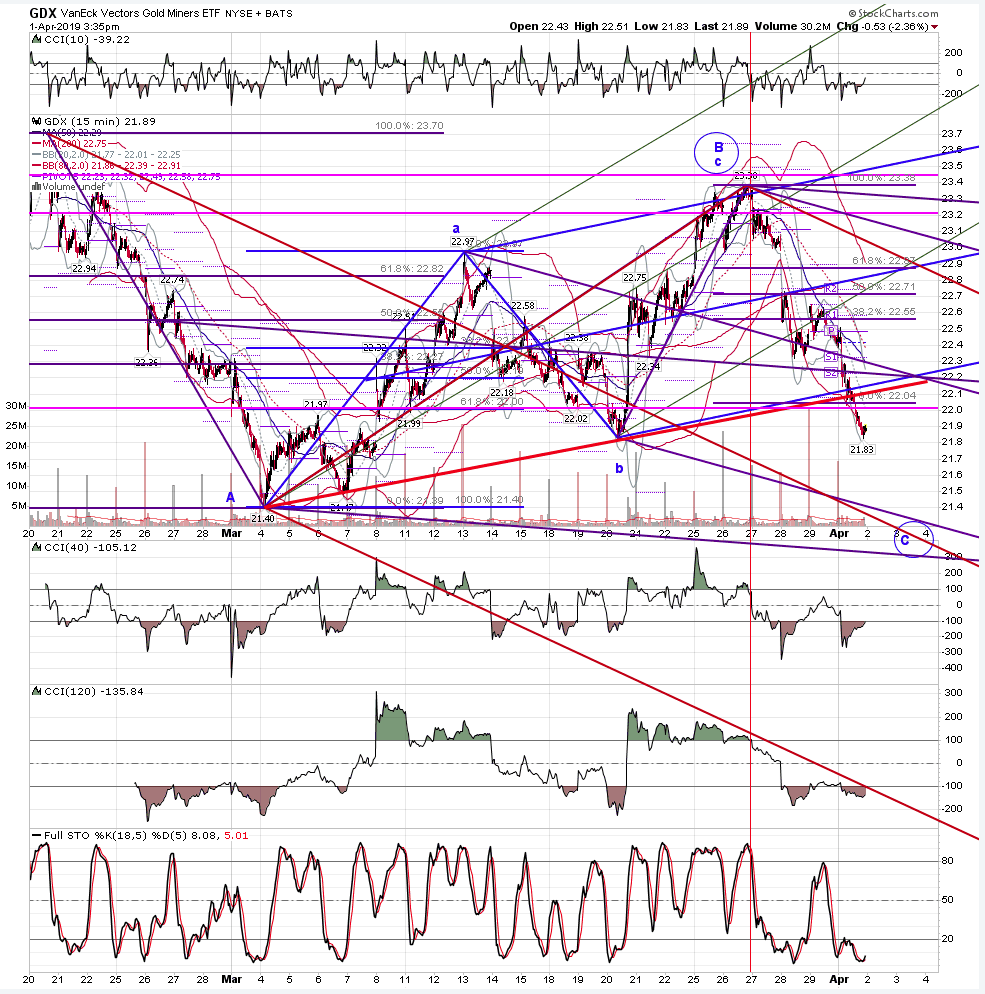
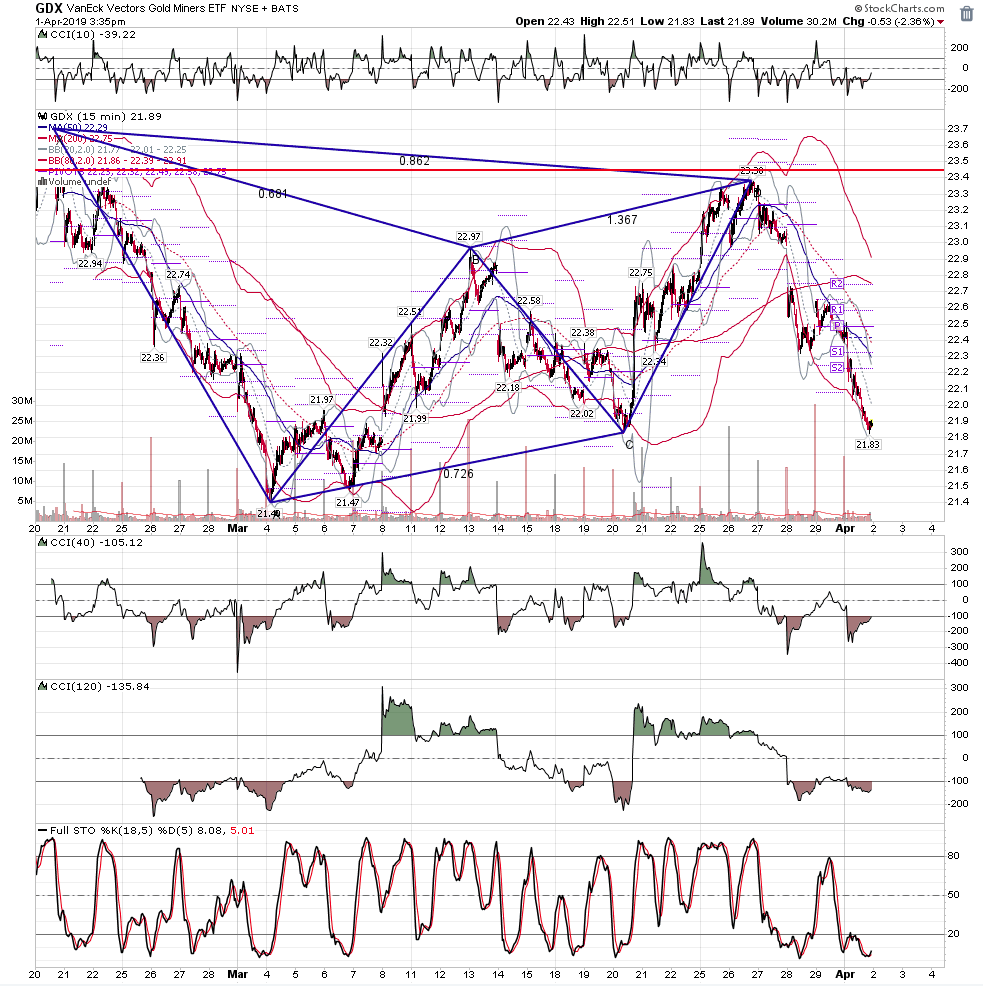
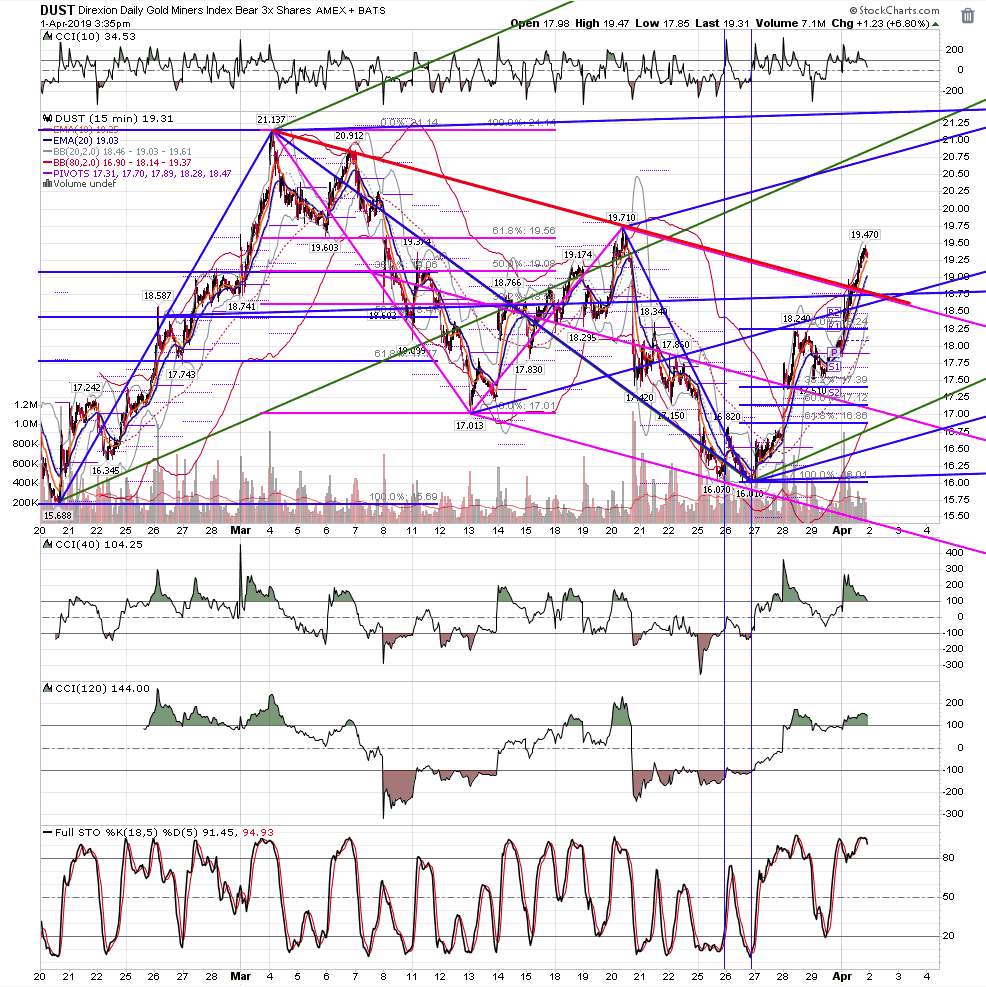
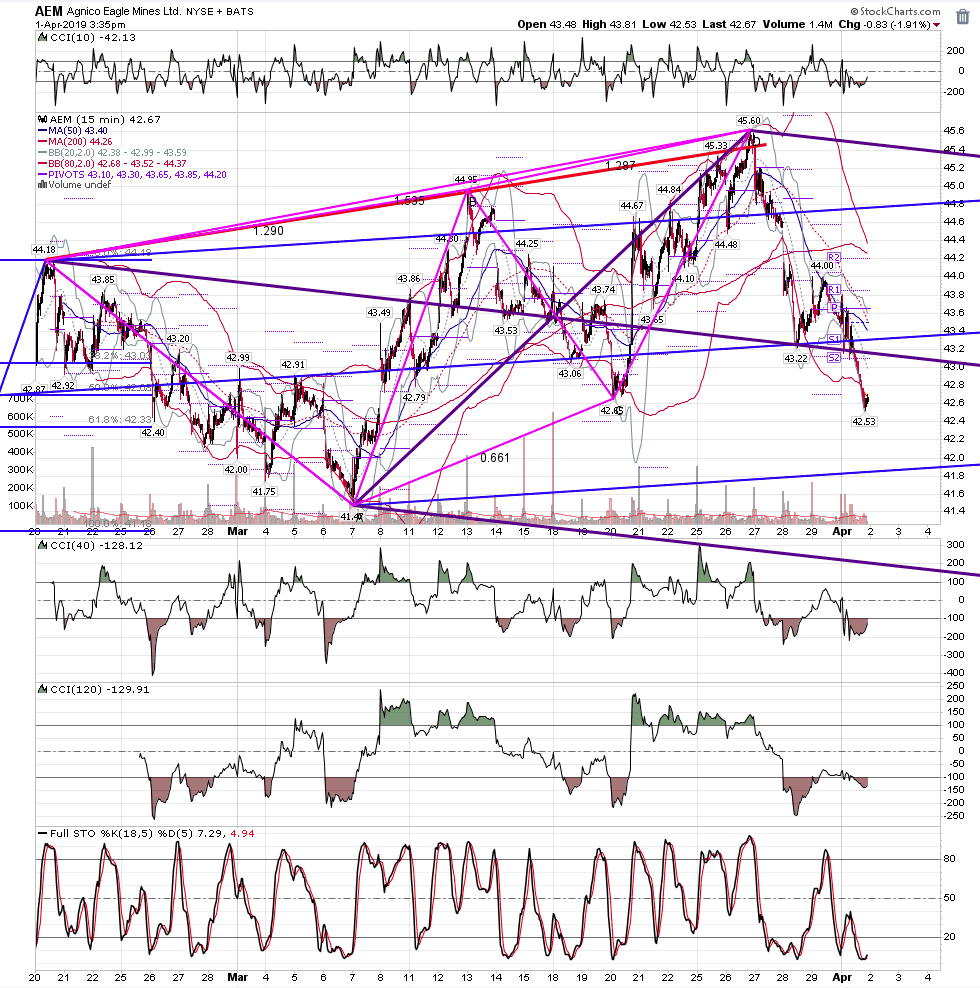
Just commenting, no trades taken in these. Looking at 0.500 fibos, Gold Crosses and price reversals at 1st or subsequent STO OS areas , and Death Crosses and price reversals at 1st or subsequent STO OB areas.
Al
Reversal area has a 50 ma contact.
1st STO OS area after a Gold Cross. This is also Point D of a Kane Double Top.
Gold Cross, price reversal at a subsequent STO OS area, not the 1st one. ADX, +DI, -DI configuration at prior STO OS areas not favorable. ML set based on 1st STO OS BEFORE the GC, hi point after the Gold Cross, and a STO OS area after the Gold Cross.
Al
Click image for original size
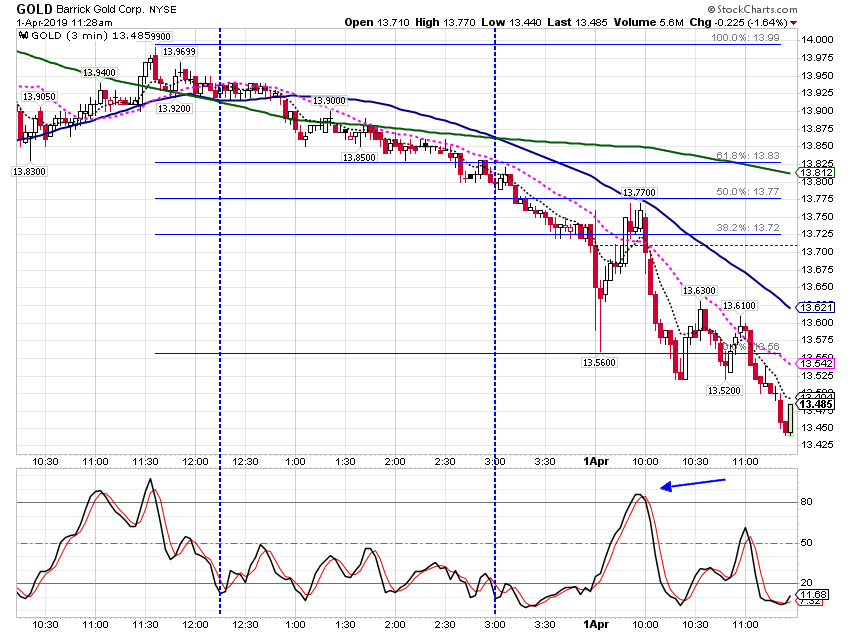
Reversal area has a 50 ma contact.
Click image for original size
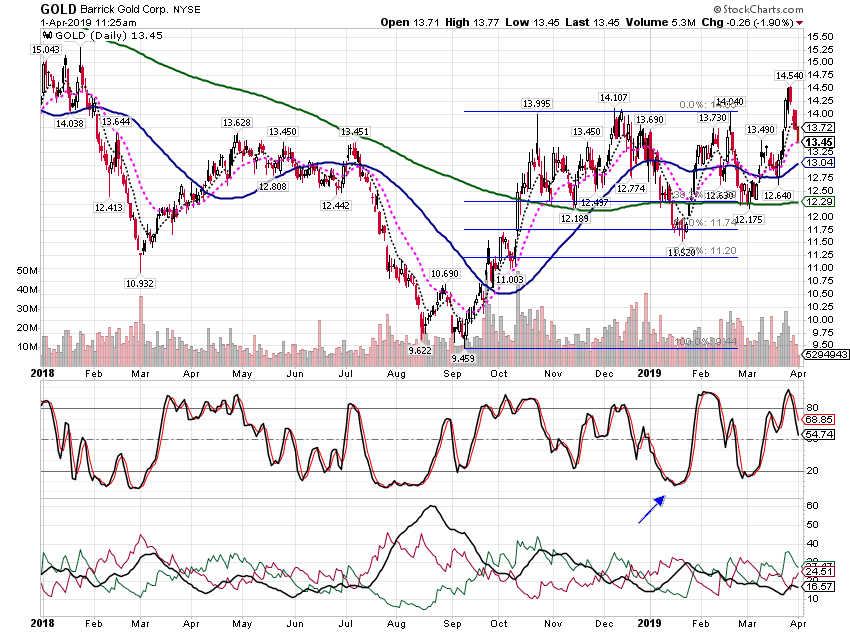
1st STO OS area after a Gold Cross. This is also Point D of a Kane Double Top.
Click image for original size
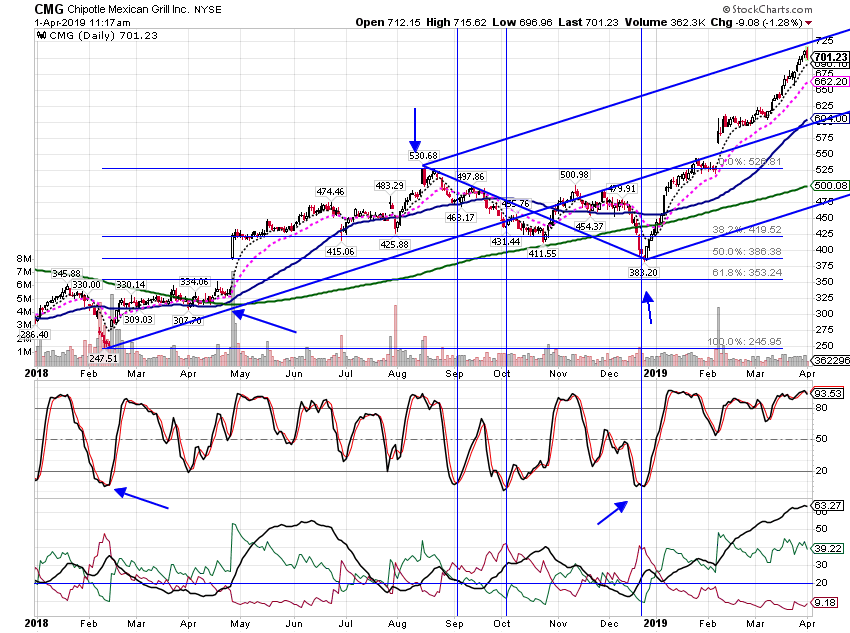
Gold Cross, price reversal at a subsequent STO OS area, not the 1st one. ADX, +DI, -DI configuration at prior STO OS areas not favorable. ML set based on 1st STO OS BEFORE the GC, hi point after the Gold Cross, and a STO OS area after the Gold Cross.
DU
Duane
Rep: 100
Posts: 1,095
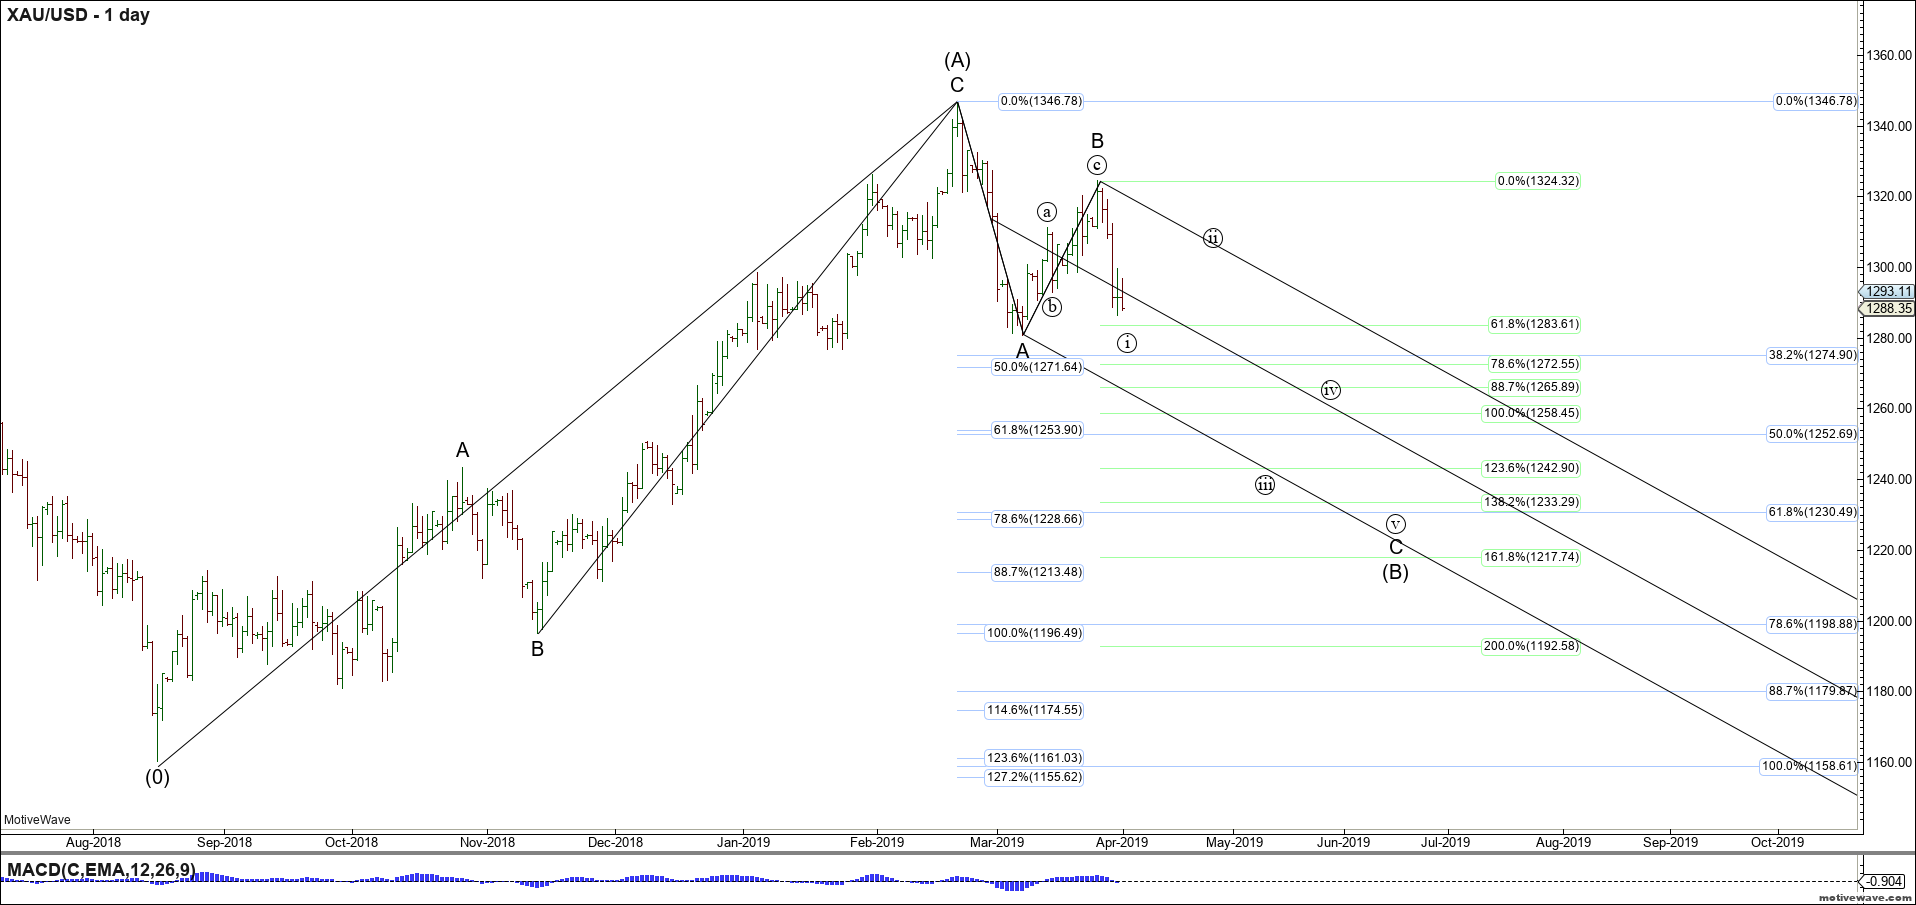
Great work Al ! Charts are really great . This is precisely what I look for in a set up. The STO is still lagging, but can indicate where a price could reverse, and in what direction momentum is going, add fibs and forks and you have a set up. Helps me most when trying to enter in a lower time frame trade of a higher time frame swing. Your Gold chart is a perfect example ! Nice work.
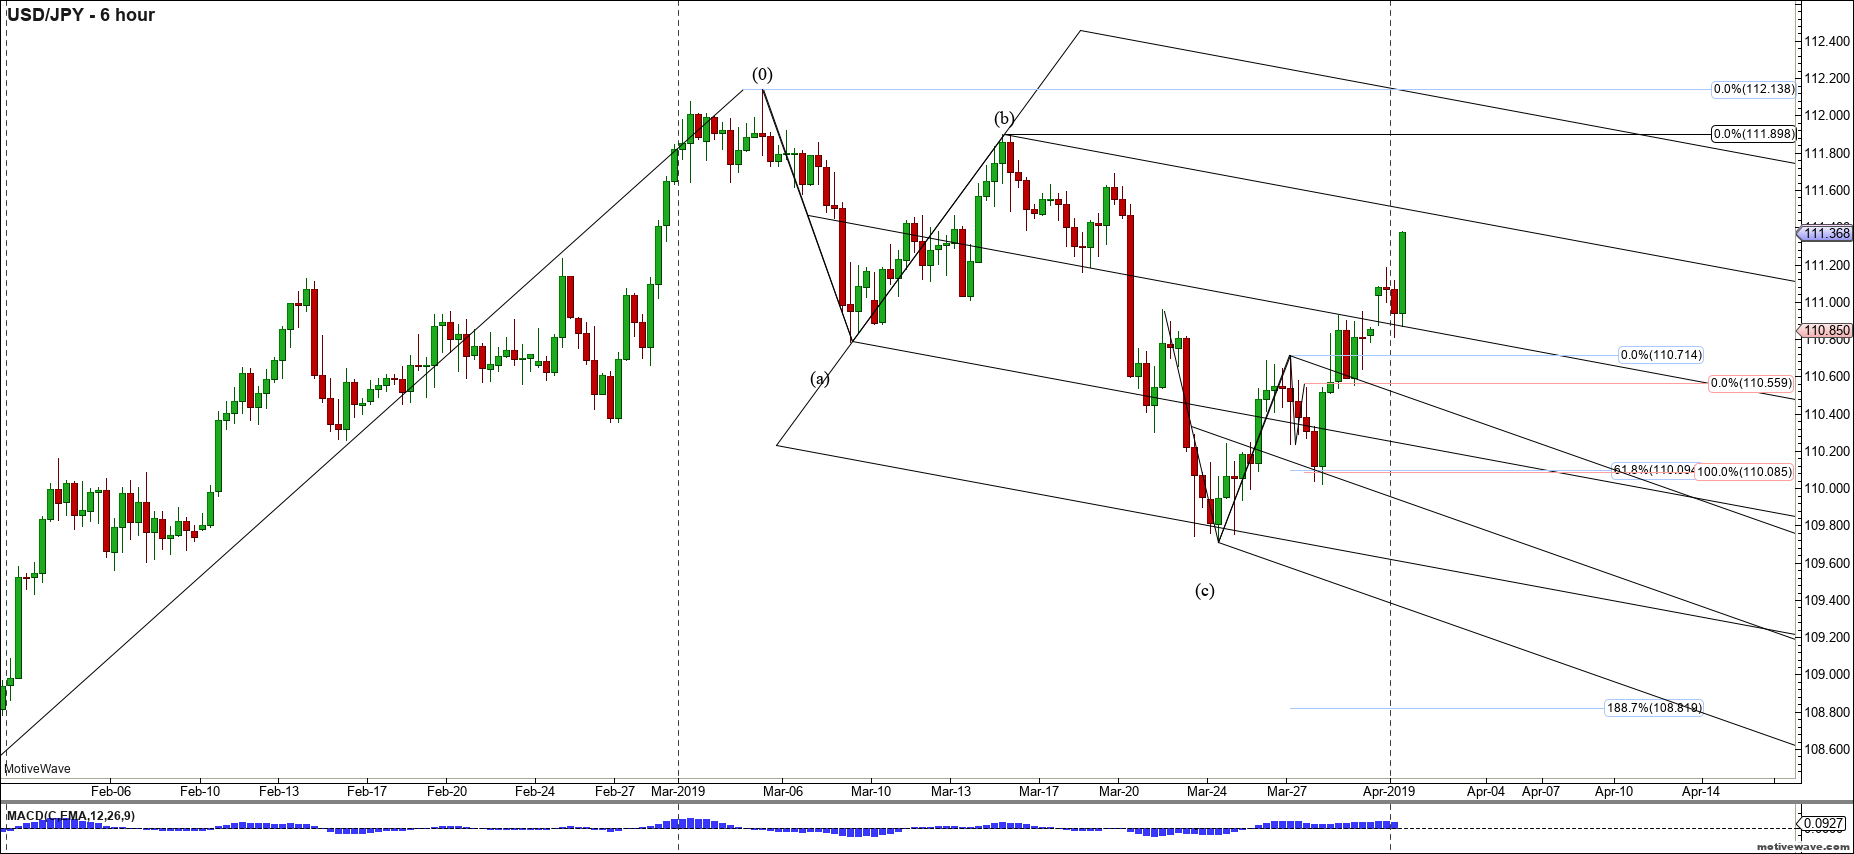
Here is the yen trade. Progressing nicely. The lines caught two lows of this move so far, and the lines and pattern also give an indication of where price may go.
Here is the yen trade. Progressing nicely. The lines caught two lows of this move so far, and the lines and pattern also give an indication of where price may go.
Click image for original size
AL
albert
Rep: 99
Posts: 3,094
Thanks Duane. I really like your charts. They are so clean, and say a lot.
Al :--)
Al :--)
DU
Duane
Rep: 100
Posts: 1,095
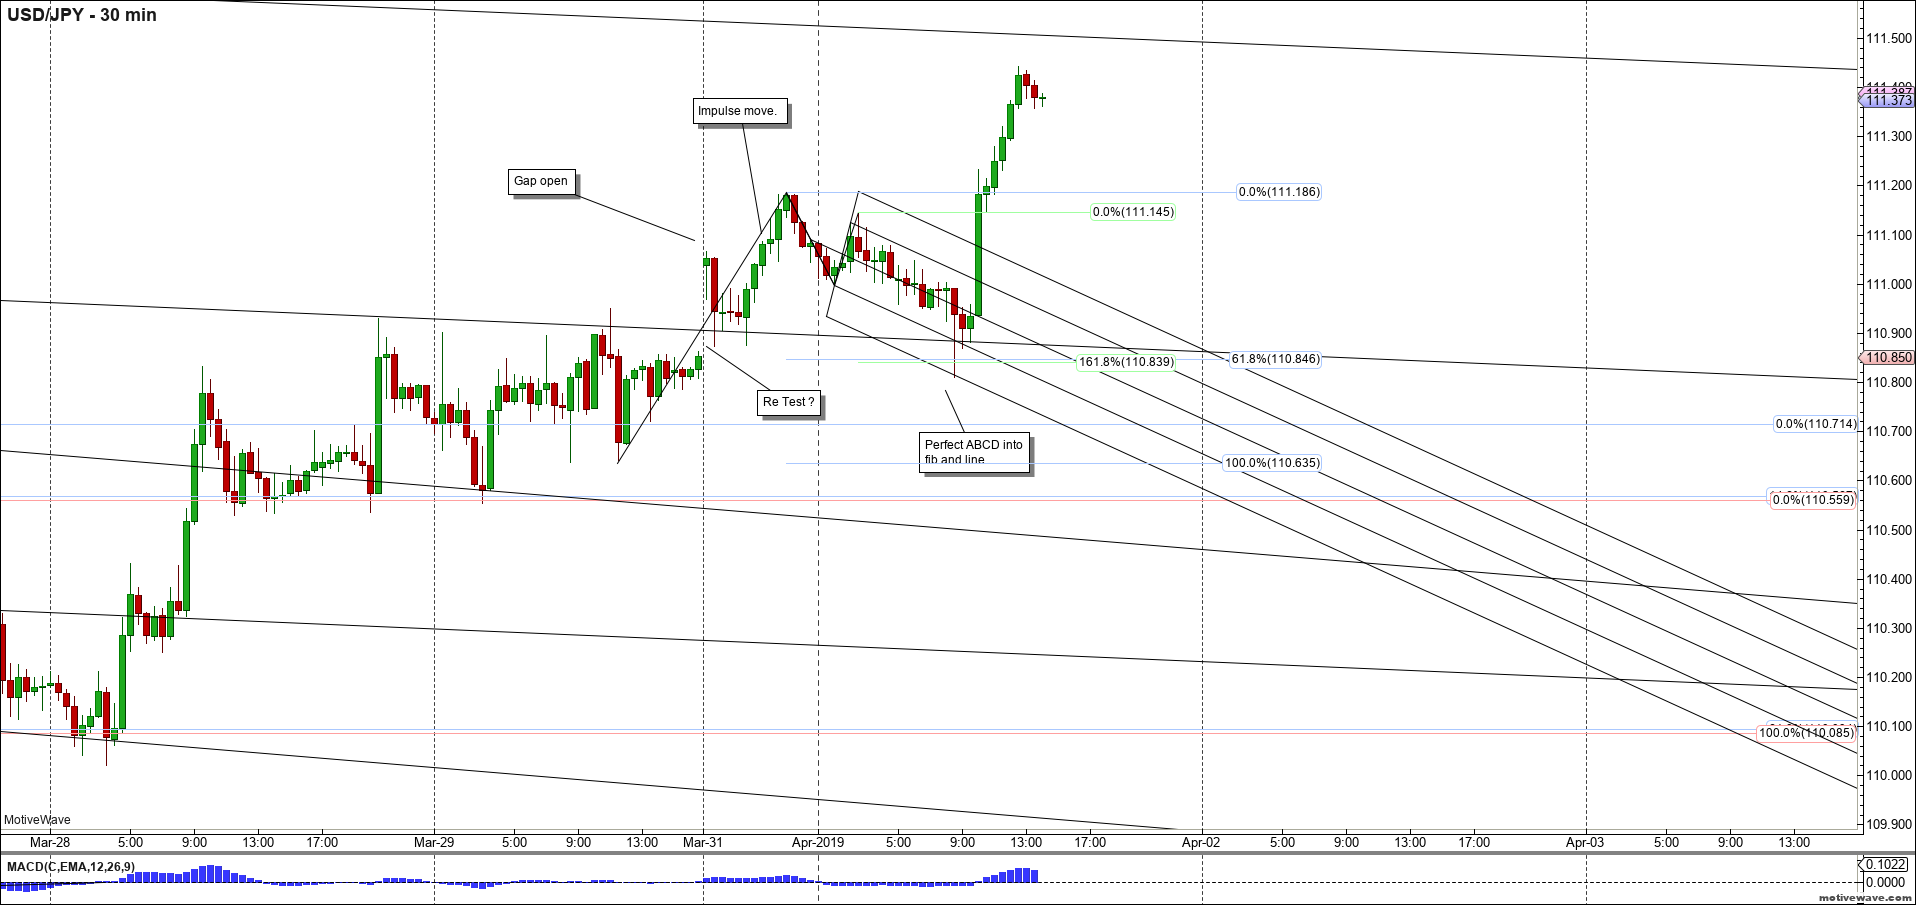
Thanks Al , Look at today's trade, Gapped over my line, retest twice with fibs and more lines. We Know where it should go on the 30 and the 4H .
Click image for original size
RA
rat89
Rep: 0
Posts: 7,015
could be.....I have my eye on uup 26.21 area, gld 121, or 120, and gdx 21.15
Originally posted by Duane
Hey Rat what do you think?
Click image for original size