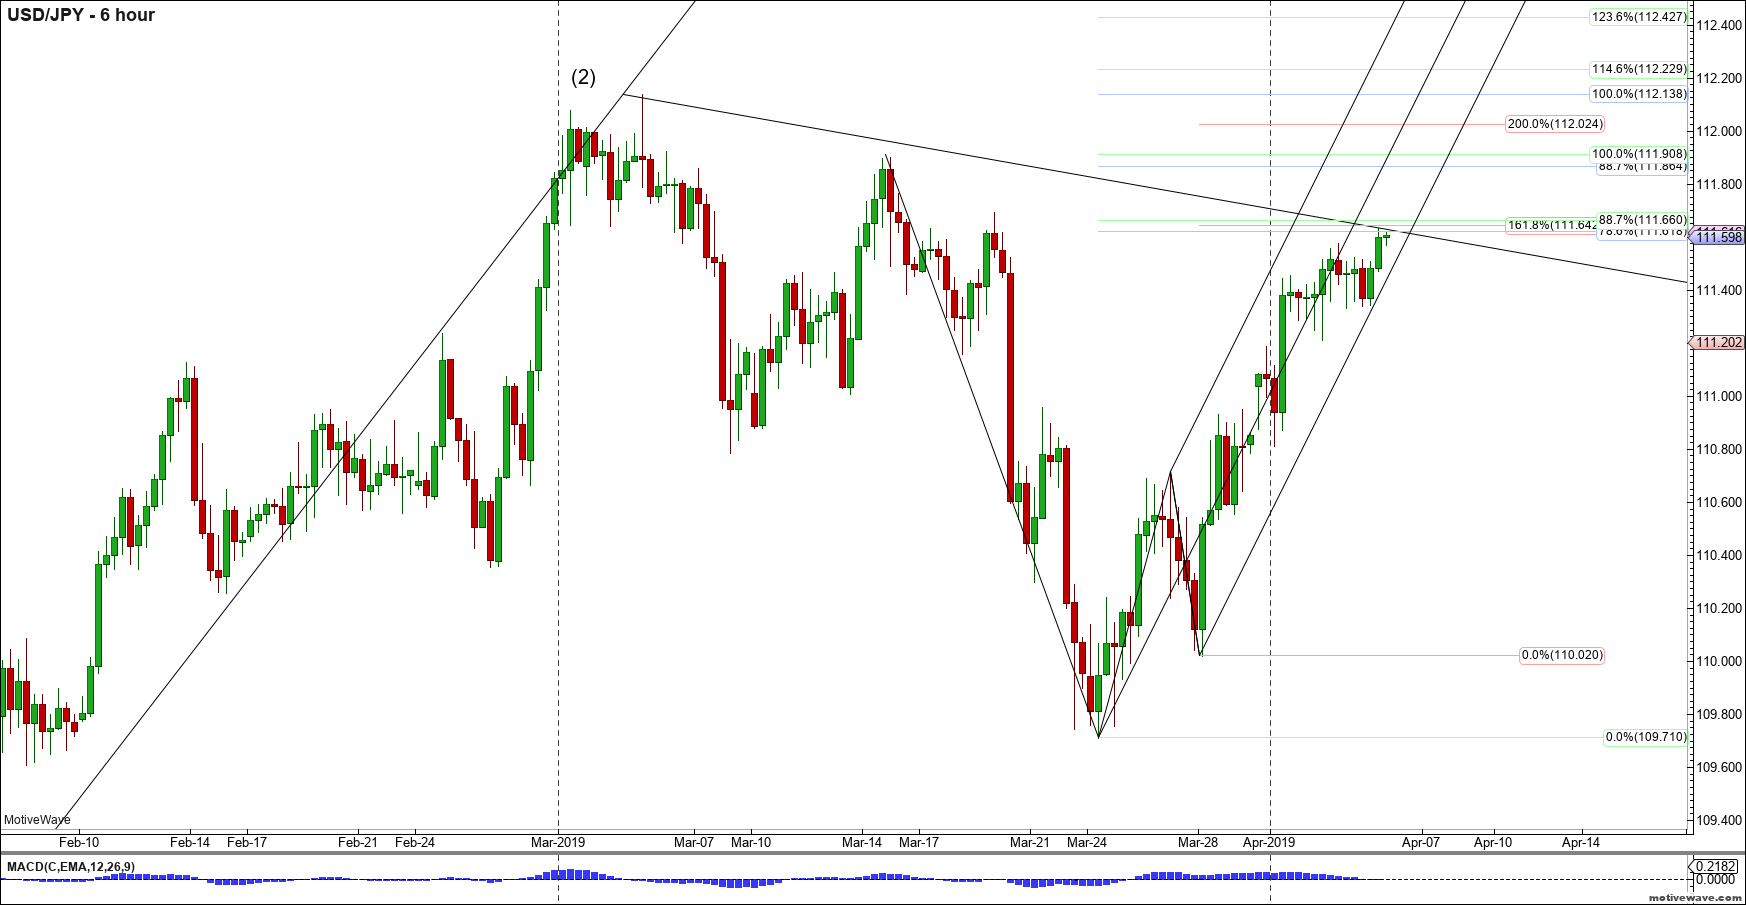
Starting it off.
Al
AL
albert
Rep: 99
Posts: 3,094
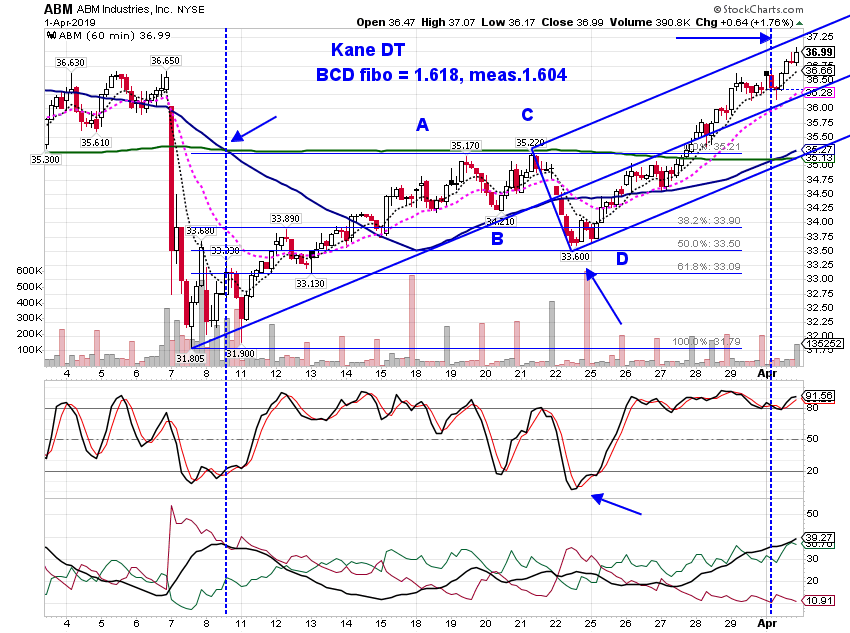
Here is another Kane DT. Did not thade this. Just looking.
Al
Al
Click image for original size
RA
rat89
Rep: 0
Posts: 7,015
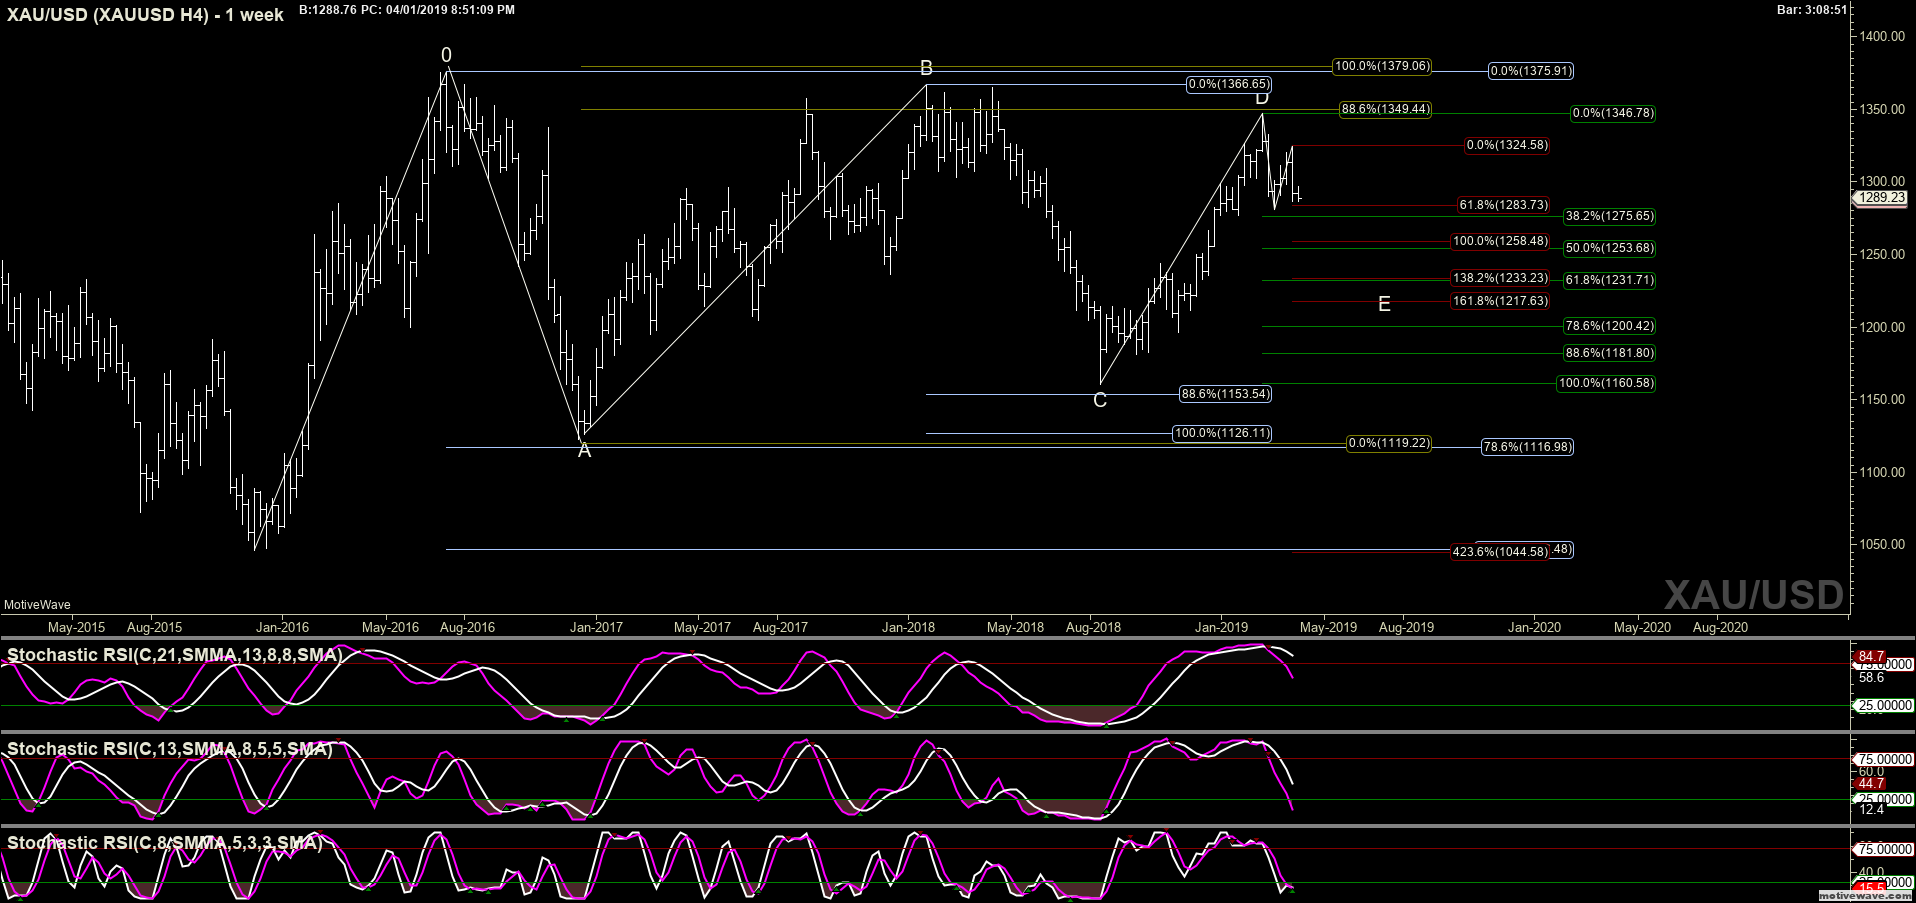
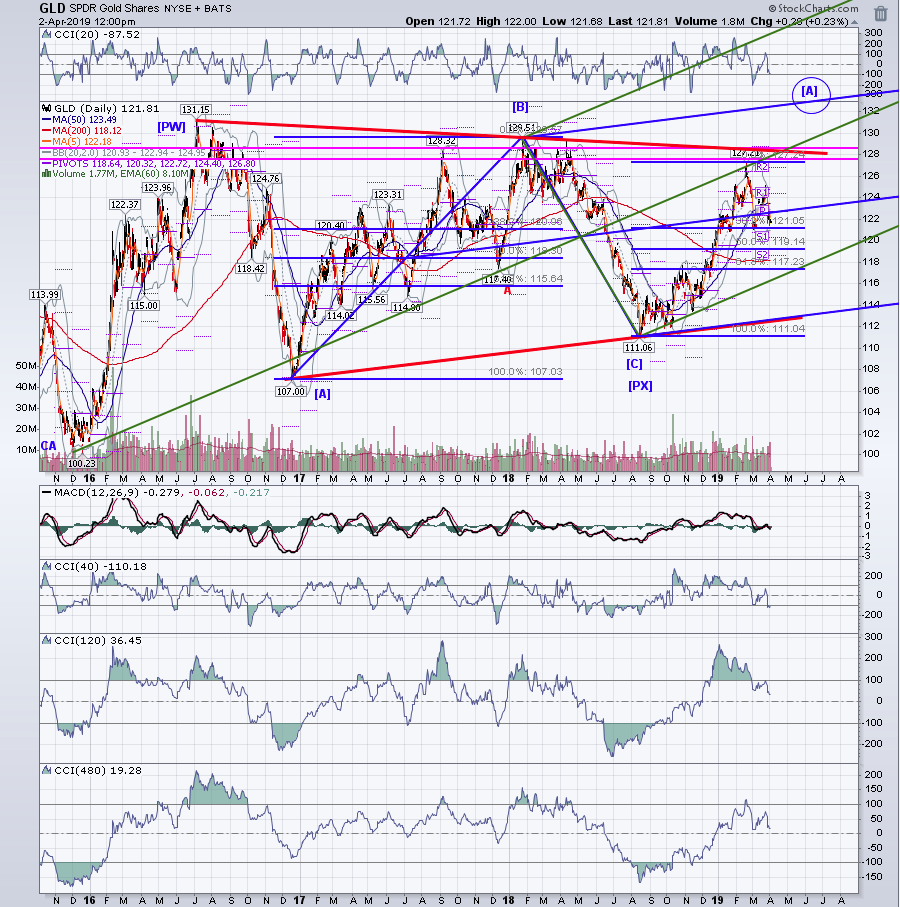
gld daily - a drop down to 121 - 120 could set off a rocket launch
Click image for original size
RA
rat89
Rep: 0
Posts: 7,015
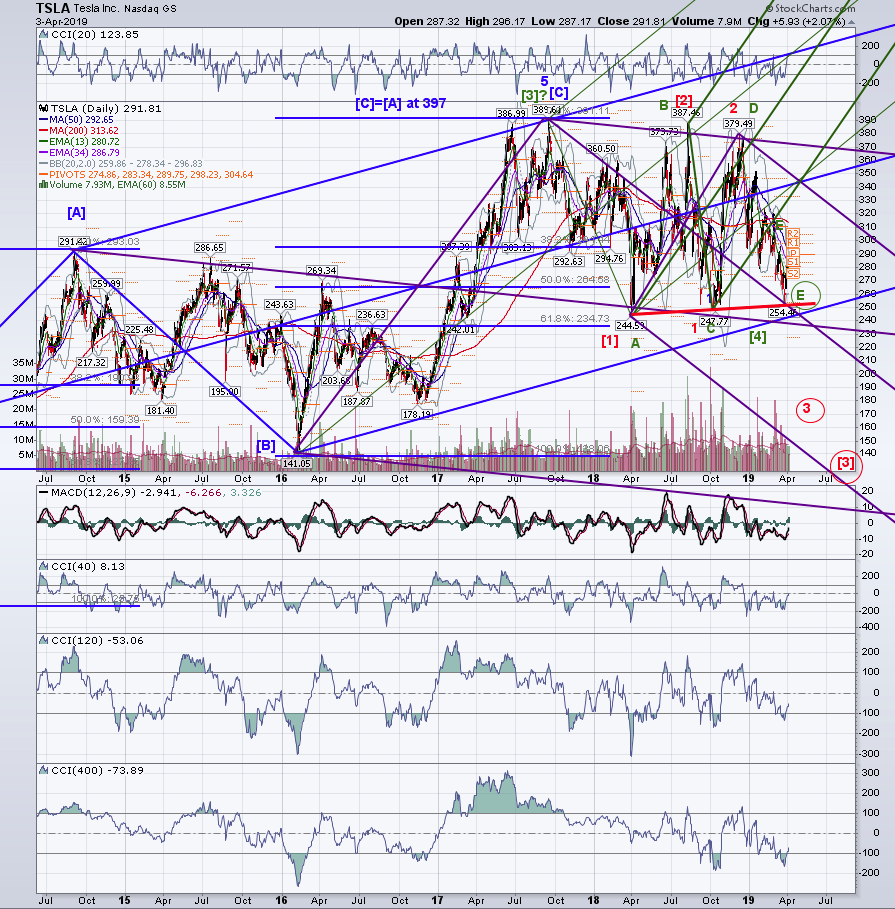
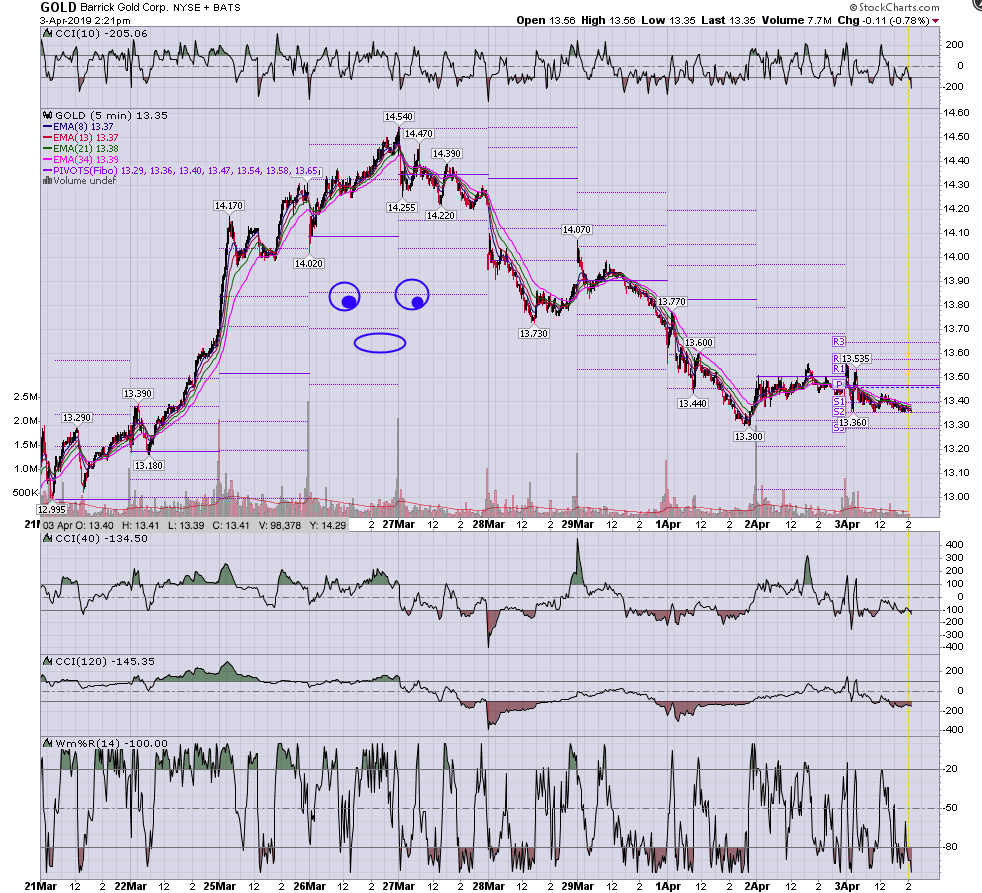
tsla - there are two distinct possible counts, and they couldn't be more different.....in the blue count, wave [C] completed in september 2017 and tsla has been in a bear cycle move since, with the red count. wave [1] red ended in early 2018, wave [2] red ended in mid 2018, and wave [3] red is in progress now, where 1 tested the prior low, 2 tested the prior high, and 3 will give a break of the median line area on its way to [3]. the alternate (bullish) count is shown in green. Wave [3] ended in september 2017, and EVERYTHING since then, has been a wave [4] triangle. Elliot wave triangles are ABCDE, where the longest leg has to be either A or B. In either case, price hit the median line at the recent low, at the red trend line, so it was due for a bounce. If it fails and slices through that tangle of median lines it's going a lot lower. If the green count prevails, it's on its way up to make a marginal new high.
Click image for original size
AL
albert
Rep: 99
Posts: 3,094
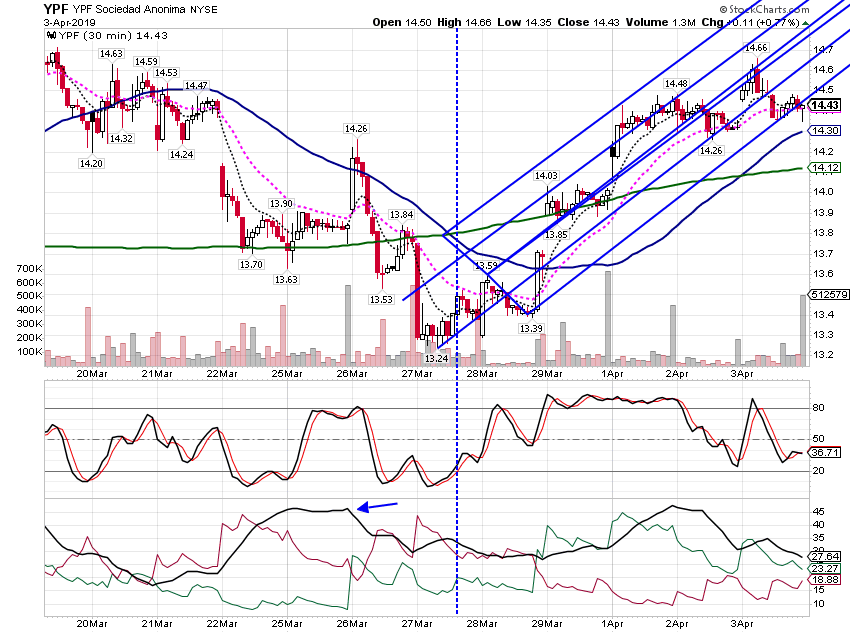
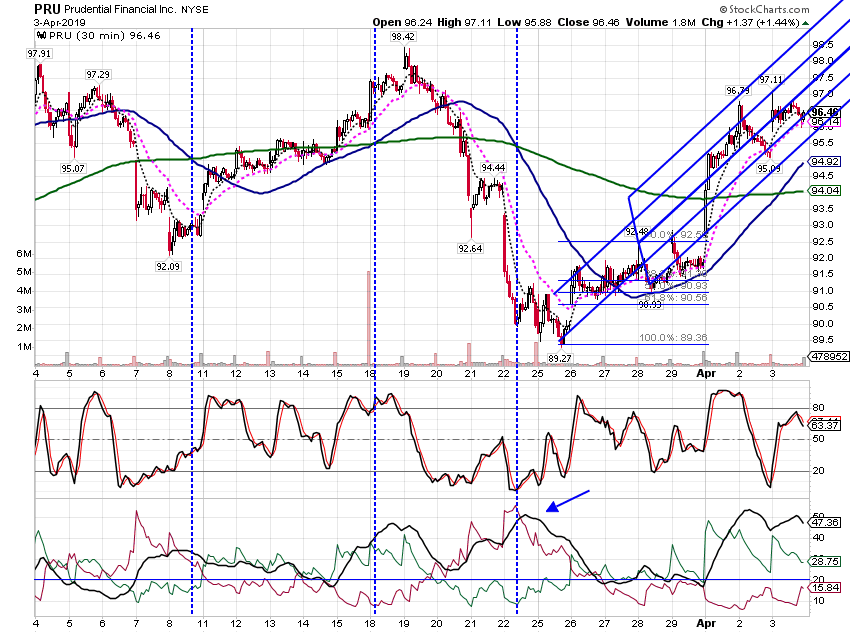
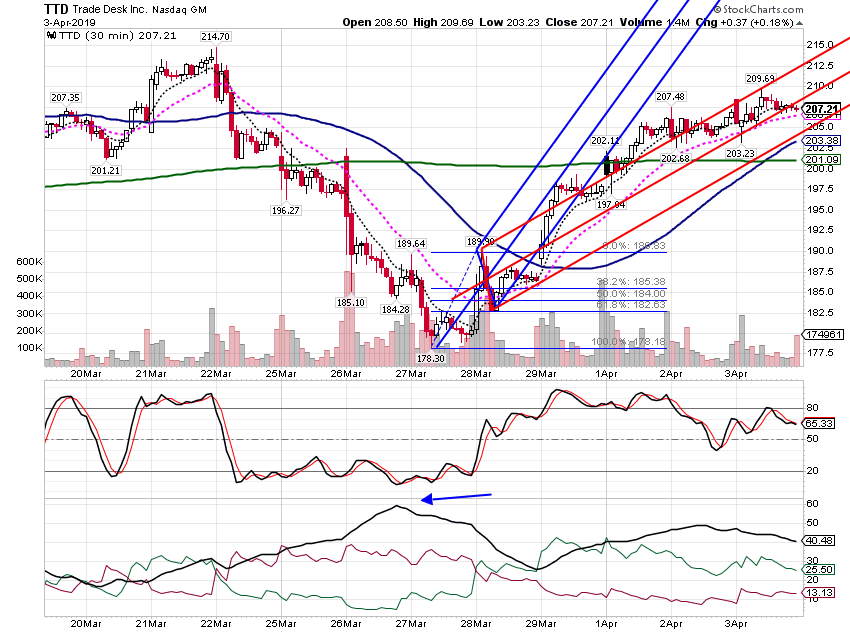
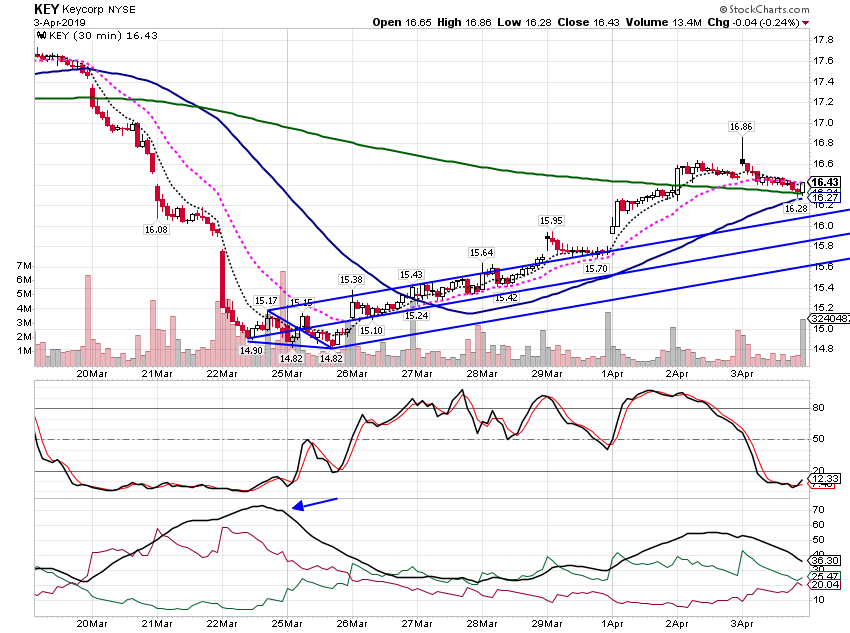
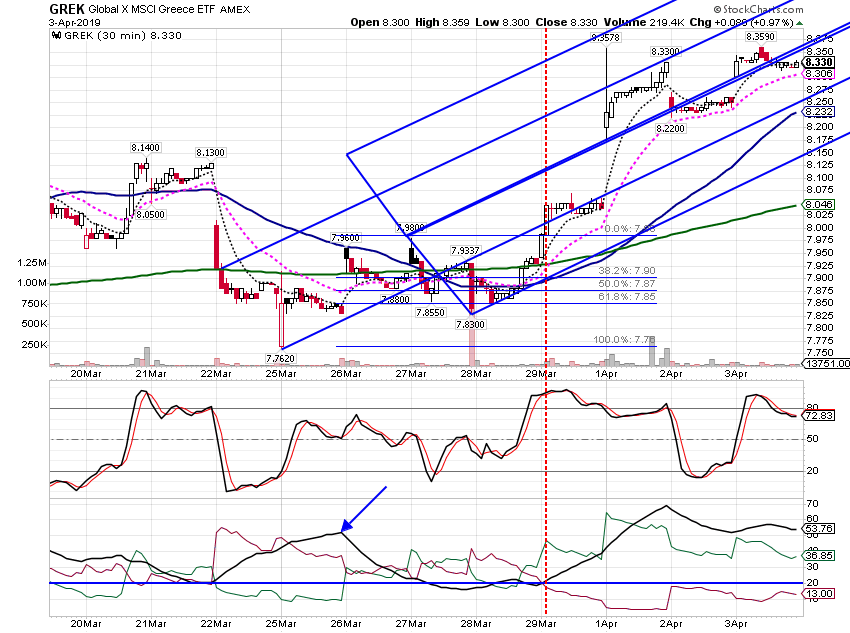
Paper trading. Looking at April seasonally-favored stocks. I believe there charts show stocks, that in the past few years, 100% of the time, have increased in price from the first of the month to the end of the month, per StockCharts. Looked at bottoming behavior, tried to note change in trend, as shown by high ADX peaks. Sorry about the line work, that is the best I can do today.
Al :--)
Al :--)
Click image for original size
Click image for original size
Click image for original size
Click image for original size
Click image for original size