Starting it off.
Al
AL
albert
Rep: 99
Posts: 3,094
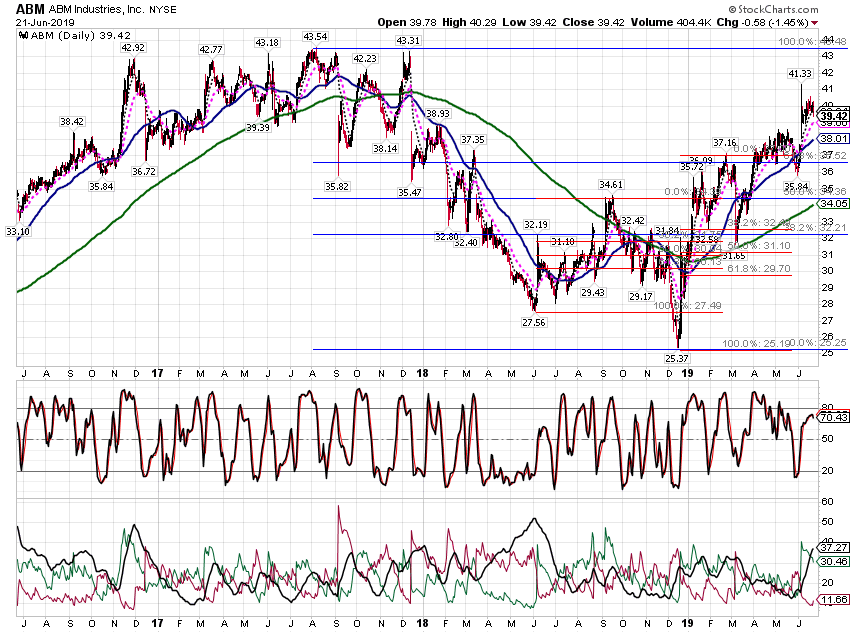
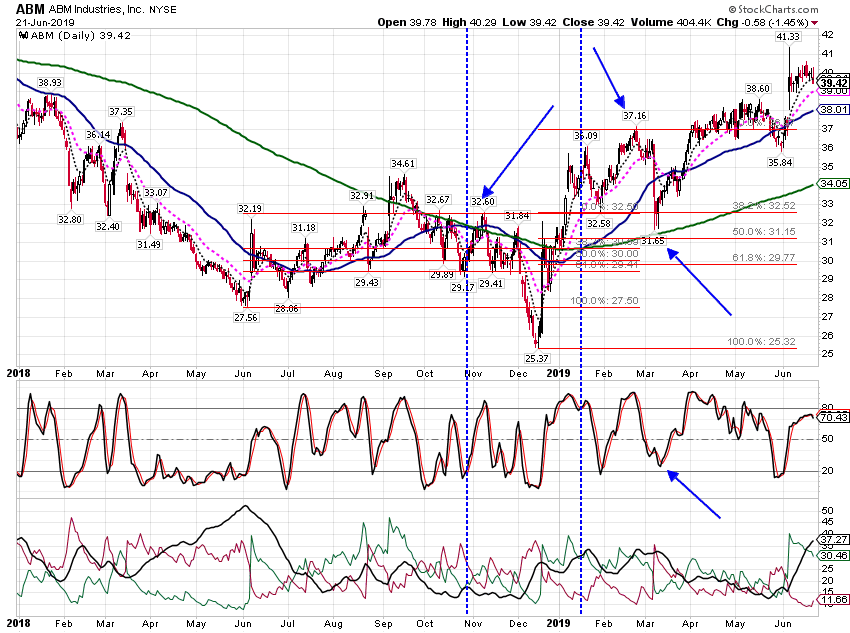
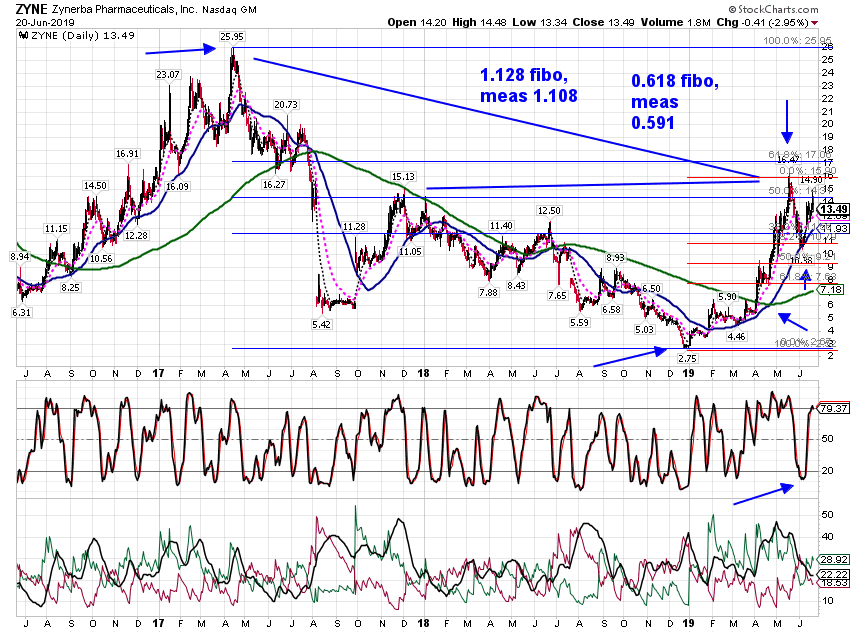
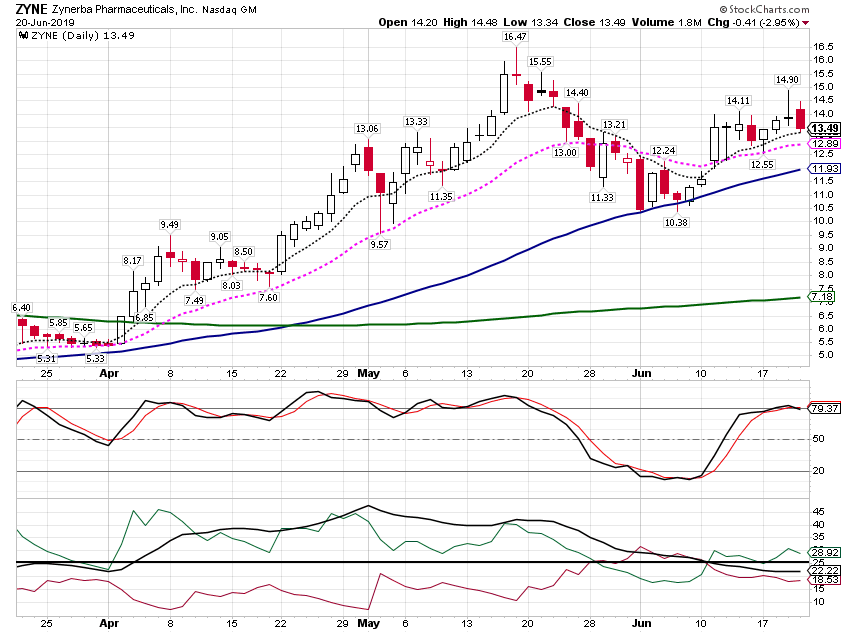
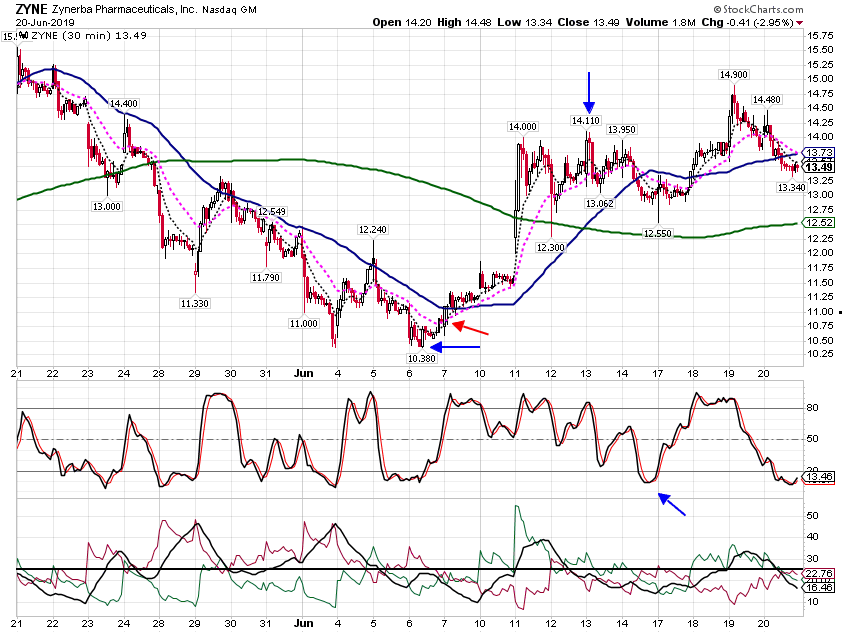
No trades here, just chatting. Here is an example of a stock whose price dropped after a Gold Cross. The second Gold Cross on these charts could have worked well, however.
Back to the drawing board.
All to the best to you real traders.
Al :--|
Back to the drawing board.
All to the best to you real traders.
Al :--|
Click image for original size
Click image for original size
Originally posted by albert
One more time, please. The conclusions I came to are based on only a few charts. I looked through a file of past charts with Gold Crosses, and found that the situation is more complex that I thought. No surprise. Sometimes price makes a Gold Cross, than heads down. I will try to come up with a better discussion of the setup. More later.
Al :--|
Originally posted by albert
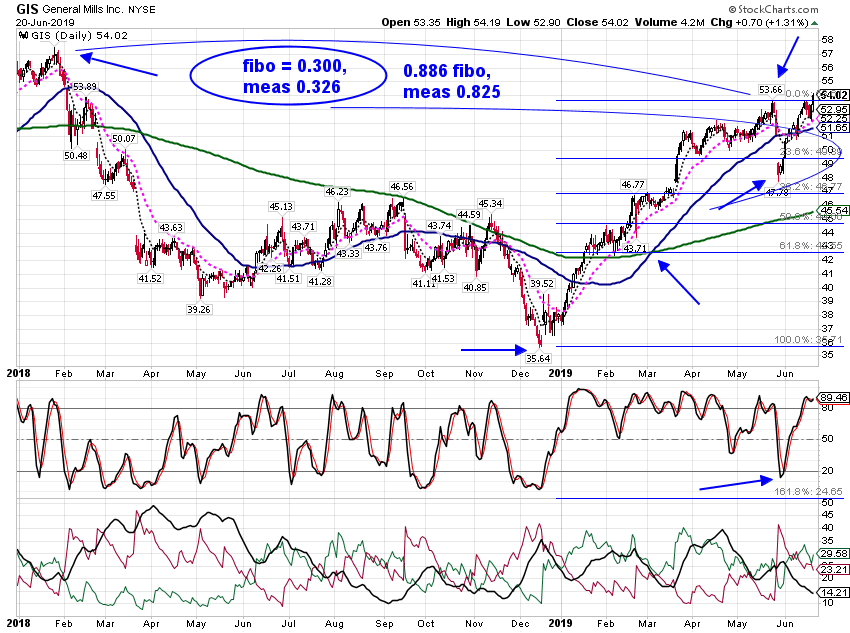
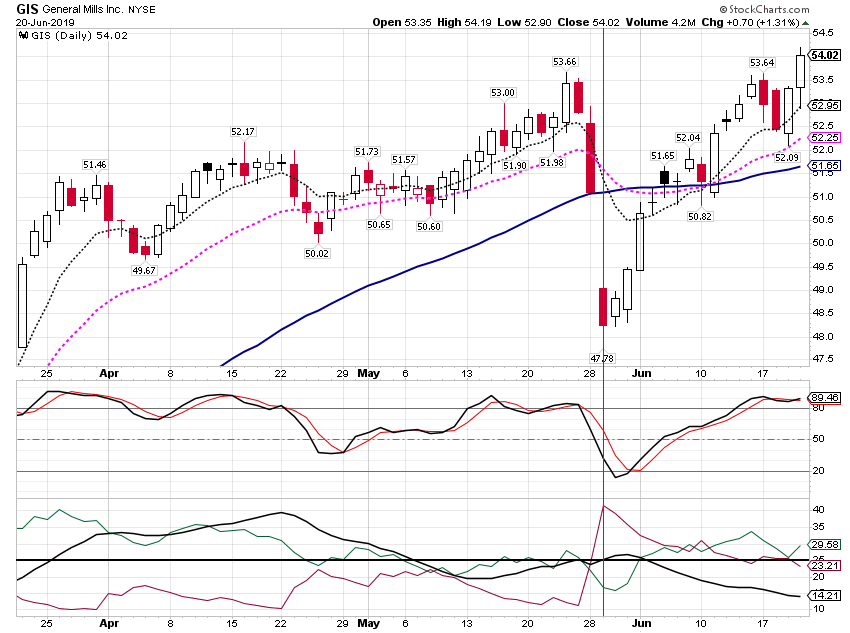
Oops again. Paper trading. I did not have any options on ZYNE, just some stock. I do have some call options on GIS in my paper trading account.
My apologies again
Al :--))
Originally posted by albert
Oops. Zyne was more like a 40 percent rise.
My apologies.
Al :--)
Originally posted by albert
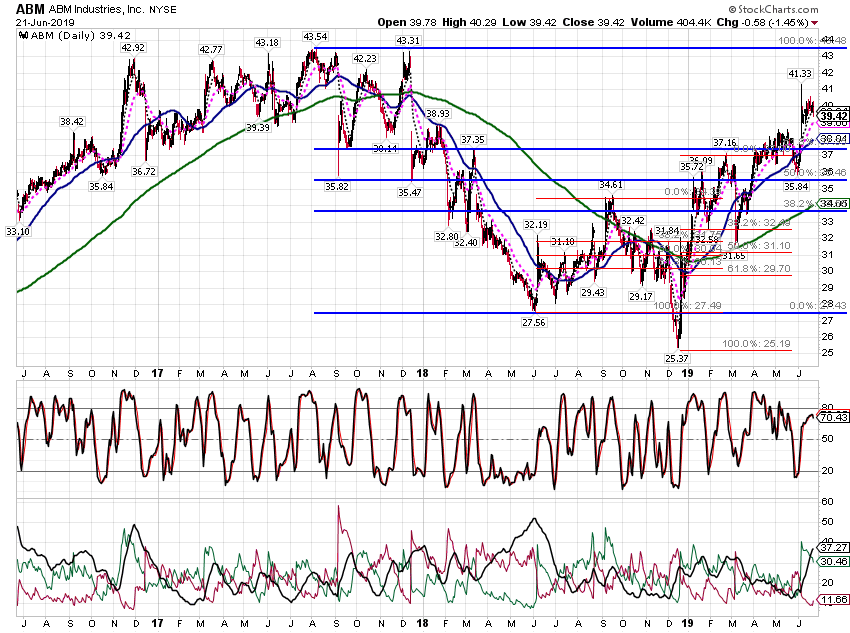
Just looking at my daily paper trading results. Two of my active winning long term option trades, GIS and ZYNE, have similar five features: 1.) A top, 2.) A Bottom, 3.) A Gold Cross, 4.) A fibo retrace to a significant fibo, such as 0.886 or 0.618, and 5.) a subsequent fibo retrace to the 0.300 - 0.382 area with STO OS, followed by a roughly 10% gain.
Al :--)
Click image for original size
Click image for original size
Click image for original size
Click image for original size
Click image for original size
AL
albert
Rep: 99
Posts: 3,094
OOPS. I just moved the fibo anchor from the 2nd bottom to the 1st bottom on one of the charts. That should fix it.
Al
Al
Click image for original size
DU
Duane
Rep: 100
Posts: 1,095
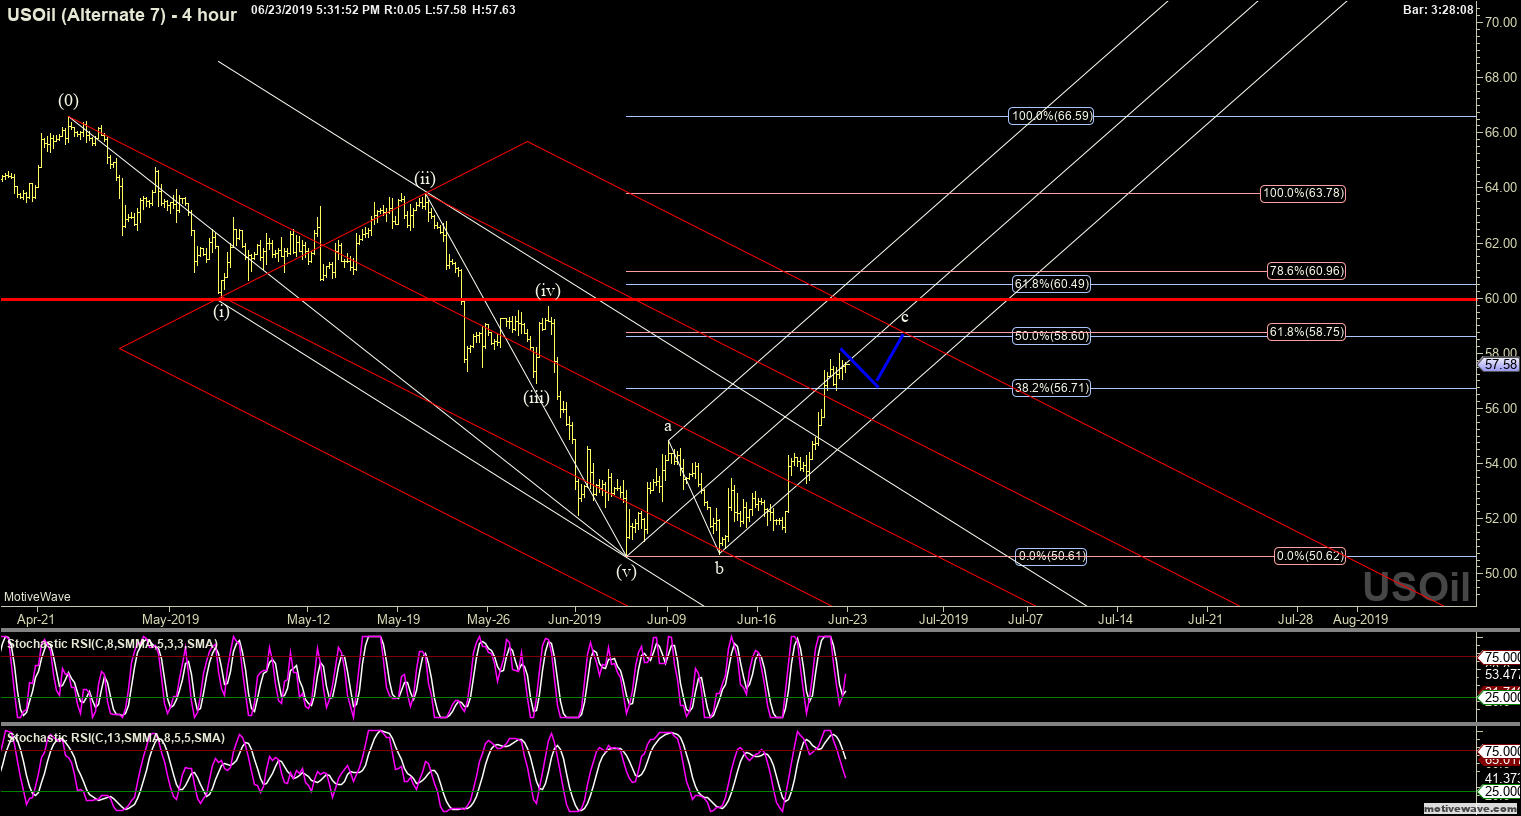
Full on Bull now, which reversal is iminent!!
Click image for original size
AL
albert
Rep: 99
Posts: 3,094
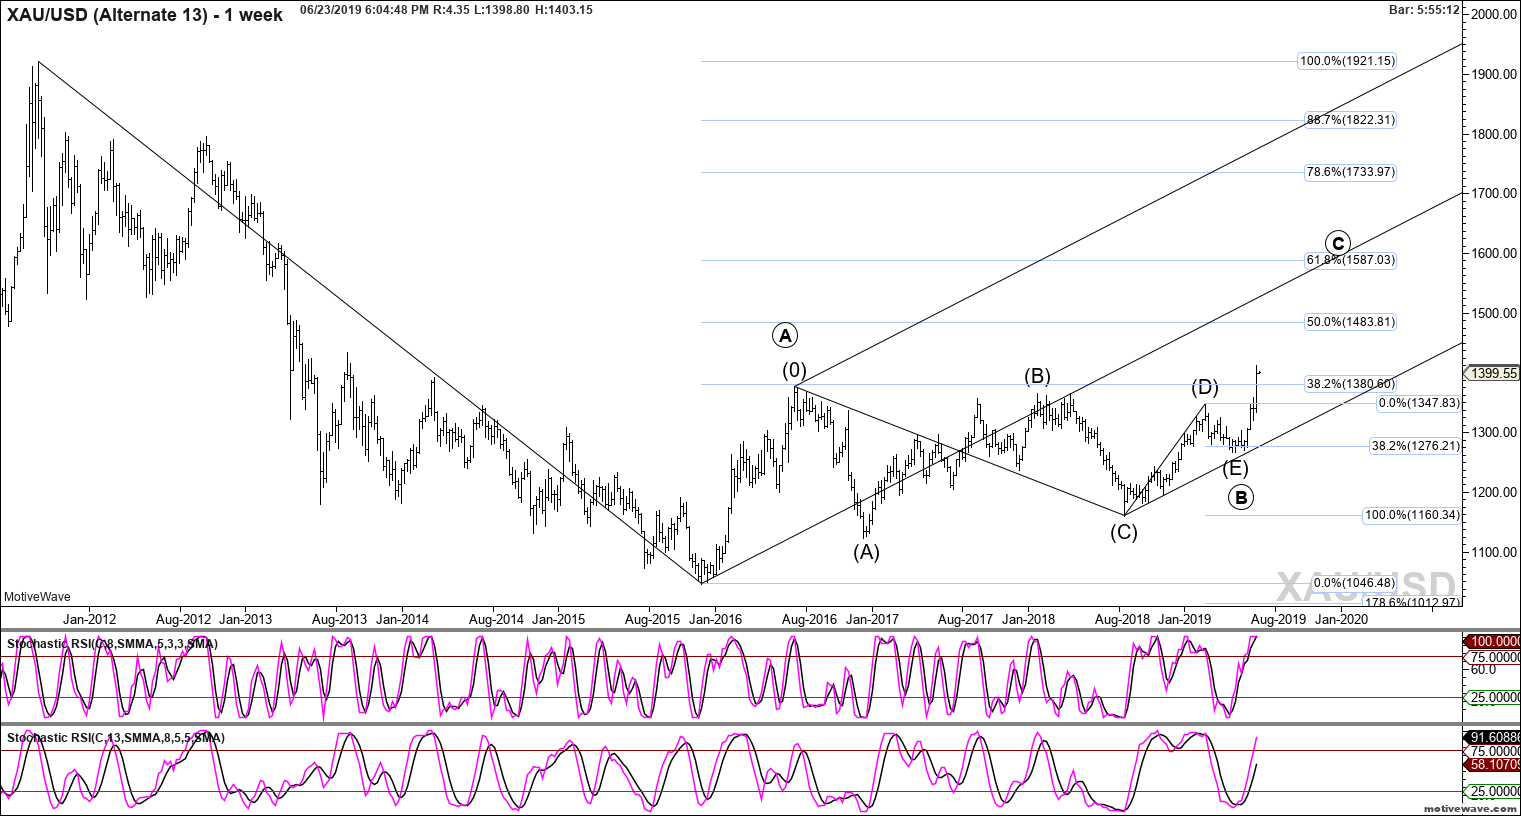
No trade, just a chart. I have not been following this lately, but I could not ignore the news. I am playing catchup.
Al :--)
Al :--)
Click image for original size
AL
albert
Rep: 99
Posts: 3,094
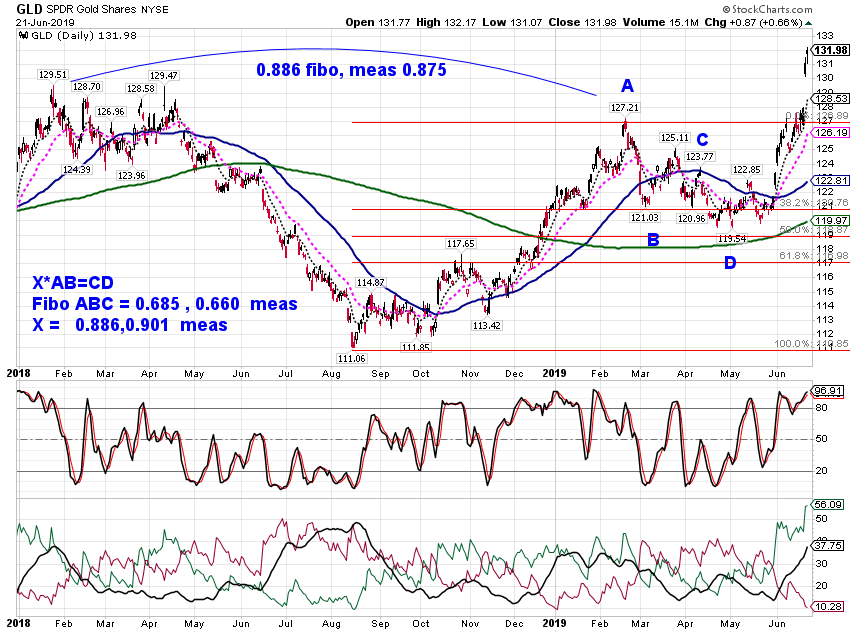
Made a bit on GLD. I exited the trade too early, and I did not monitor it to see if price was strengthening after I exited. It did.
Al
:--|
Al
:--|
Click image for original size
RA
rat89
Rep: 0
Posts: 7,015
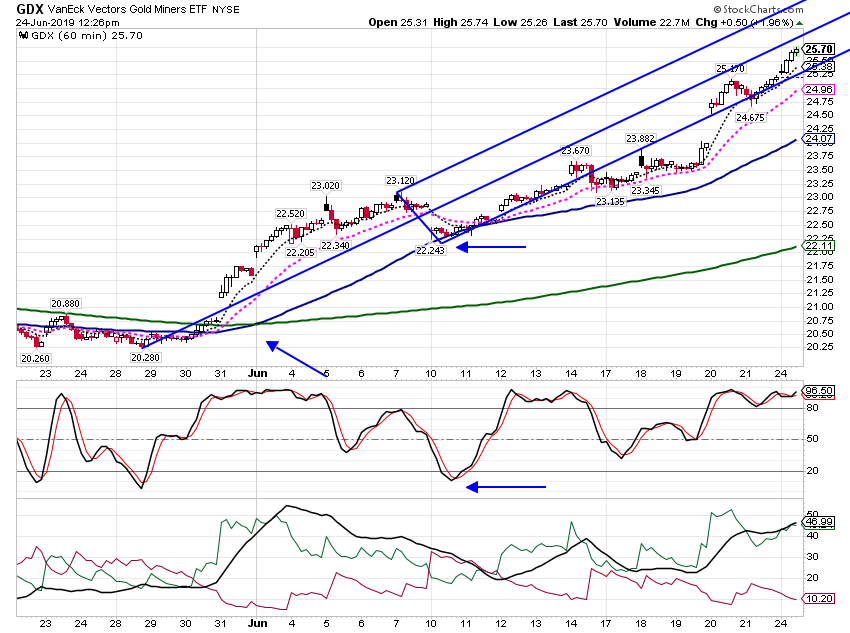
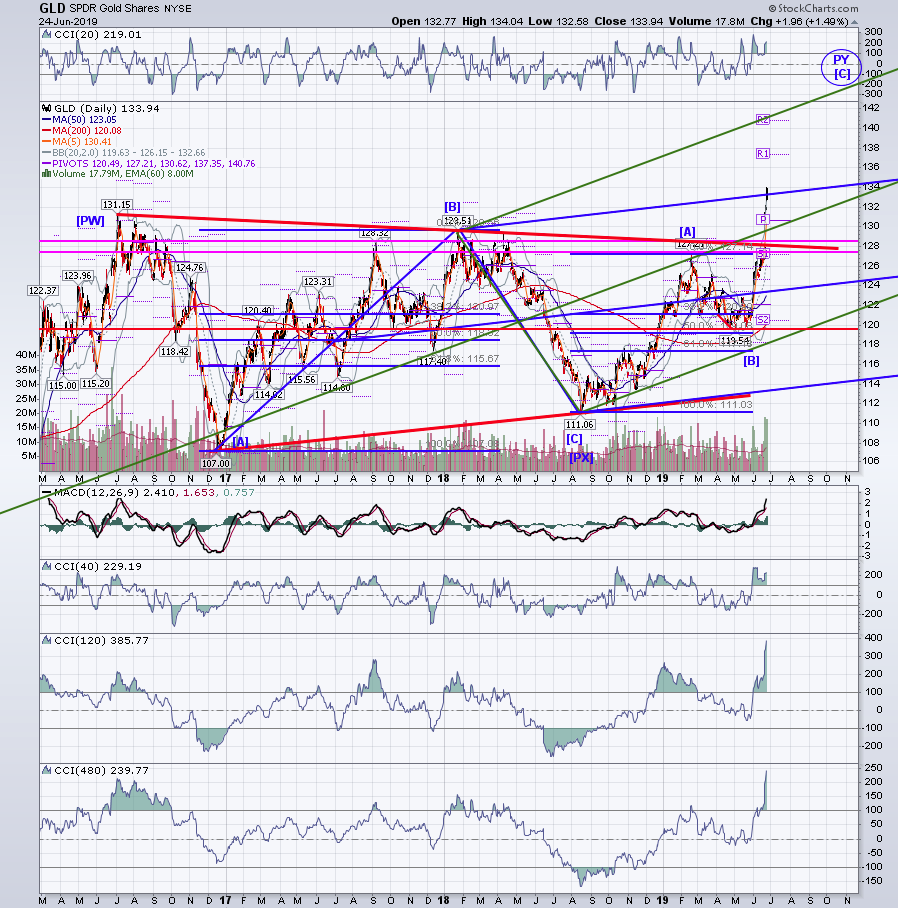
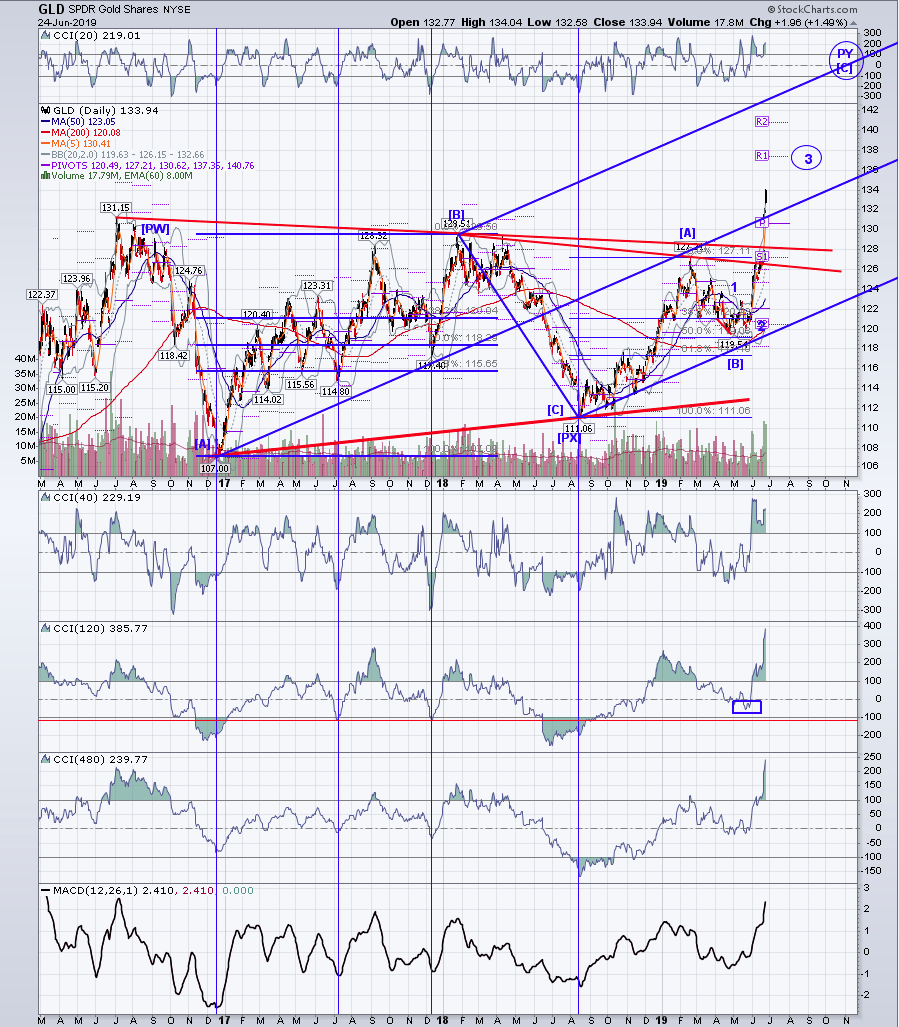
gld daily - does not feel done, though one can say that it has hit one median line target. Funny how gld feels so much more impulsive than spx, even with spx at new all time highs last week.
Click image for original size
Click image for original size
AL
albert
Rep: 99
Posts: 3,094
rat,
The 50 and 200 mas on my charts are simple moving averages.
Al
The 50 and 200 mas on my charts are simple moving averages.
Al
Originally posted by rat89
Al - the ma's are 50 and 200? ma or ema?
DU
Duane
Rep: 100
Posts: 1,095
Nice Chart Rat, how do you use CCI and why did you apply the blue box to your 120 CCI.
Originally posted by rat89
gld daily - does not feel done, though one can say that it has hit one median line target. Funny how gld feels so much more impulsive than spx, even with spx at new all time highs last week.
Click image for original size
Click image for original size