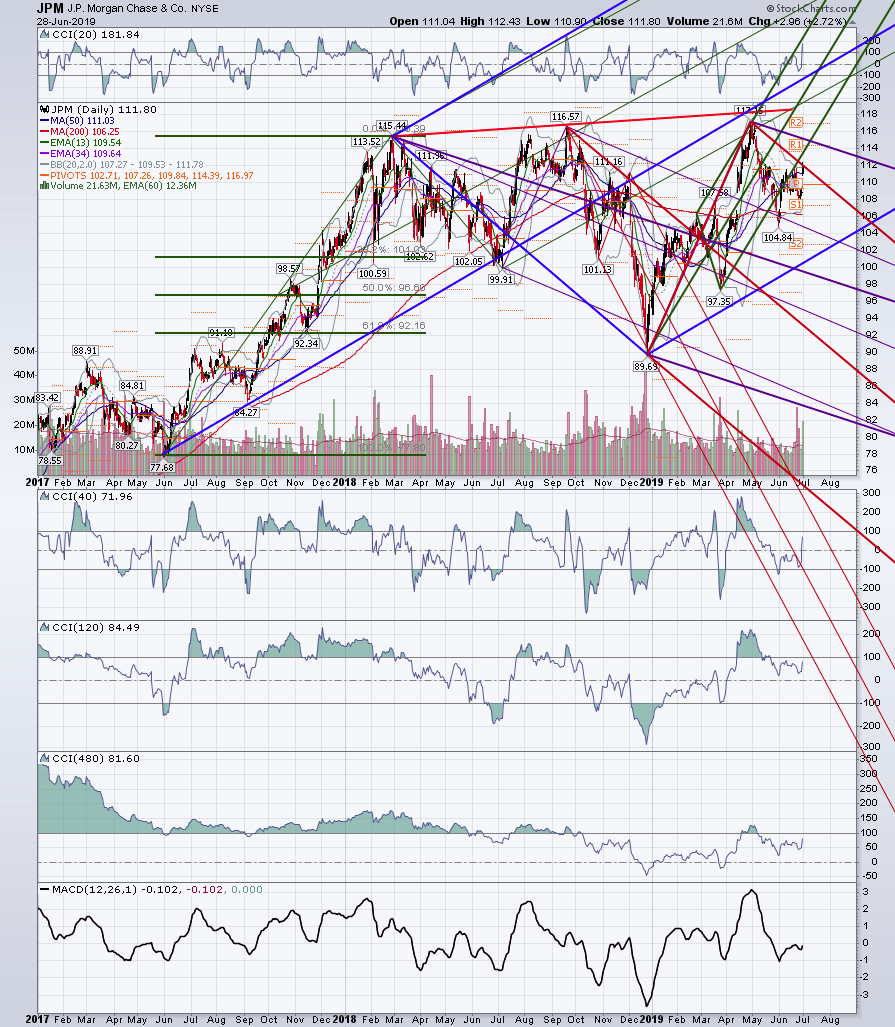
Starting it off.
Al
AL
albert
Rep: 99
Posts: 3,094
Paper trading. Made a little on JPM this morning. Lost some on the exit; I sold at the market and I should have used a limit sell order. I discovered a new XABCD drawing tool in StockCharts, and I am using it to calculate fibos only, no harmonic patterns yet.
Al :--)
Al :--)
Click image for original size
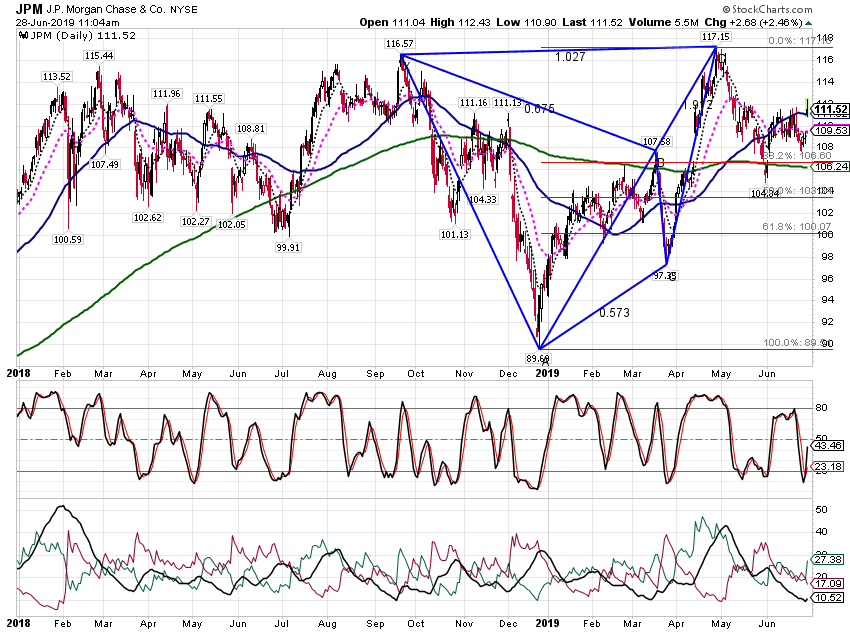
Click image for original size
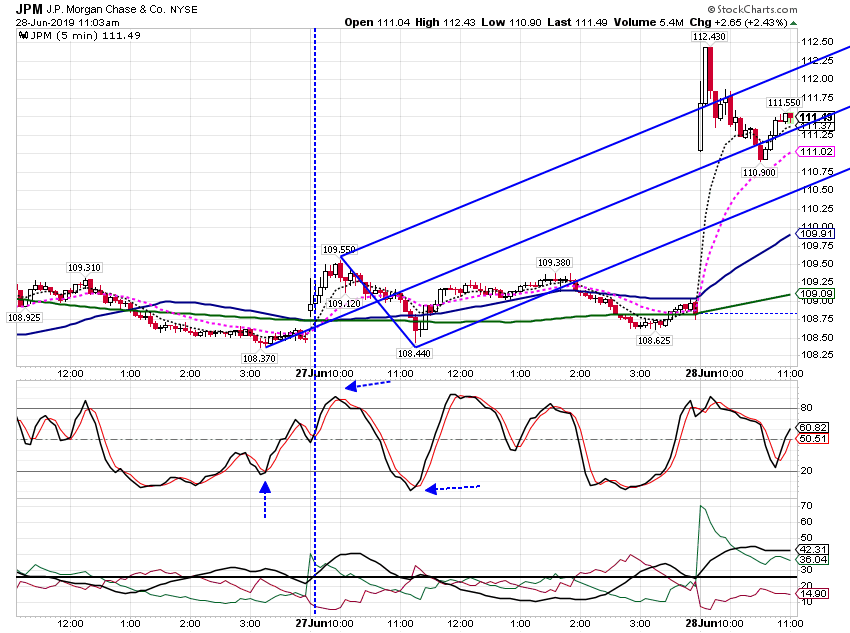
DU
Duane
Rep: 100
Posts: 1,095
Man rat, I wish I could play the line like you and Marcin. Nice work, thanks for sharing. You guys are straight up lil Roofer and Jim. Have a great weekend guys!!
Thanks for marking up the charts, starting to see ...
Thanks for marking up the charts, starting to see ...
Originally posted by rat89
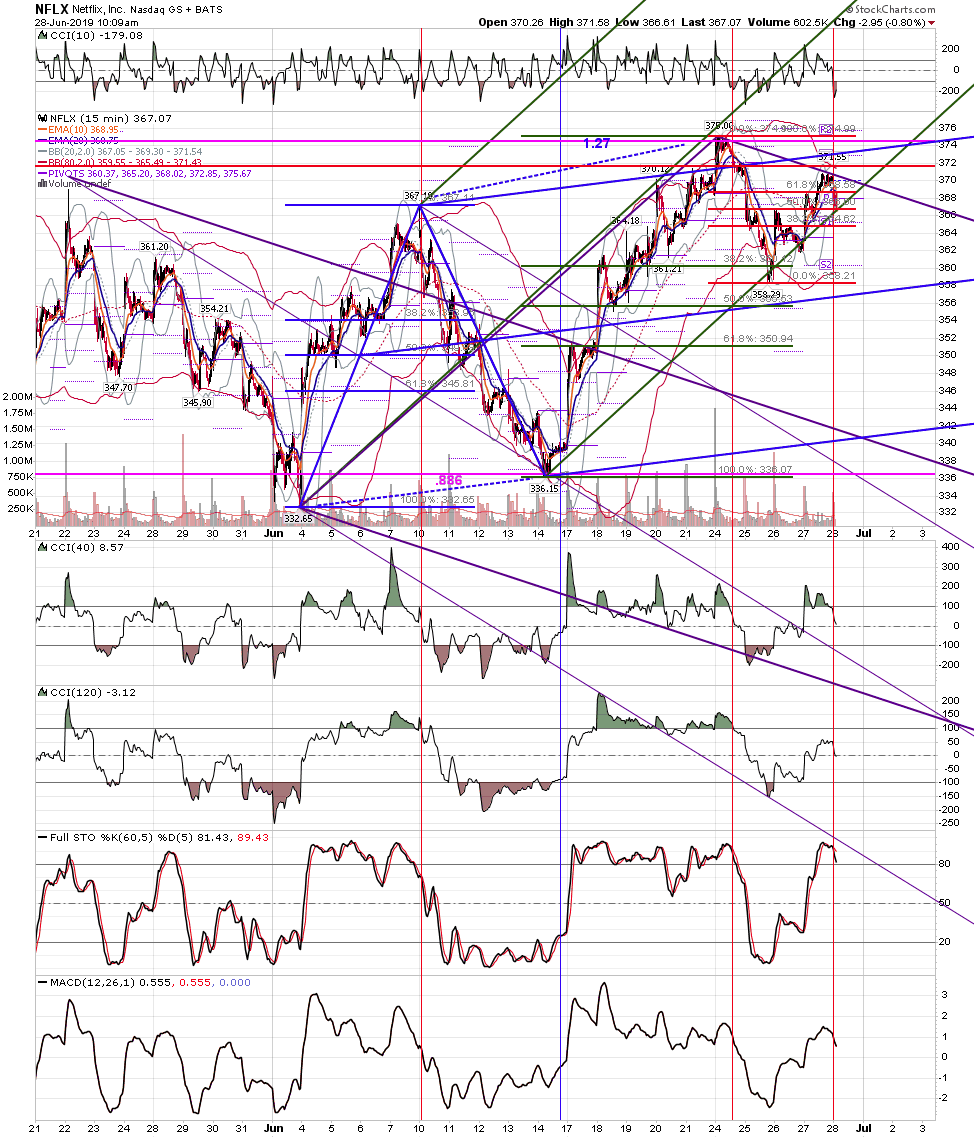
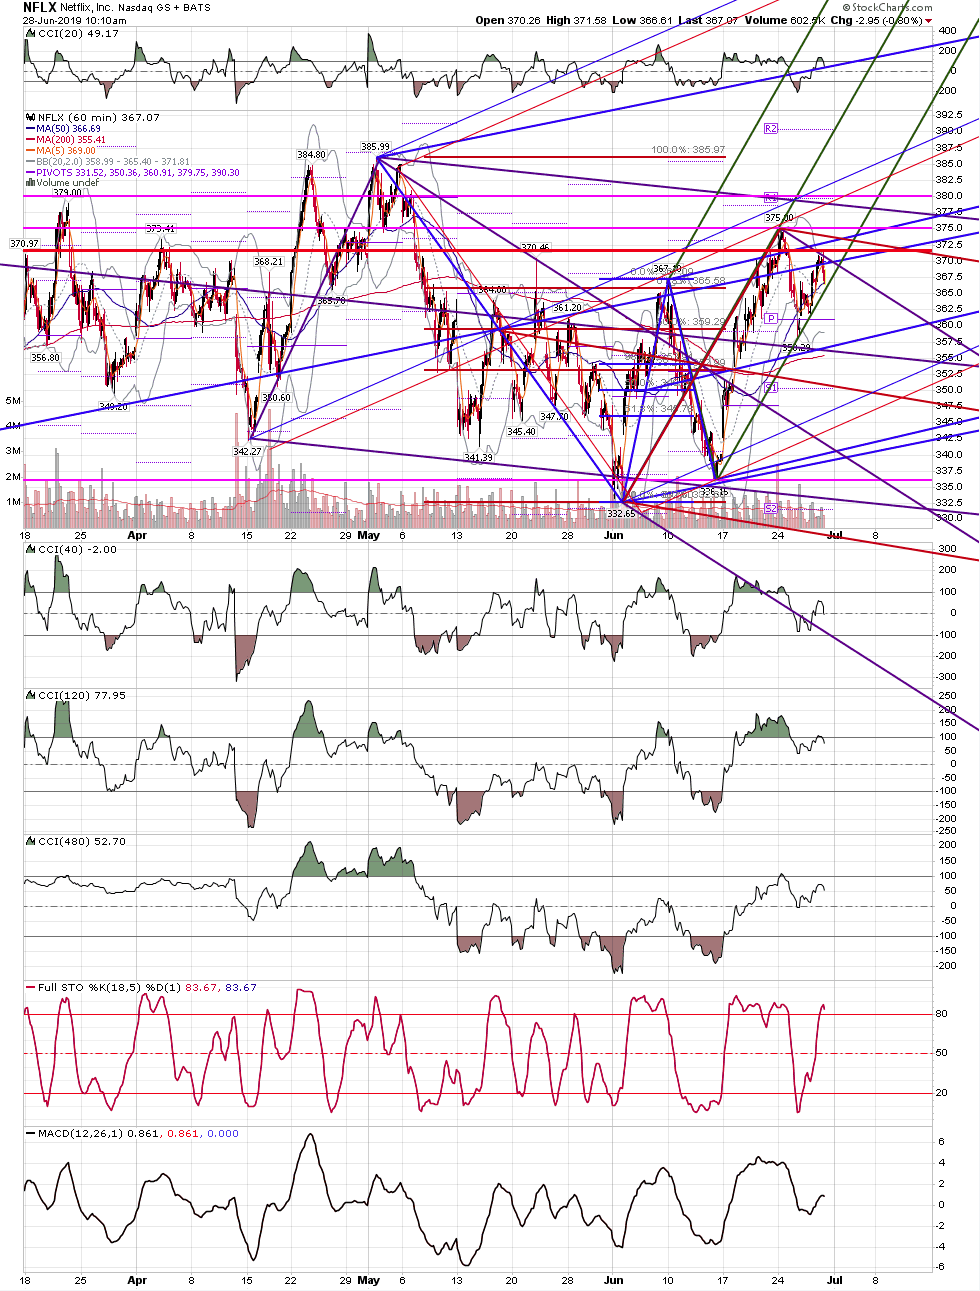
nflx 15 and 60 -
385.99 - 332.65 = .786 at 374.58
375.00 - 358.29 = .786 at 351.42
hit the .786 and moved down hard, made a retest at the low, and moved back up to the second .786
Click image for original size
Click image for original size
DU
Duane
Rep: 100
Posts: 1,095
Al, great charts this week!!! Thanks for sharing!!
Originally posted by albert
Paper trading. Made a little on JPM this morning. Lost some on the exit; I sold at the market and I should have used a limit sell order. I discovered a new XABCD drawing tool in StockCharts, and I am using it to calculate fibos only, no harmonic patterns yet.
Al :--)
Click image for original size
Click image for original size