Starting it off.
Al
RA
rat89
Rep: 0
Posts: 7,015
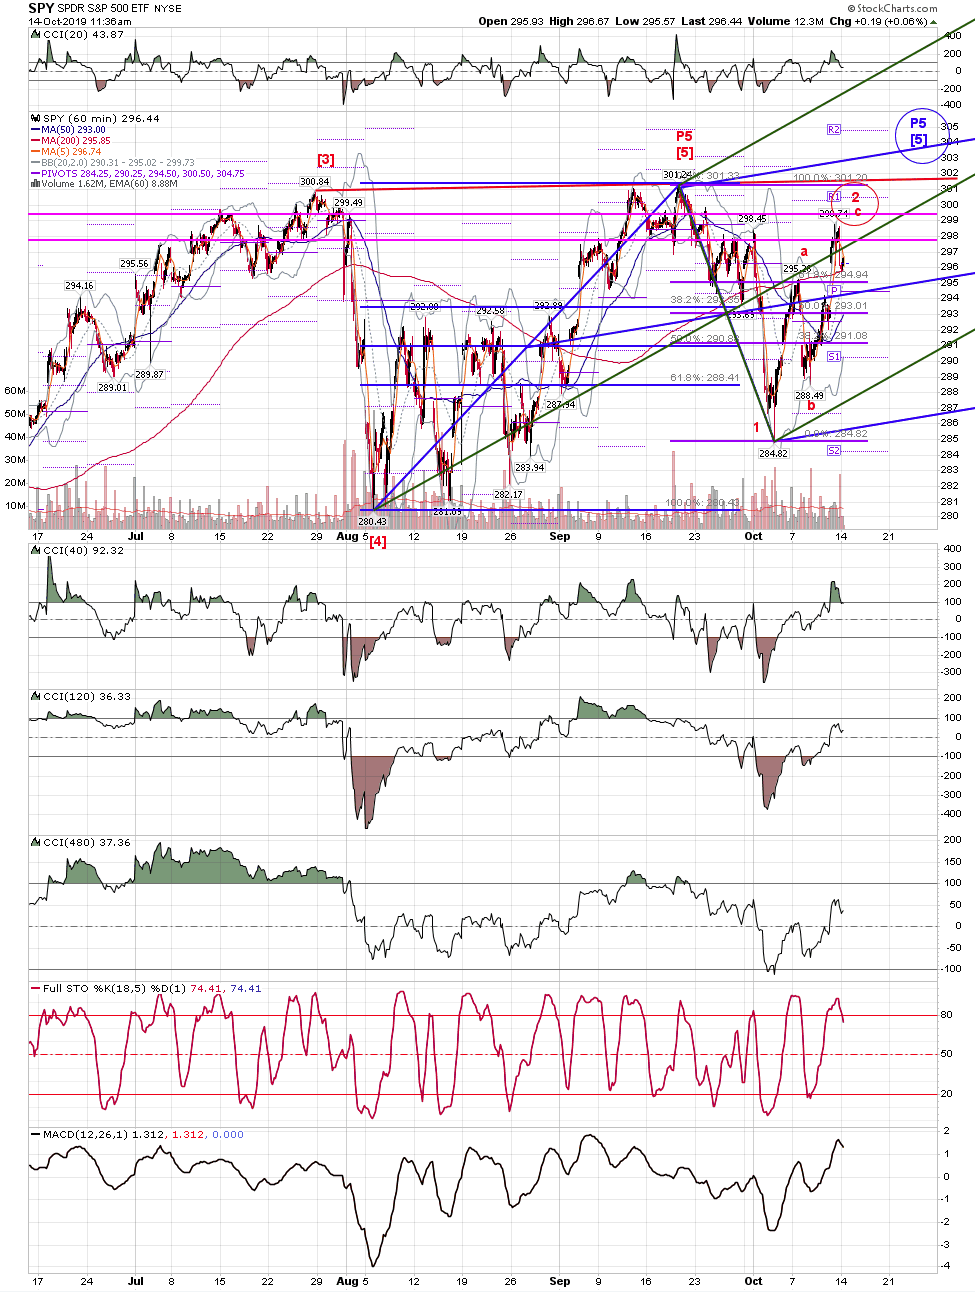
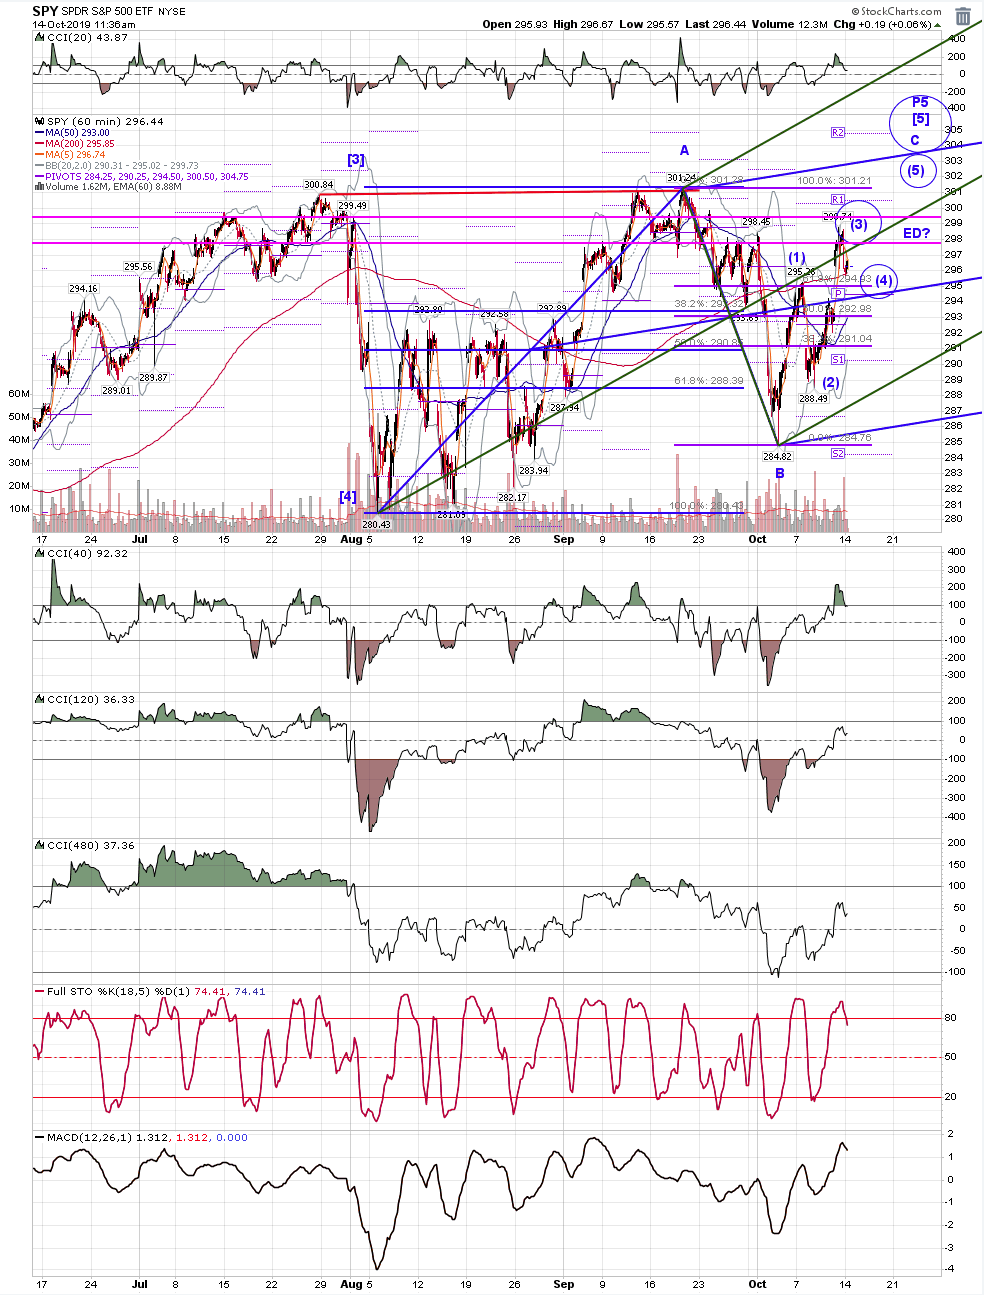
red count or blue?
Click image for original size
Click image for original size
RA
rat89
Rep: 0
Posts: 7,015
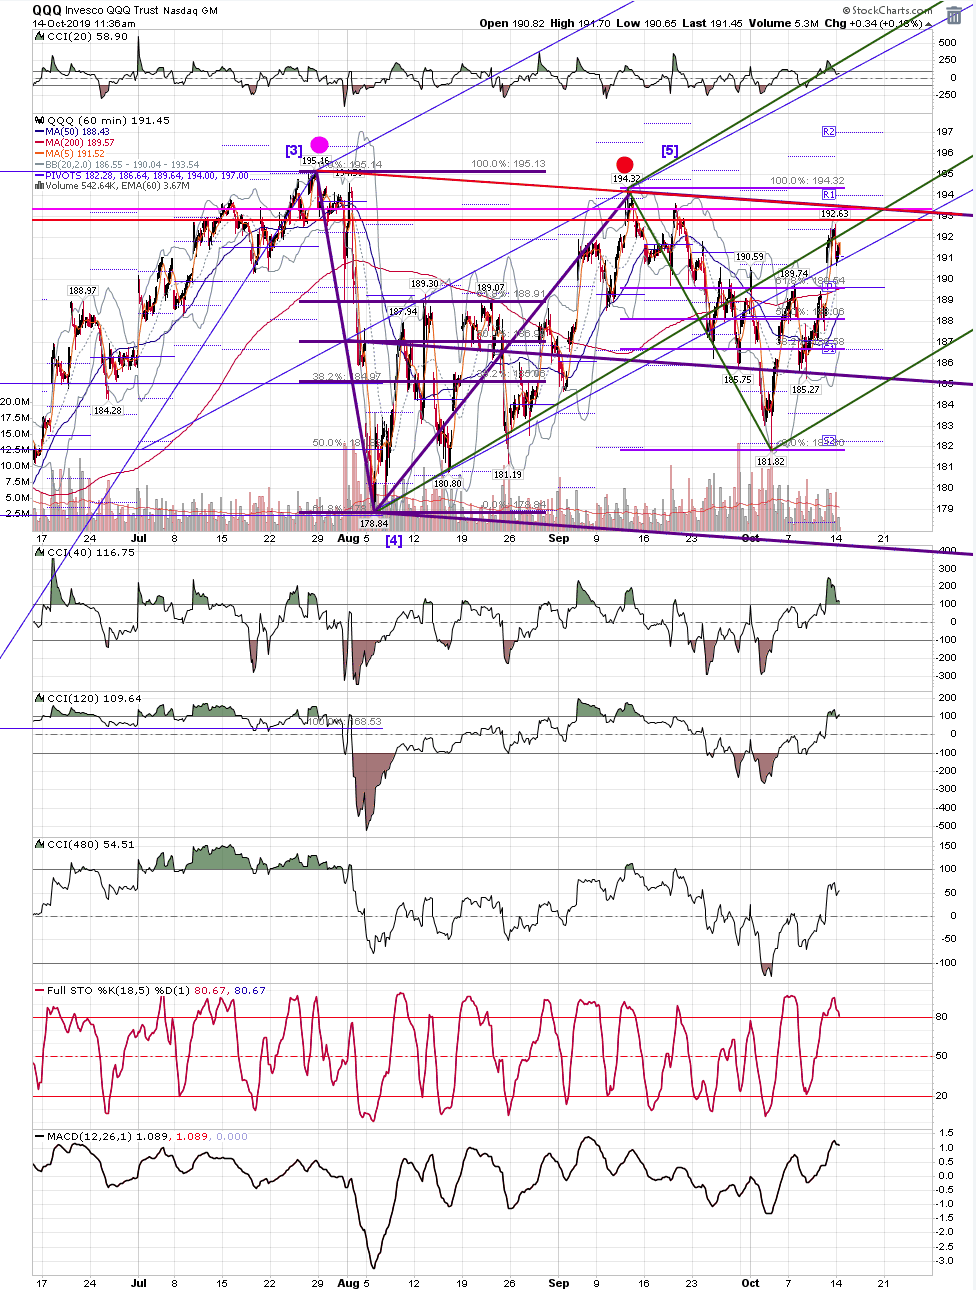
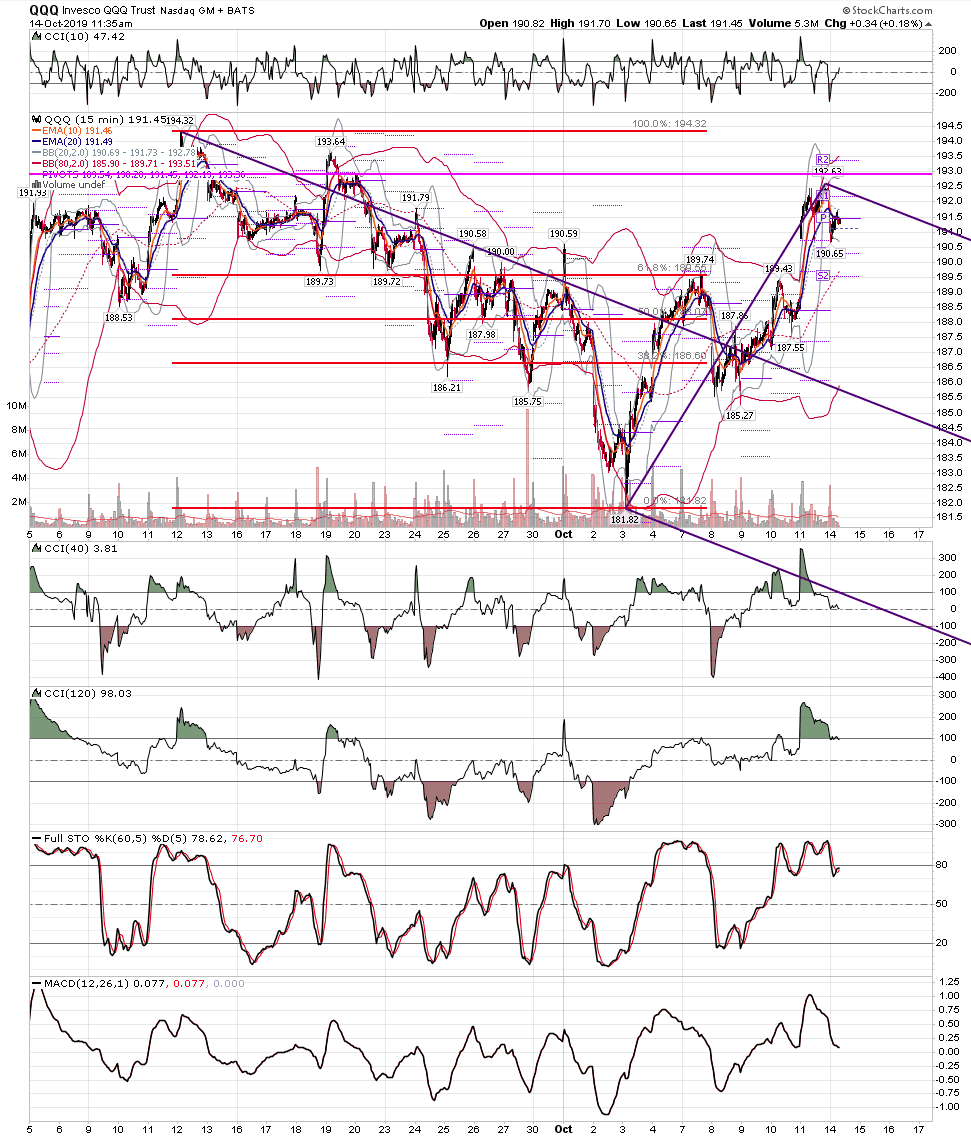
qqq stopped just under the double .886 Friday.....so break up to the 197 area, or reverse?
Click image for original size
Click image for original size
RA
rat89
Rep: 0
Posts: 7,015
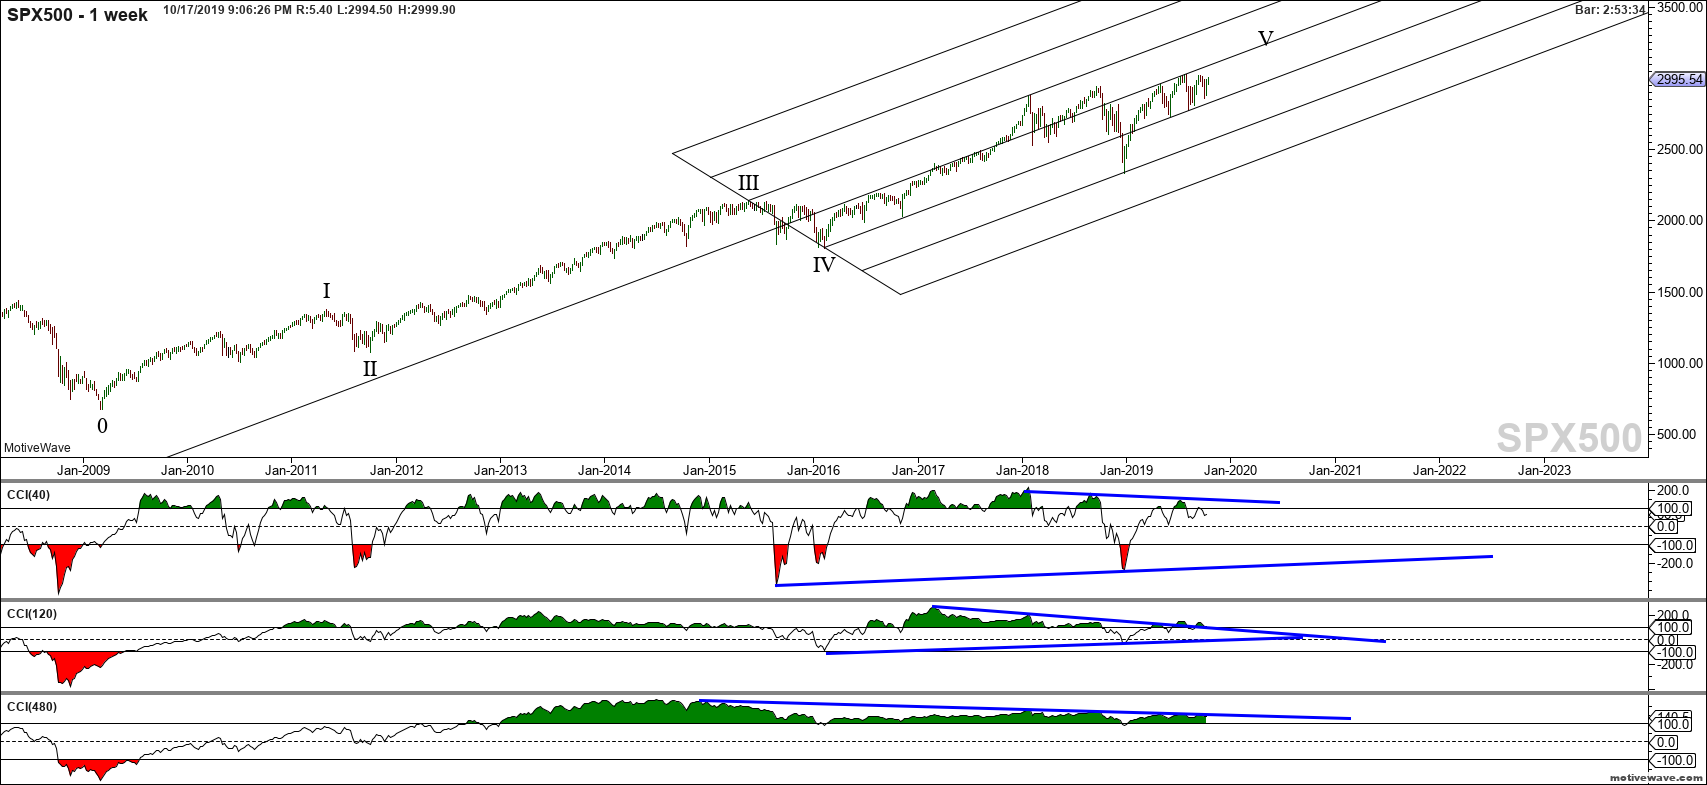
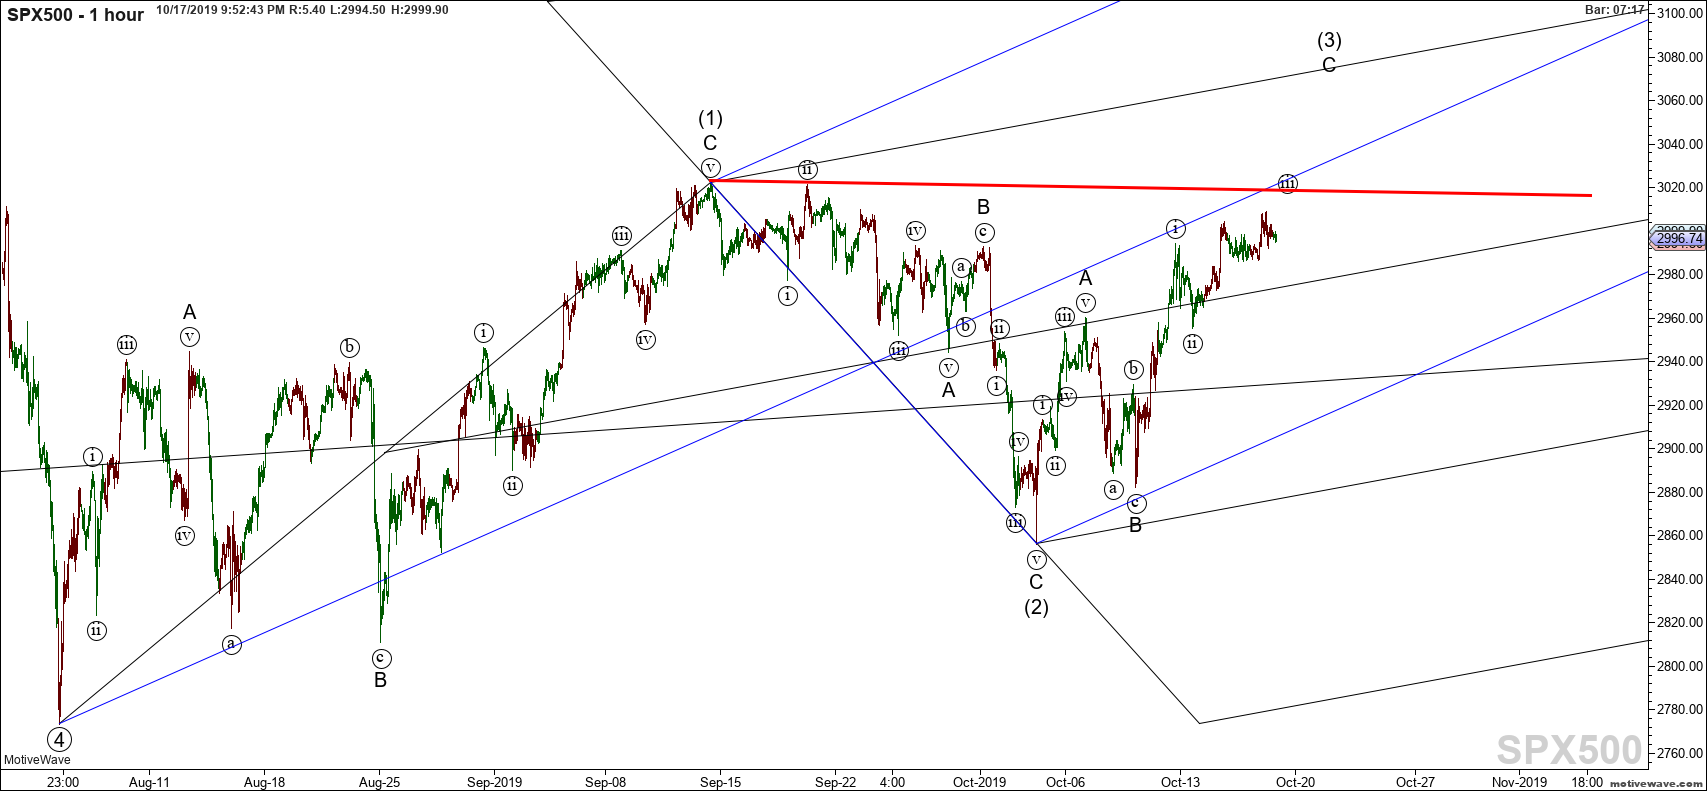
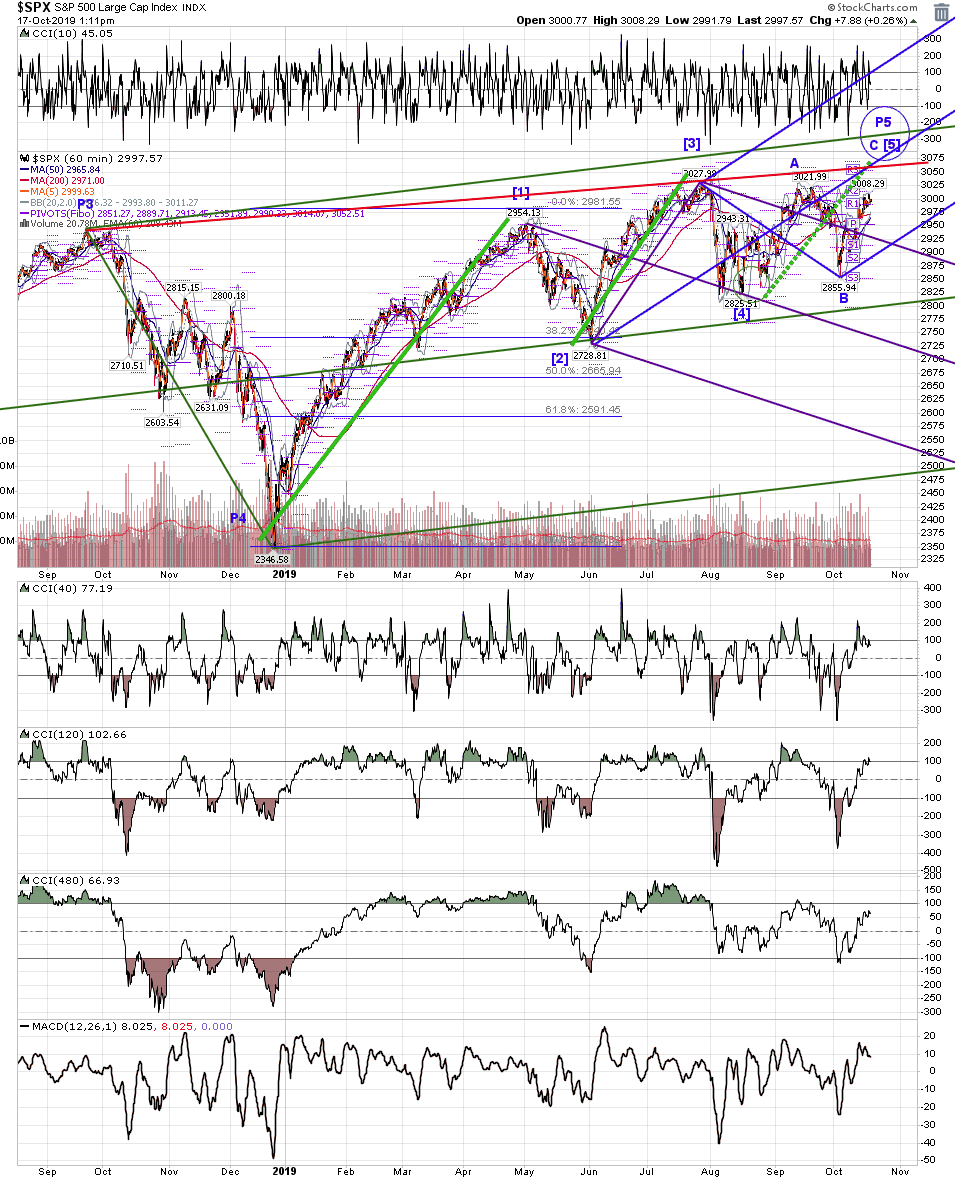
ty guys....and qqq broke through that area.....I am leaning toward the blue count for spx over the next several sessions....the 3050 area would be the best completion for P5 and Major [5]
Originally posted by Duane
Nice work RAT! Your charts are excellent .
AL
albert
Rep: 99
Posts: 3,094
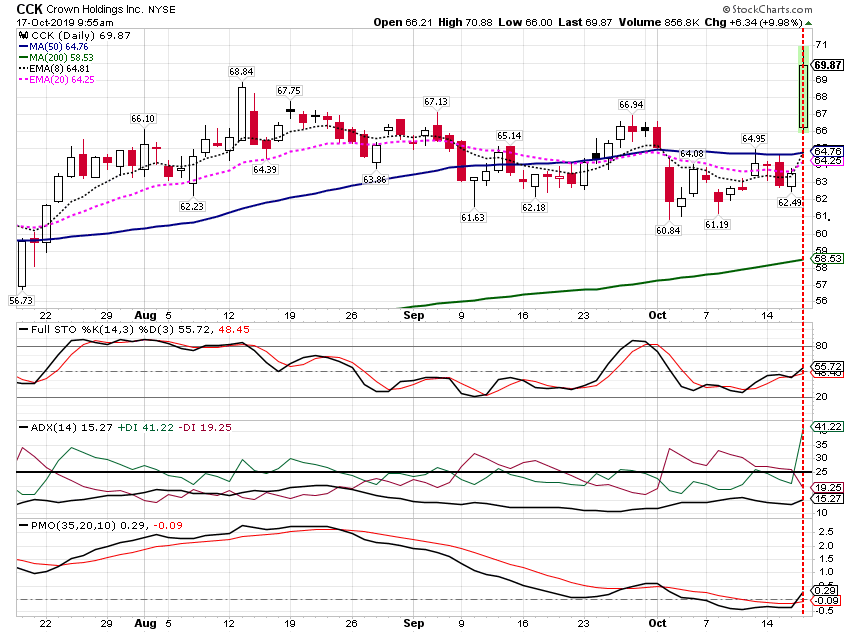
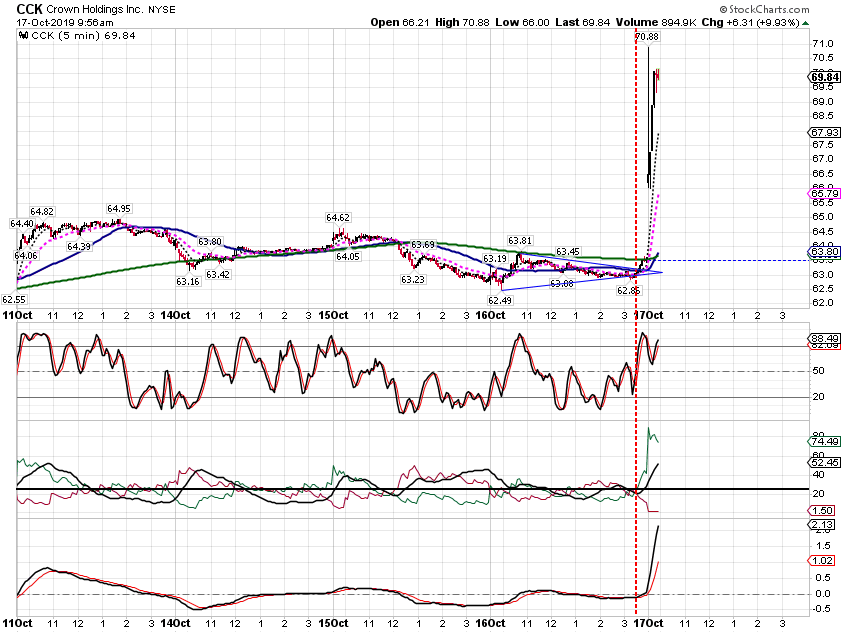
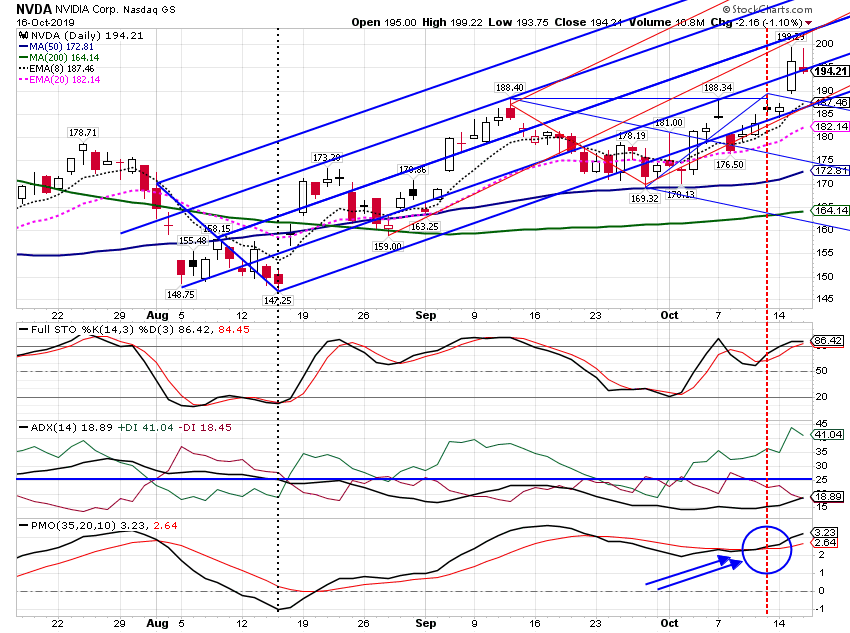
Paper trading. DOH! I missed the nice upmove in NVDA a couple of days ago. I did make some buying a CCK call near the open today. Lost some on a long NVDA call this morning. I am liking the STO, ADX ( and DI), and PMO indicator combination.
Al :--)
Al :--)
Click image for original size
Click image for original size
Click image for original size
RA
rat89
Rep: 0
Posts: 7,015
spx 60
looks like an ending diagonal, where [5]<[3]<[1]
P5=P1 at 3051
{5}=.78*{3} at 3055
C=A at 3033
looks like an ending diagonal, where [5]<[3]<[1]
P5=P1 at 3051
{5}=.78*{3} at 3055
C=A at 3033
Click image for original size
DU
Duane
Rep: 100
Posts: 1,095
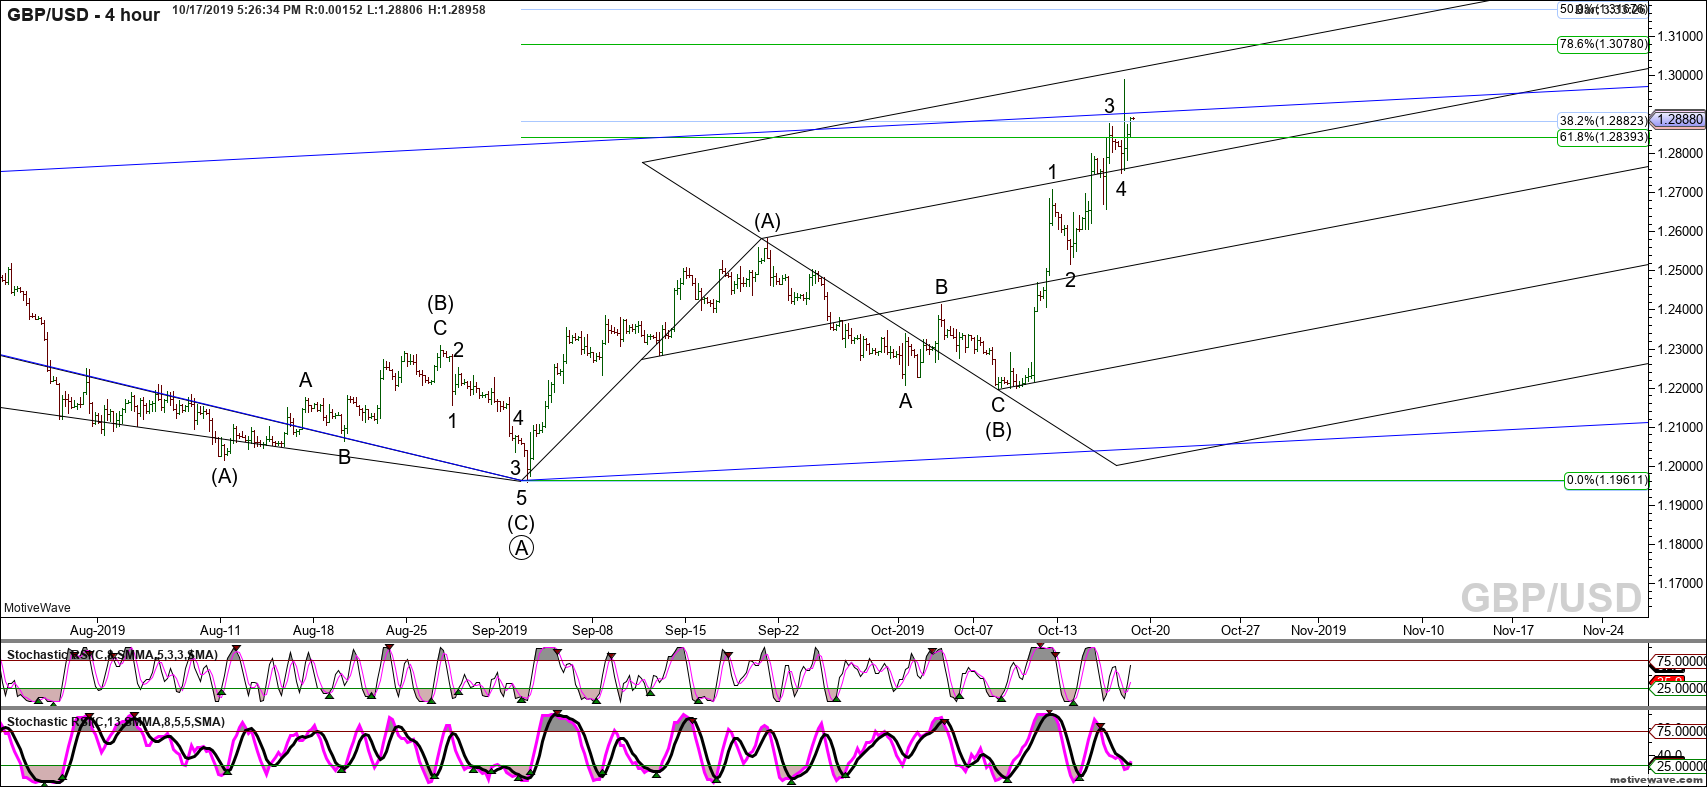
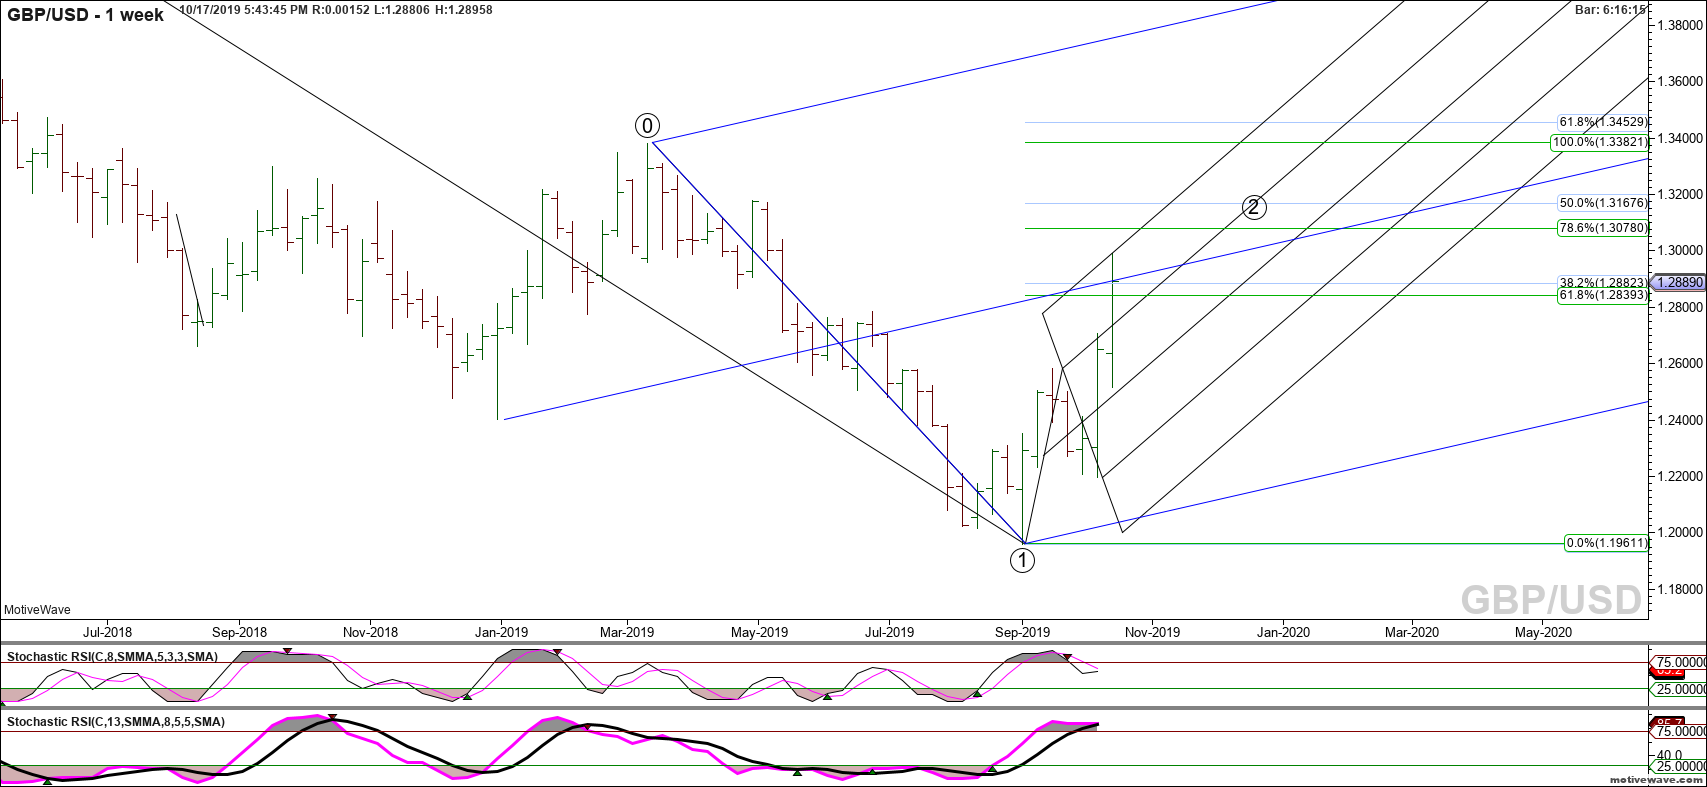
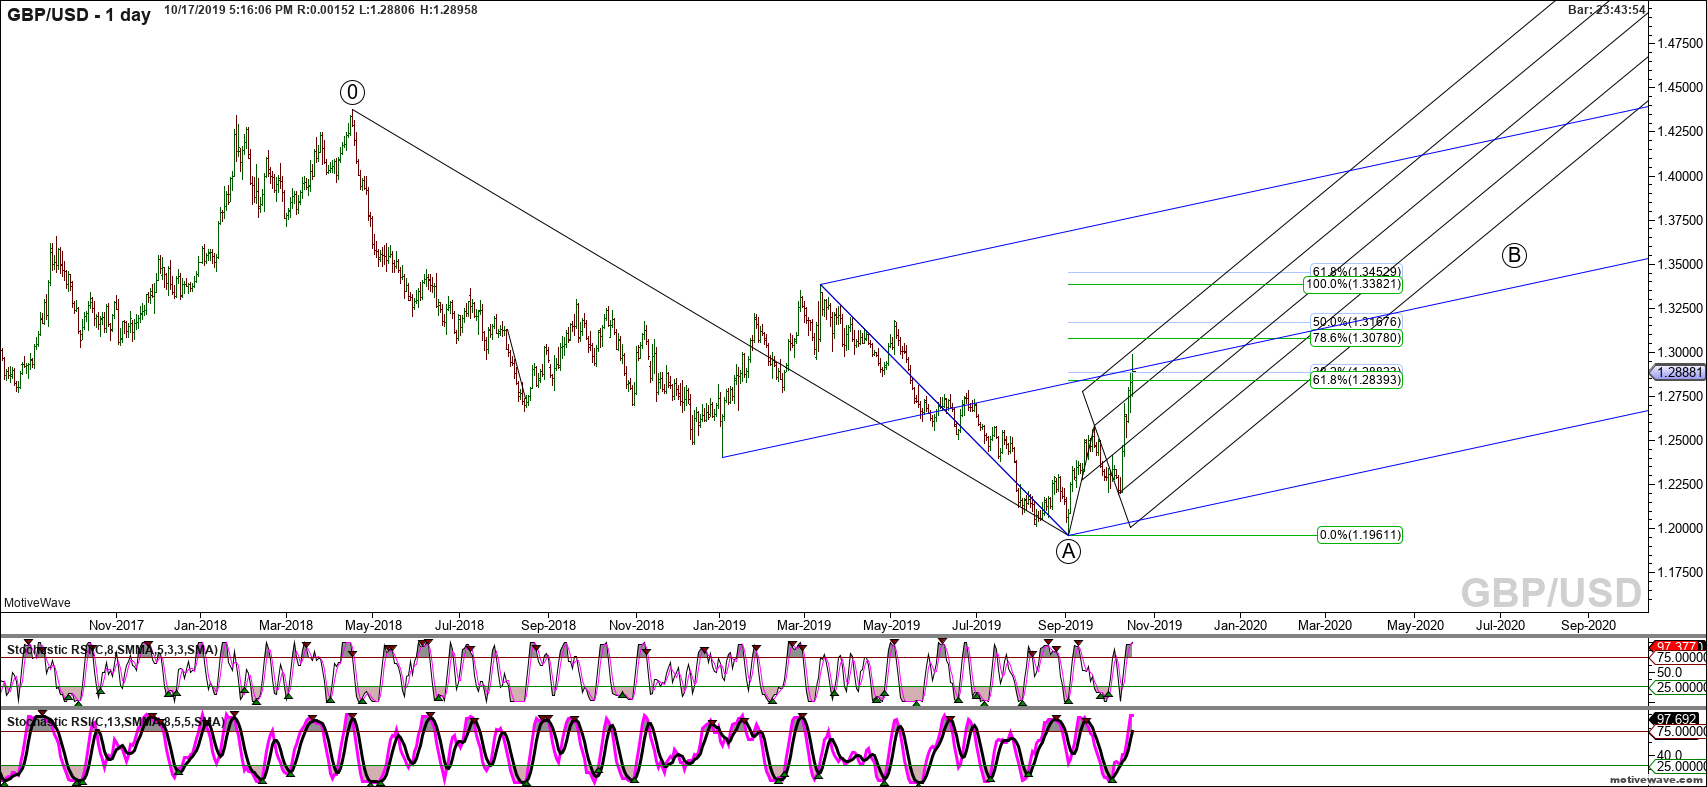
Bexit deal is done? It is my contention that the charts can ALWAYS tell before what the deal is. However this situation is somewhat ambiguous. The question is, is the implied deal good or bad for the GBP?
Weekly momentum OB and bearish.
Daily, also OB and at two lines
Of course if I were Jim or Rat, I would have many more lines on the chart.
We shall see. This ABCD can easily turn into a bullish trend, however the British Parliament must confirm, so lets see.
H4 Bullish momentum , which implies we could have a pump and dump for another signal short.
Weekly momentum OB and bearish.
Click image for original size
Daily, also OB and at two lines
Click image for original size
Of course if I were Jim or Rat, I would have many more lines on the chart.
We shall see. This ABCD can easily turn into a bullish trend, however the British Parliament must confirm, so lets see.
H4 Bullish momentum , which implies we could have a pump and dump for another signal short.
Click image for original size