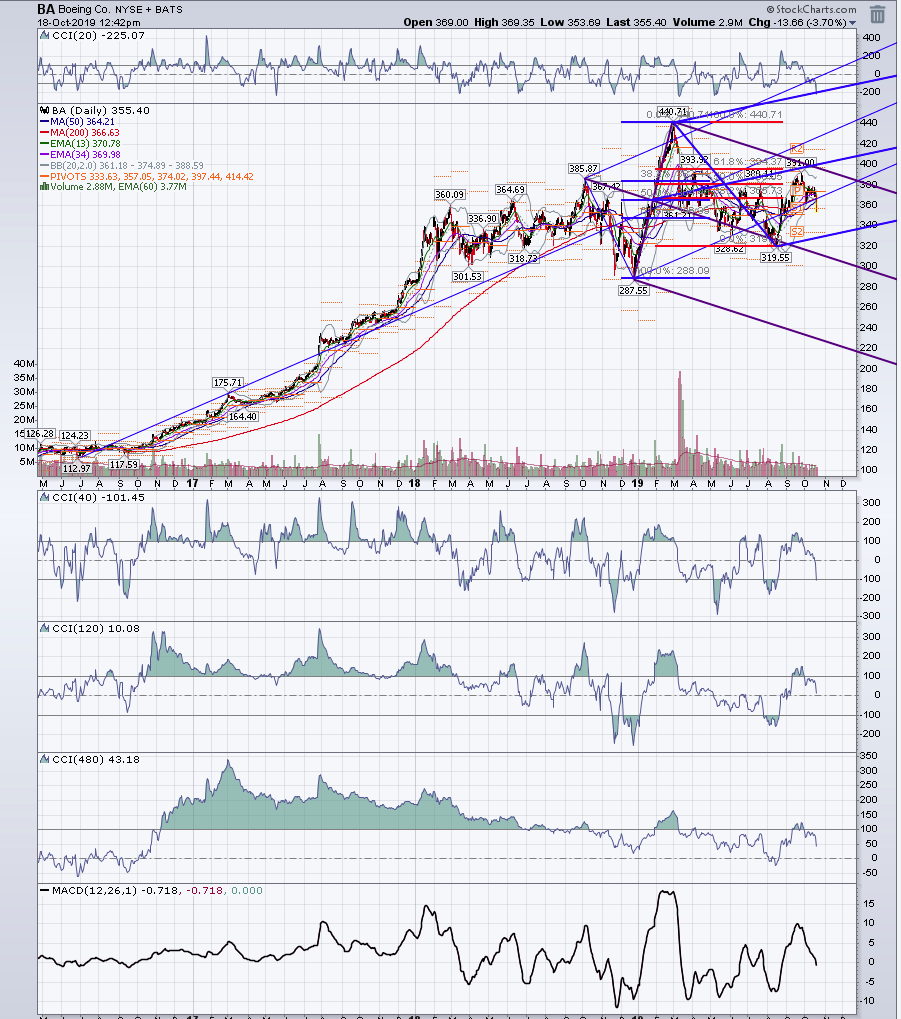
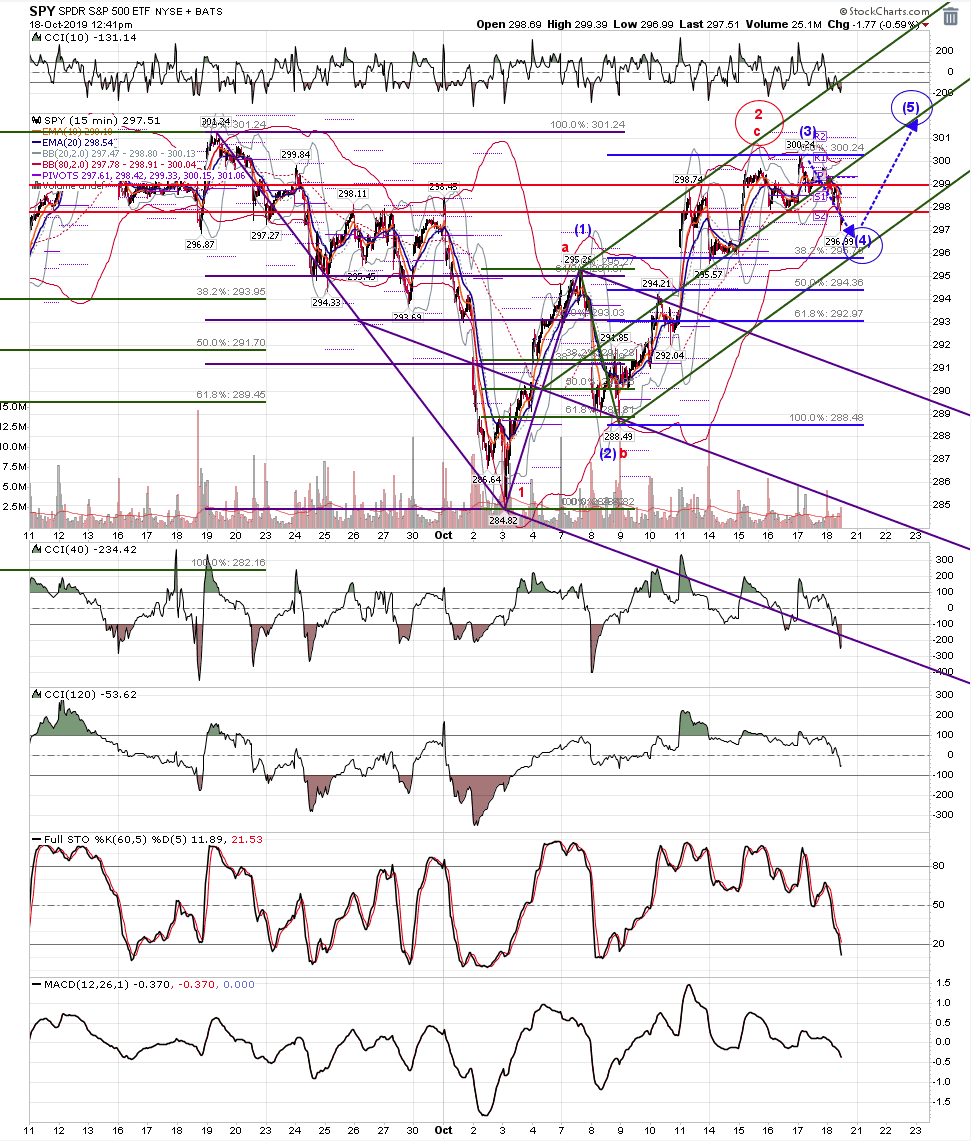
Starting it off.
Al
RA
rat89
Rep: 0
Posts: 7,015
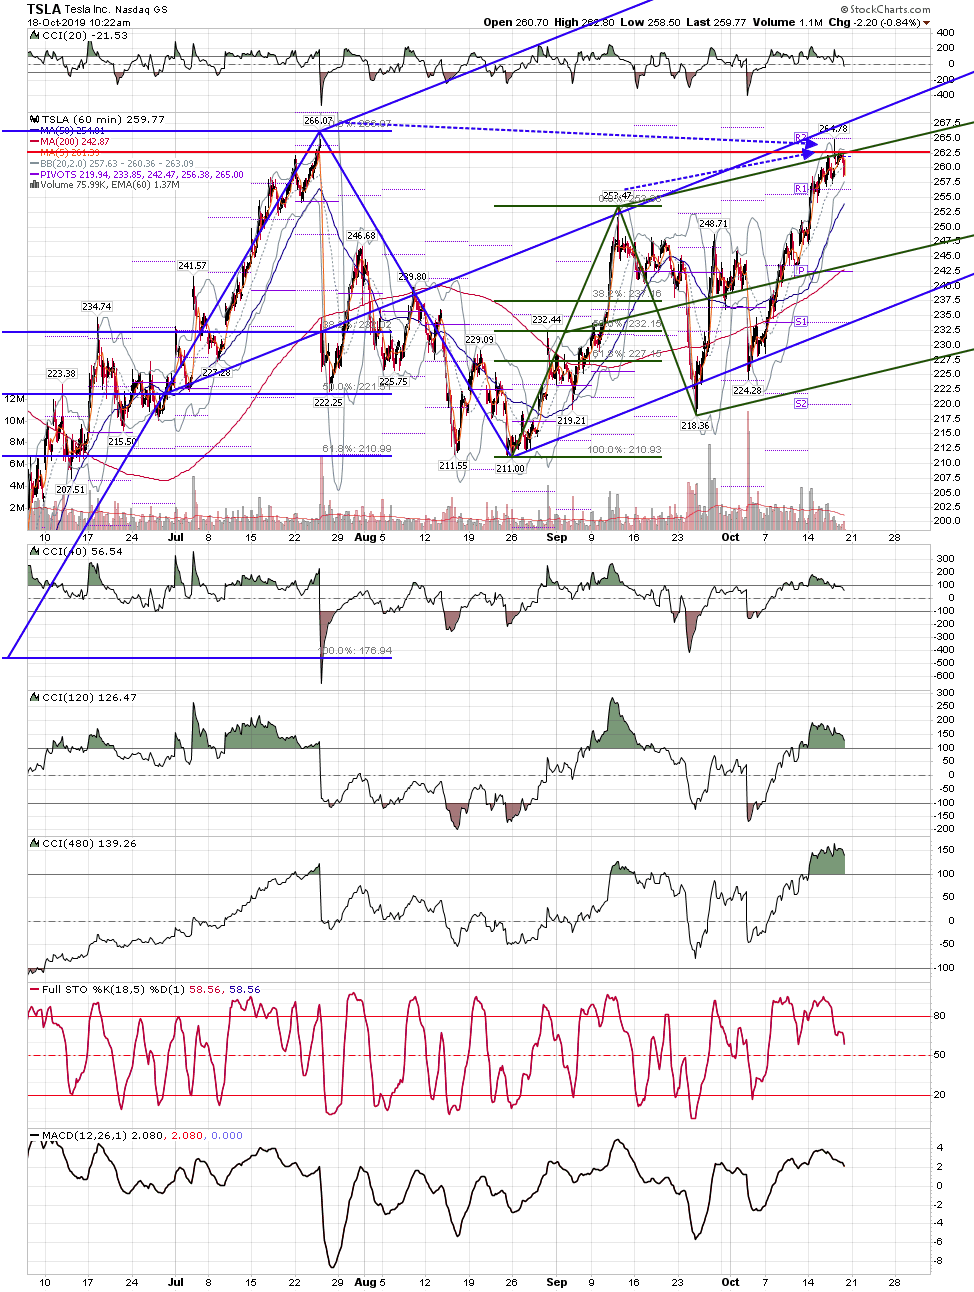
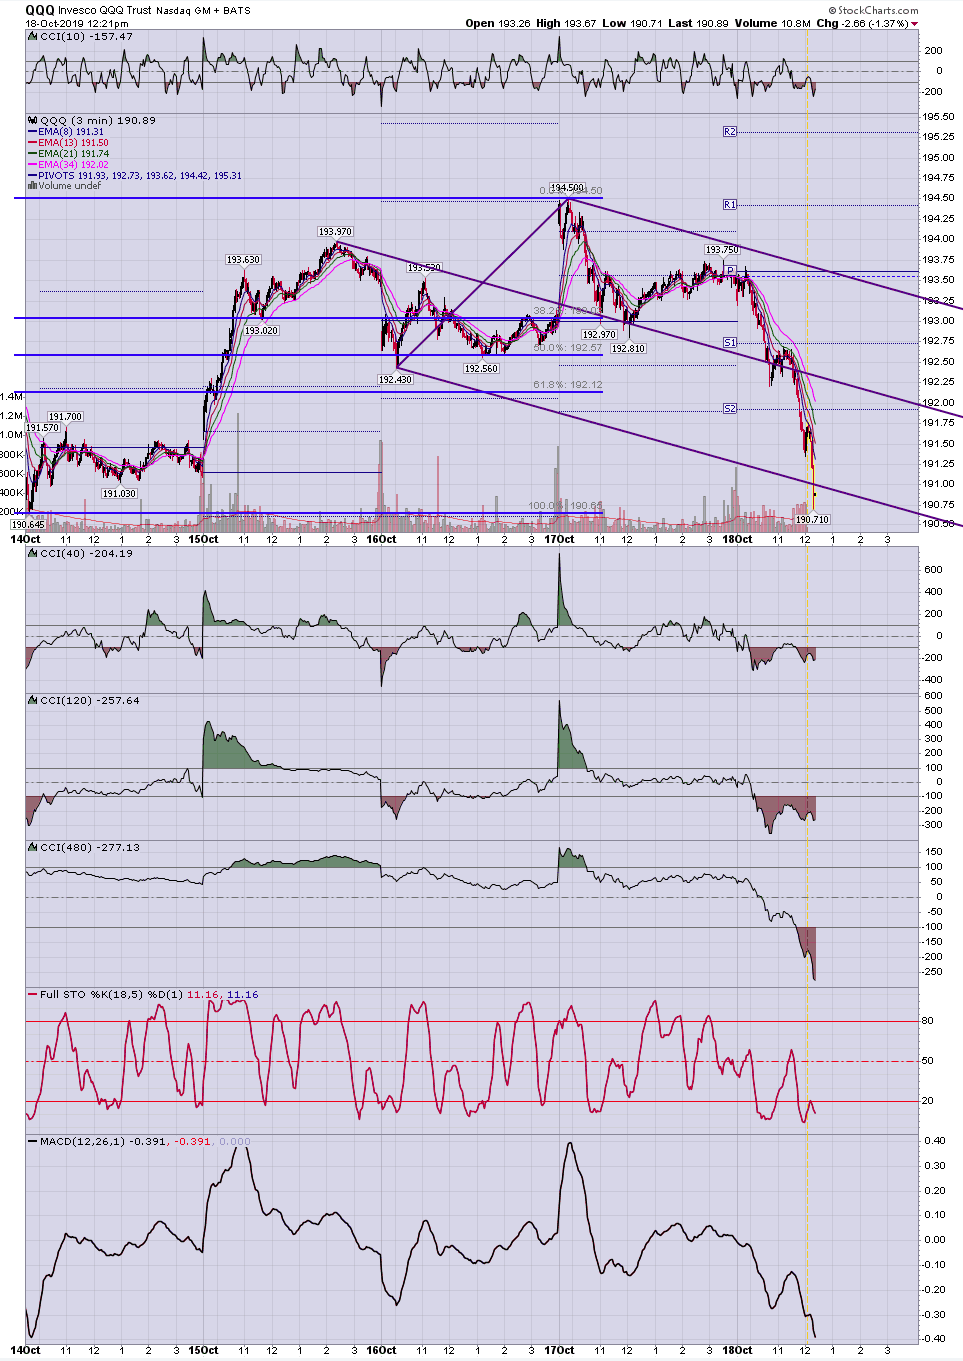
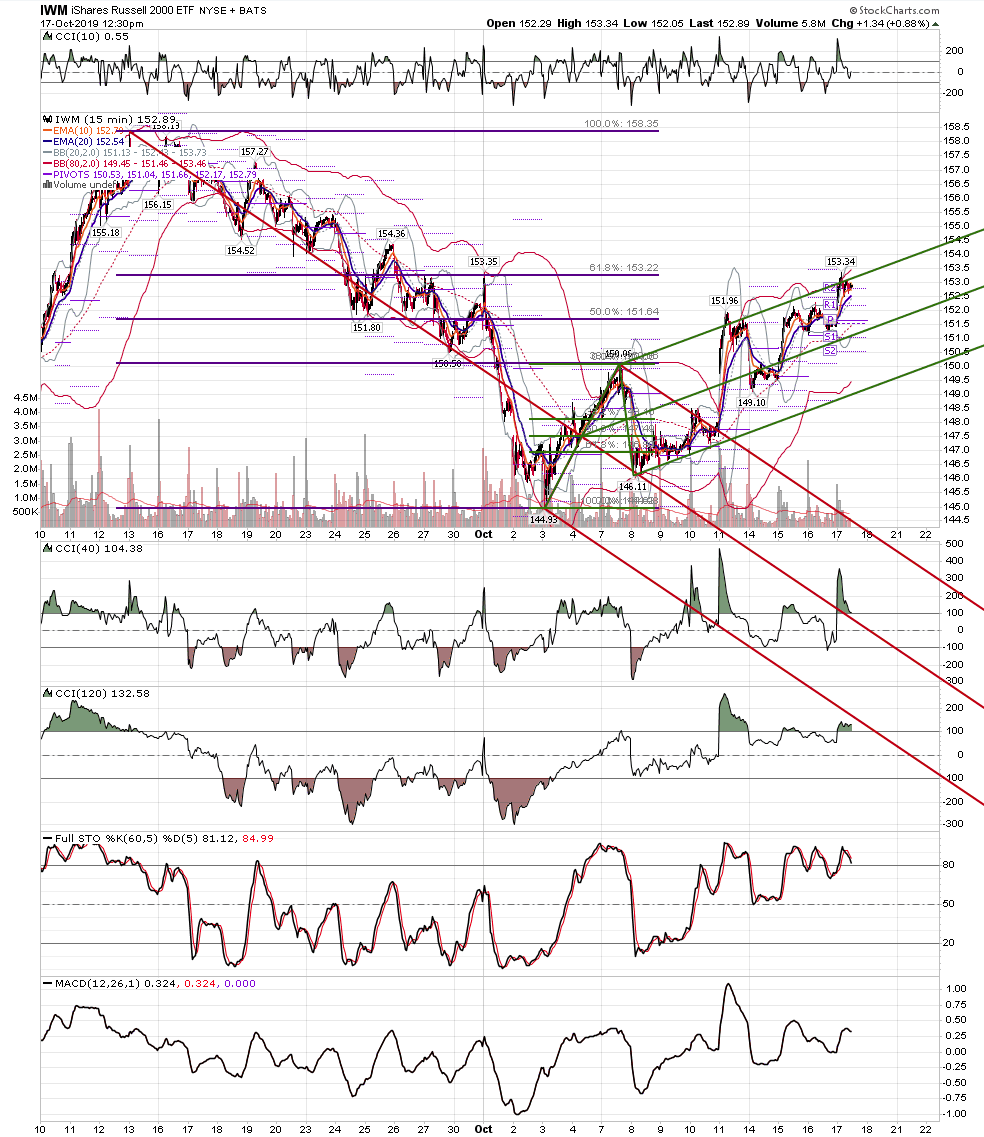
great charts Duane....one observation on spx is that oe Thursday is usually a strong trend day, with prices going to extremes in the direction of the trend. It didn't happen yesterday, and there was relatively "good" news. Price is too close to the high for too long to not get through it, but so far, the ending diagonal looks most likely, with a limit for the ED of 3121, but so many things tying up around 3050.
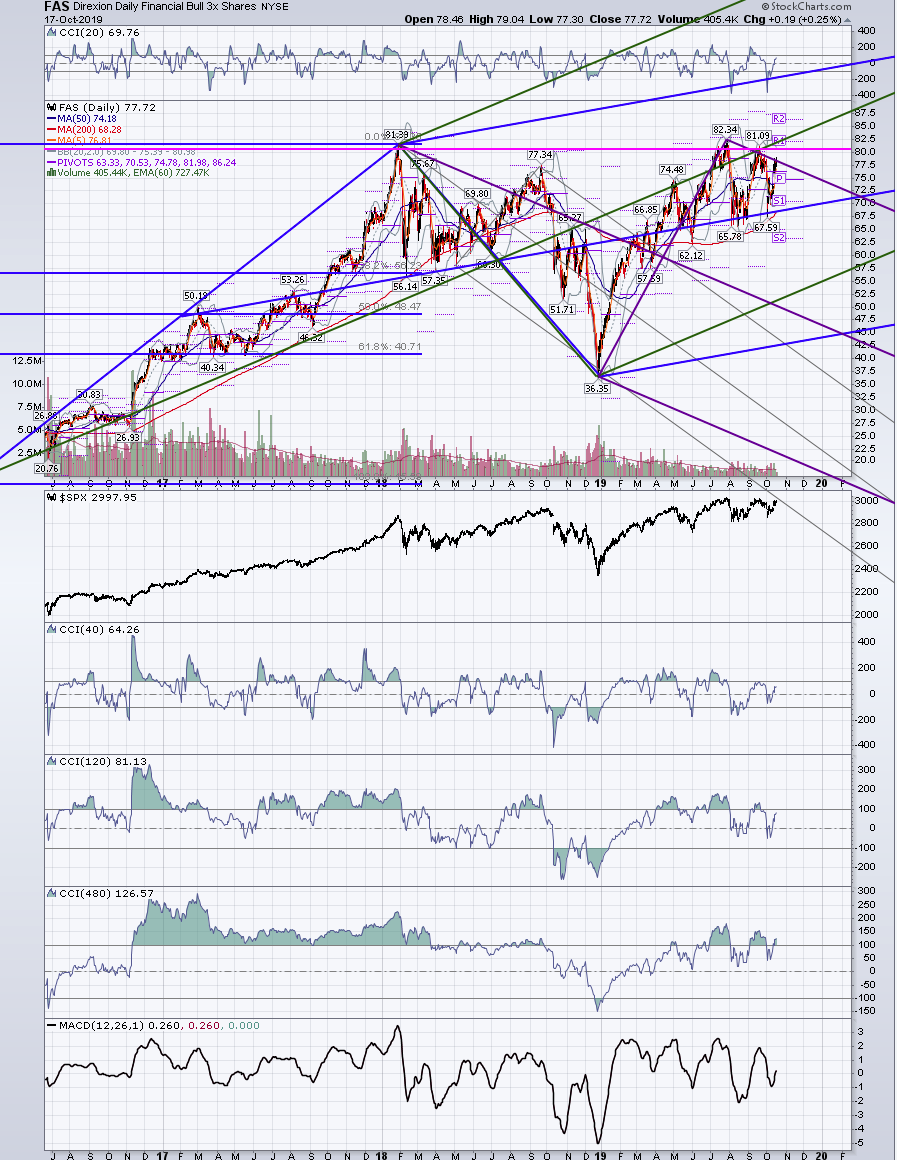
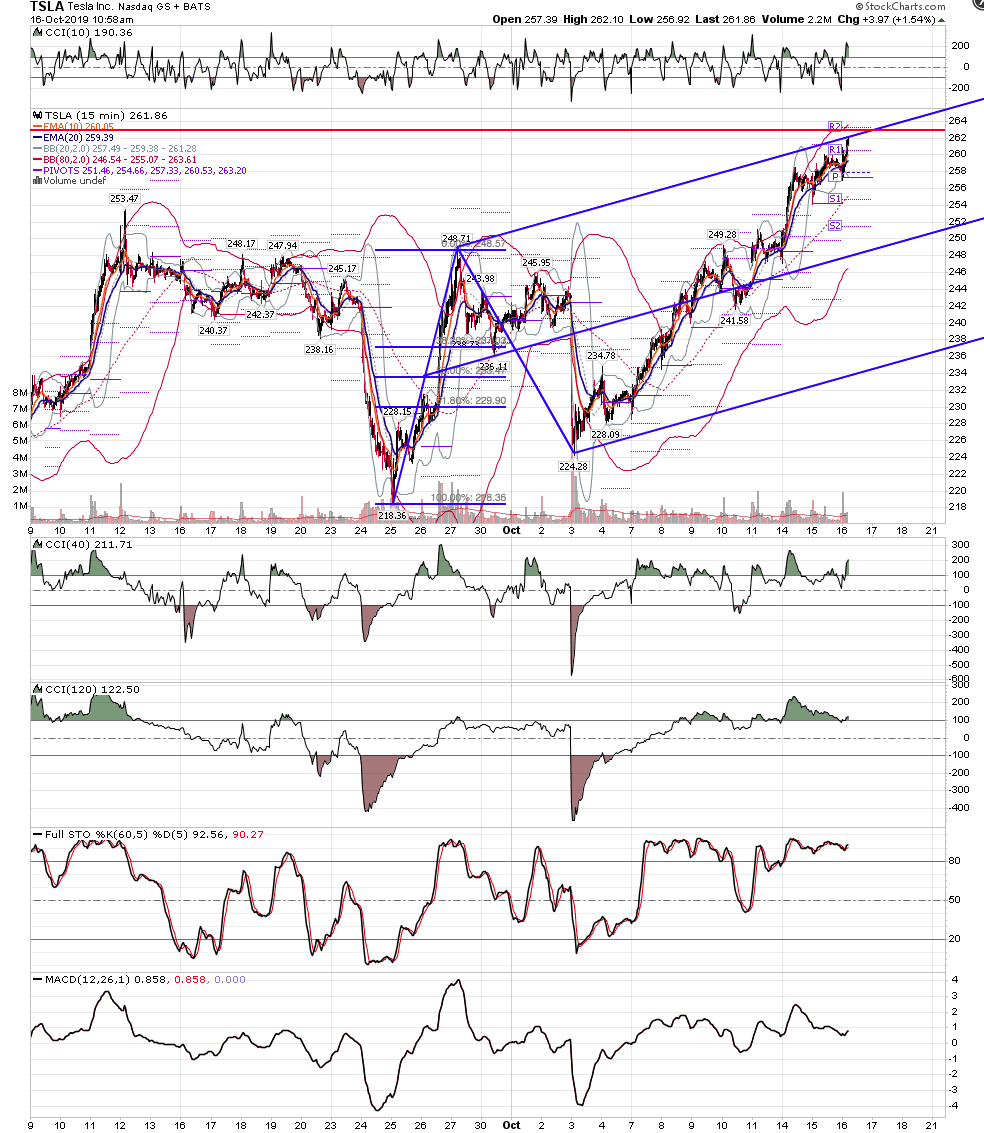
AL
albert
Rep: 99
Posts: 3,094
rat and Duane,
Excellent work guys. I will study the charts in more detail later.
Al
Excellent work guys. I will study the charts in more detail later.
Al
AL
albert
Rep: 99
Posts: 3,094
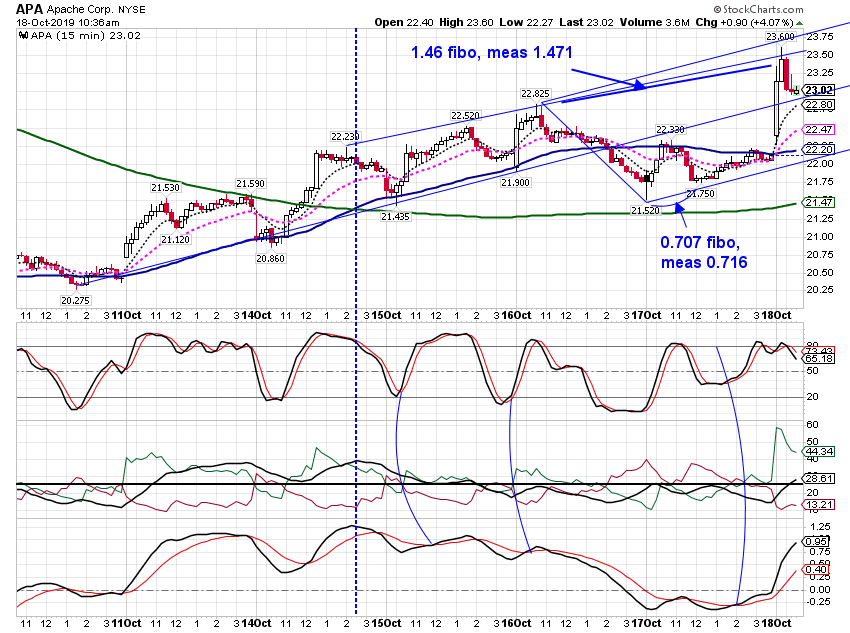
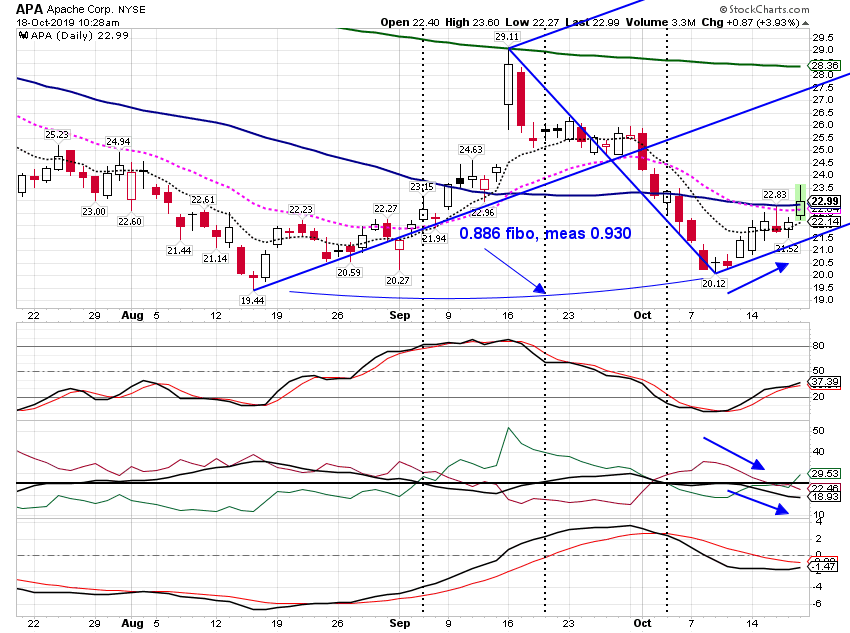
Paper trading. Made a bit on long calls in APA today. The thin blue lines on the 5 min chart are to show the approximate locations in the indicators of crossovers, either signal lines or +DI and -DI. Two blue arrows on the daily chart shows price rising and ADX and -DI falling.
Al :--))
Al :--))
Click image for original size
Click image for original size