MyPivots
Sign In
BR
Bruce Johnson
Rep: 130
Posts: 193
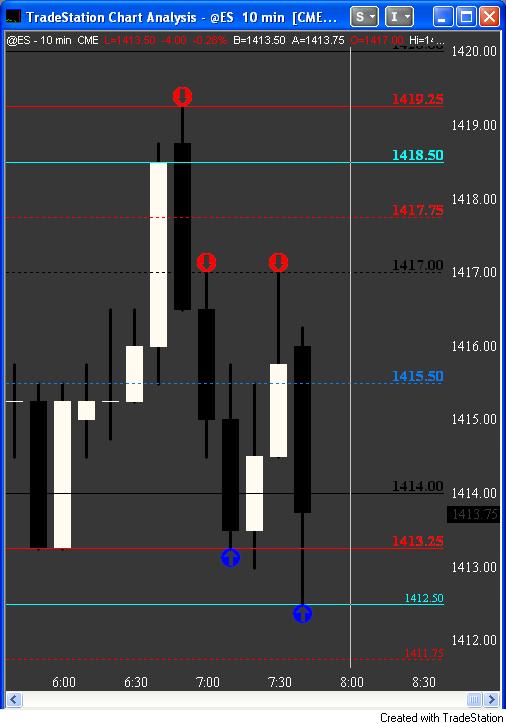
Example of using an established array of levels to trade ES.Cyan is the strongest trigger and blue being the weakest. 10 minute bars starting on any of the array levels to be interpreted as an entry to a long or a short.

Click image for original size
No Description Entered
BR
Bruce Johnson
Rep: 130
Posts: 193

Red arrows=shorts
Click image for original size
No Description Entered
BR
Bruce Johnson
Rep: 130
Posts: 193
Here is the ES using my levels (see ER2 posts)

Click image for original size
No Description Entered
logarithm
BR
Bruce Johnson
Rep: 130
Posts: 193
sorry wrong chart above this is the ES using levels logarithm

Click image for original size
No Description Entered
BR
Bruce Johnson
Rep: 130
Posts: 193

Levels on ES
Click image for original size
No Description Entered
RE
redsixspeed
Rep: 4,111
Posts: 1,711
Bruce: Thanks for the charts. The short @ 1450.50 was a smart entry IMHO.
Do you think the FOMC helped these shorts continue down?

Ben
RE
redsixspeed
Rep: 4,111
Posts: 1,711
sorry 1415.50
BR
BruceM
Rep: 216,211
Posts: 19,895
are you going to explain how these are derived or should we start "cracking the code" ourselves?
I'm a big fan of explainations in posts but whatever works for you is good....perhaps we can start a number service with these levels...
BR
Bruce Johnson
Rep: 130
Posts: 193
Array is a proprietary system and that is all I am going to post. I indicated to the vendor that I wouldn't put it in the wind.

Click link to access uploaded file:
SNP_05_22_2008.pdf
BR
Bruce Johnson
Rep: 130
Posts: 193
how do you upload a pdf file?
DA
day trading
Rep: 39,586
Posts: 6,369
quote:
Originally posted by Bruce Johnson

how do you upload a pdf file?


You had a comma in the file name which was causing problems. I fixed it.
NK
nkhoi
Rep: 204
Posts: 94
why subscribe to some number guru when you can do it yourself? here is how snp500 trader calculates his pivots