Kool's Tools - Putting it all together
Monthly Cycles
I will attempt to show how I use price projection and cycles to decipher the market. I thought it would be fun to look at the longer term, so here's the monthly chart. When looking at 'longer terms' of course there is always more room for error, but my purpose here is not to give a strict forecast, but to show how using these tools, it's been a long time since I have been truly surprised by market action.

I will attempt to show how I use price projection and cycles to decipher the market. I thought it would be fun to look at the longer term, so here's the monthly chart. When looking at 'longer terms' of course there is always more room for error, but my purpose here is not to give a strict forecast, but to show how using these tools, it's been a long time since I have been truly surprised by market action.
This is the S&P cash chart, because my chart service hasn't updated their monthly ES yet, but all values are the ES values. After we corrected off of the Oct bull market high at 1586.50 the next good low was B at 1406.25. This gives a price projection of 1114.61 and I immediately told my business associate that this is where we are going unless we quickly surpass the 1586 high. It was regarded as heresy of course ... until Oct 3 or so when we knifed through it. Cycle-wise I told them a high to the next possible high showed a low of significance due in March. As you can see it came to pass. Since at 1255, the number I gave them hit almost dead nuts and we now flirted with the 20% bear market line, they were skeptical, but they weren't laughing anymore! (The actual March low, not shown was 1253.) In the interim of course we made the C high at 1527.00 and D low at (Jan) 1255.50. This now gave a price projection of 816.25, They didn't buy it, but they did pay attention! After the May rally up to 1441.00 (E), I was able to state my best case scenario for the likely end, of at least this phase, of the bear market. Counting the cycle from A to E gives Jan 09. (A view I still hold today.) Incidentally cycle C to E correctly showed a low of significance in Nov, not necessarily Oct as conventional analysts were calling for. Remember the price projection of 816.25? It was hit and the market turned on a dime this week!
Weekly Cycles
So what's likely next? Take this with a grain of salt, because I'm not always right! Remember I never originally thought we would go below 1100! Note the May high (E) at 1441.00 and July low (F) at 1200.75. This projects to 812.03. The last couple of weeks we have seen the market in a large up and down consolidation, every so often making a marginal new low. First it was 837, then after a huge rally I think we hit 825 a few handles lower and another strong rebound. Then we came back this Thursday to hit the magic 816.25 before once again rebounding strongly! So one more marginal low around 812 is not out of the question. And a major low in JAN 2009 seems at least possible! (By the way, now I have V.P.'s at work pumping me for my 'outlook' every day! I find that incredibly amusing!) Now lets see what the weekly chart may tell us.

The weekly chart above clearly shows the same scenario as the monthly. Bar number 66 or 33 weeks from the May high should be a significant low. This again would call for the mid Jan time frame. (Special note: Since you don't know if a high or low was made at the beginning of the week or end I always cut myself one bar of slack. In other words I'm looking for a low bar 66 - 68, in real life.) Looking for a smaller time frame cycle, one might choose from B to the Aug high C at 1313.50. AND GUESS WHAT? That would have called for a good low this last week. But caution is advised here because look at the next bar (D). It clearly seems to overlap bar C almost identically and from this perspective. Which is why I wanted to show this chart! This might be a case where we would want to add one bar and use bar D INSTEAD! That would call for a low not this coming week, but the next one. And if that were to occur, would we expect another 'marginal' new low? Maybe 812 if not hit Mon? It's certainly possible. I don't have the answer. No holy grail here, just a set of tools to use in conjunction with your other existing methods for a rough roadmap so there's no big surprises.
So what's likely next? Take this with a grain of salt, because I'm not always right! Remember I never originally thought we would go below 1100! Note the May high (E) at 1441.00 and July low (F) at 1200.75. This projects to 812.03. The last couple of weeks we have seen the market in a large up and down consolidation, every so often making a marginal new low. First it was 837, then after a huge rally I think we hit 825 a few handles lower and another strong rebound. Then we came back this Thursday to hit the magic 816.25 before once again rebounding strongly! So one more marginal low around 812 is not out of the question. And a major low in JAN 2009 seems at least possible! (By the way, now I have V.P.'s at work pumping me for my 'outlook' every day! I find that incredibly amusing!) Now lets see what the weekly chart may tell us.
The weekly chart above clearly shows the same scenario as the monthly. Bar number 66 or 33 weeks from the May high should be a significant low. This again would call for the mid Jan time frame. (Special note: Since you don't know if a high or low was made at the beginning of the week or end I always cut myself one bar of slack. In other words I'm looking for a low bar 66 - 68, in real life.) Looking for a smaller time frame cycle, one might choose from B to the Aug high C at 1313.50. AND GUESS WHAT? That would have called for a good low this last week. But caution is advised here because look at the next bar (D). It clearly seems to overlap bar C almost identically and from this perspective. Which is why I wanted to show this chart! This might be a case where we would want to add one bar and use bar D INSTEAD! That would call for a low not this coming week, but the next one. And if that were to occur, would we expect another 'marginal' new low? Maybe 812 if not hit Mon? It's certainly possible. I don't have the answer. No holy grail here, just a set of tools to use in conjunction with your other existing methods for a rough roadmap so there's no big surprises.
Daily Cycles
Now let's look at some interesting things from the daily chart.
Now let's look at some interesting things from the daily chart.
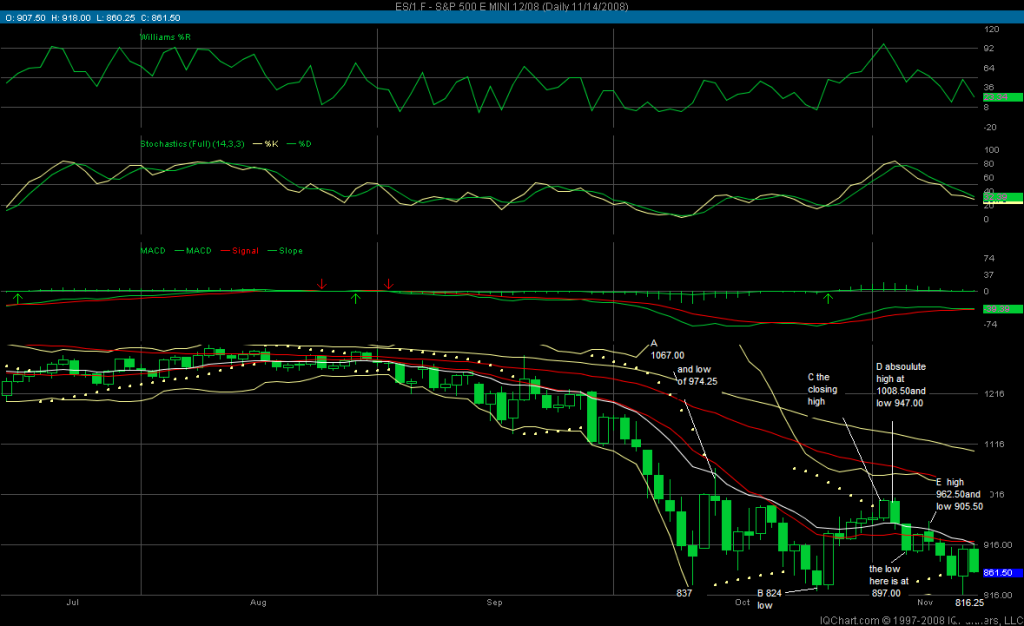
Earlier I gave several downside numbers to watch for. They included 824 and 812-13. Look at bar A. The next bar severely overlaps it so it looked to me like bar A is a one bar projection. 1067-974.25 gives 824.19! That's how I knew it. Bar B was a dead nuts strike! From a cycle perspective, counting from bar A 5 bars to the closing high gave the exact day! Or should we have counted 6 bars? Notice how they overlap and it's even hard to tell which is the absolute high. Bar 5 is the closing high but the absolute high was bar 6. Cases like that you never really know for sure and consulting a smaller timeframe chart will usually clear up the mystery. Counting 5 hit the low dead nuts but counting 6 certainly gave a low also. It was the lone down day and from that low never closely approached again we steadily climbed upward to bar D the 1008.50 peak. Note how bar C and D THE SAME THING HAPPENS! (Sometimes i think the 'boyz' in the pits do that on purpose to hide their actions.) Anyway, so do we start a count at bar C or D (to bar F, the next good high)? I suggest being cognizant of both, of course. On a side note you've seen how I knew about 812-13 from the monthly chart. You've seen how I knew about 824 from the daily chart. Now look at bar F peak. the price projection given by this peak (962.50-905.50) is 813.03! Incredibly close to that monthly projection given from May to July! These little clues between different time frames and different times happen all the time and we would be wise to look out for them! Also note that a price projection from bar D (1008.50-947.00) gives the value of 847.50. That's why last week, when the market was around 936, I stated that this 850 level was critical for the bulls. By the way, should a GM bankruptcy cause another 'market crash' the monthly and daily chart have already shown you the worst case scenario. See if you can figure it out.(Hint: The bar after G on the monthly, or bar D and the next bars low on the daily... both give the same within 3 or 4 points!) Currently hourly charts project to 789-794 depending on which bar we use (unless 904.25 or 918 is touched again). After the low, Mon or Tues, we should begin getting upside projections.
Summary
Summary: My work is almost complete. I have tried to provide a set of tools to be added to your already existing arsenal to hopefully enhance your trading. Whether or not any of these numbers like 812-13 come to pass or not, I hope through price projections and the cycles you can leave with one key bit of knowledge. The markets may be driven by investors perceptions of how to interpret future earnings, news of the day, etc. but there is a mathematical structure in both price and time in how they reach the objectives of those perceptions. It's not 'random walk', baby, and I hope I've begun to show this! I don't pretend to know every facet of this strict mathematical construction and in fact I've only scratched the surface! I leave it up to others to expand on my work. At the very least, I hope that these new techniques will be of some small help. I have a little more help to give to my 'students' in the forum (actually friends) and then my work there will be finished also. Most are already making some amazing calls all on their own! GOOD TRADING ALL!
Summary: My work is almost complete. I have tried to provide a set of tools to be added to your already existing arsenal to hopefully enhance your trading. Whether or not any of these numbers like 812-13 come to pass or not, I hope through price projections and the cycles you can leave with one key bit of knowledge. The markets may be driven by investors perceptions of how to interpret future earnings, news of the day, etc. but there is a mathematical structure in both price and time in how they reach the objectives of those perceptions. It's not 'random walk', baby, and I hope I've begun to show this! I don't pretend to know every facet of this strict mathematical construction and in fact I've only scratched the surface! I leave it up to others to expand on my work. At the very least, I hope that these new techniques will be of some small help. I have a little more help to give to my 'students' in the forum (actually friends) and then my work there will be finished also. Most are already making some amazing calls all on their own! GOOD TRADING ALL!
Emini Day Trading /
Daily Notes /
Forecast /
Economic Events /
Search /
Terms and Conditions /
Disclaimer /
Books /
Online Books /
Site Map /
Contact /
Privacy Policy /
Links /
About /
Day Trading Forum /
Investment Calculators /
Pivot Point Calculator /
Market Profile Generator /
Fibonacci Calculator /
Mailing List /
Advertise Here /
Articles /
Financial Terms /
Brokers /
Software /
Holidays /
Stock Split Calendar /
Mortgage Calculator /
Donate
Copyright © 2004-2023, MyPivots. All rights reserved.
Copyright © 2004-2023, MyPivots. All rights reserved.