MyPivots
Sign In
MR
mreiserer
Rep: 110
Posts: 2,220
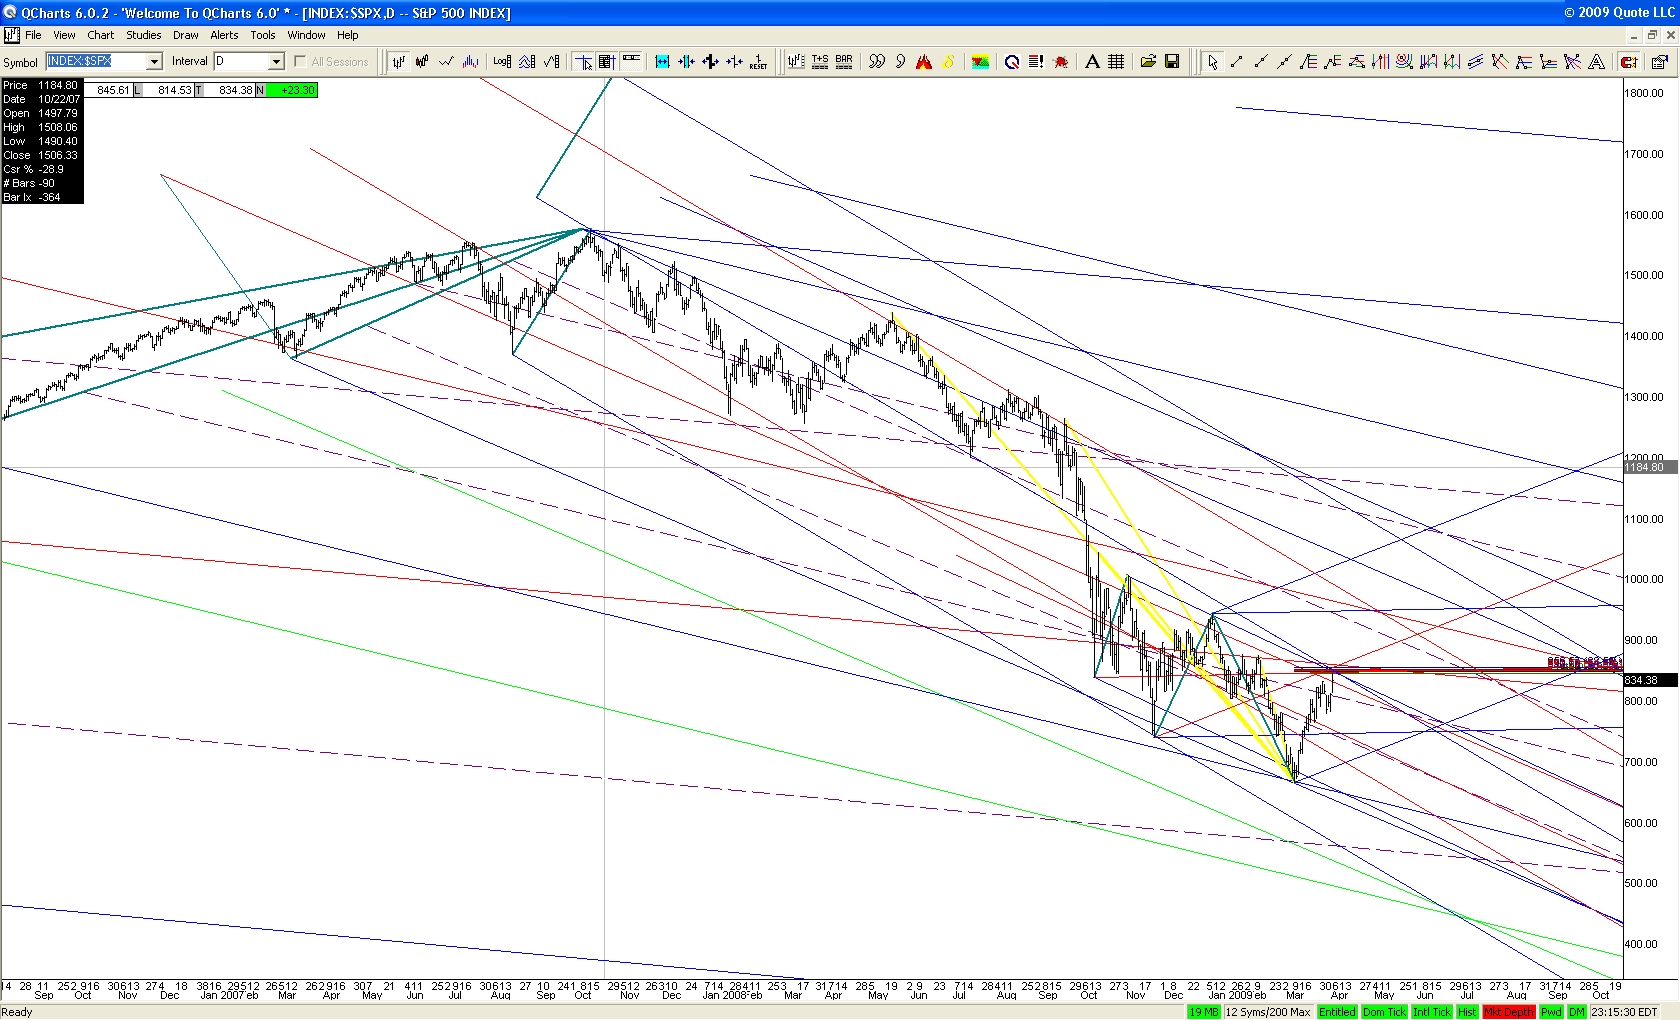
I would certainly expect more of a bounce here before this wave 3 continues, but this thing really looks like it is in trouble.


Click image for original size
No Description Entered
BB
BBJ
Rep: 100
Posts: 129
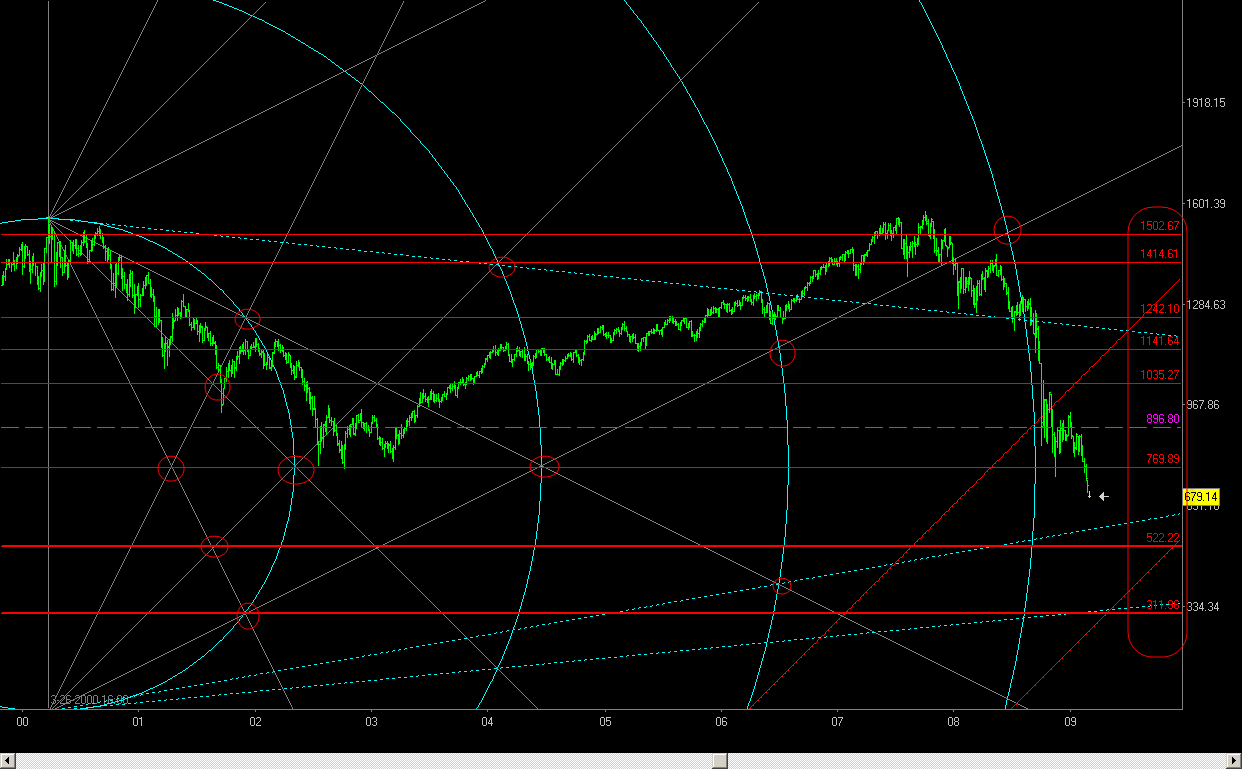
Posting this Weekly SPX chart with alternative method because the 522 level is next level down on this chart. Horizontal red lines did a good job at defining SPX levels.
These levels were known once the March 26 2000 high was made.


Click image for original size
No Description Entered
MR
mreiserer
Rep: 110
Posts: 2,220
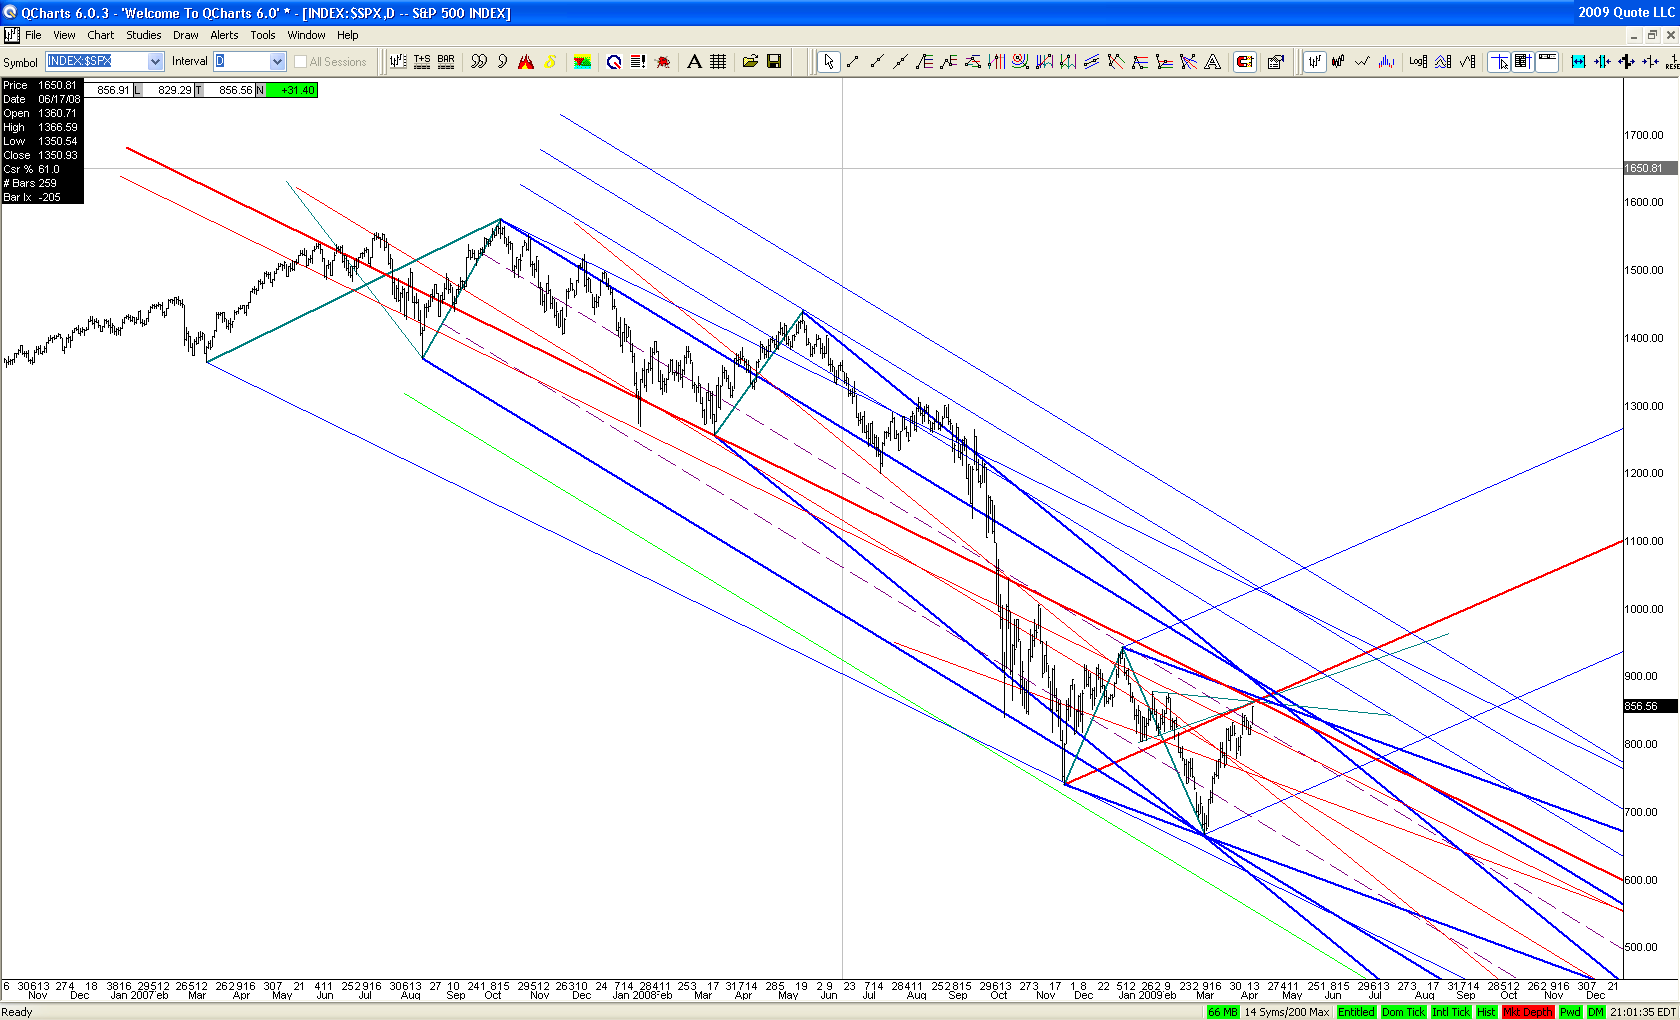
No fibs drawn, just lines.There are some keyspots right above here.
Jim mentions the 883. I see the 873-75 as the next key spot and then a bit higher around the 890. This is also timefactor dependend.
I boldened my key lines. If someone has other key lines that I don't have please post!!!


Click image for original size
No Description Entered