12-19-08 charts

CST... I knew there was a simple explanation.
Thanks for your response and the link.
Thanks for your response and the link.
I started using fibobands after I read a conversation between you and pt_emini. It sounded interesting, so I created an NT indicator using the ATR, EMA and fibo numbers 1.618, 2.618 and 4.236. So far, I'm intriqued. I vary between a length of 34 and 55 with varying degrees of accuracy. 21 works well sometimes too. Maybe the best length is proportional to the strength of the trend? Today I took several trades using the bands to set the stop and target with a good deal of success. Works well for a quick point or two.
Haven't found much about them with the exception of an indicator being sold for $195 somewhere. How are you using them?
Haven't found much about them with the exception of an indicator being sold for $195 somewhere. How are you using them?
Click image for original size
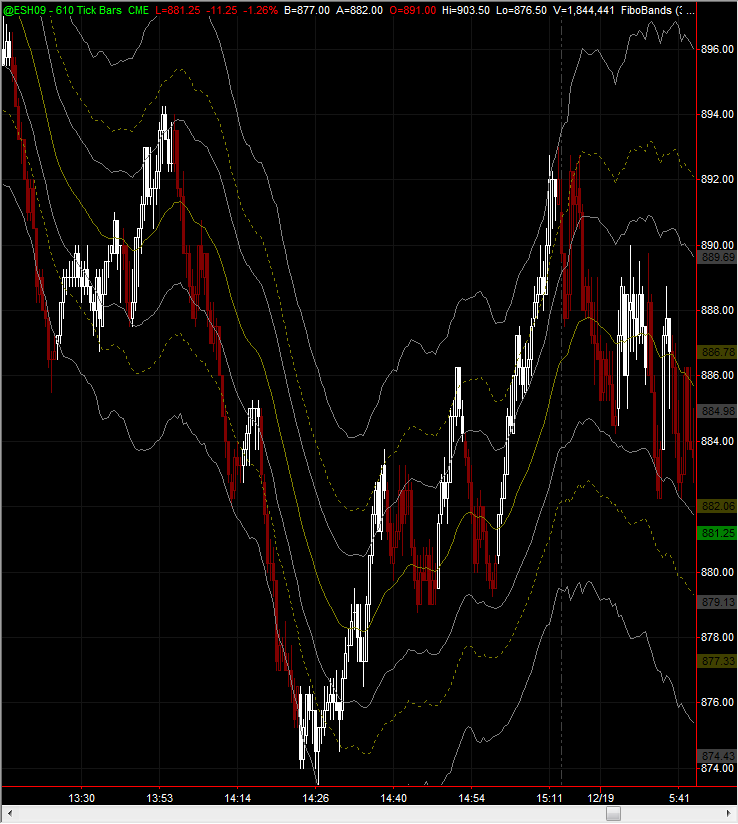
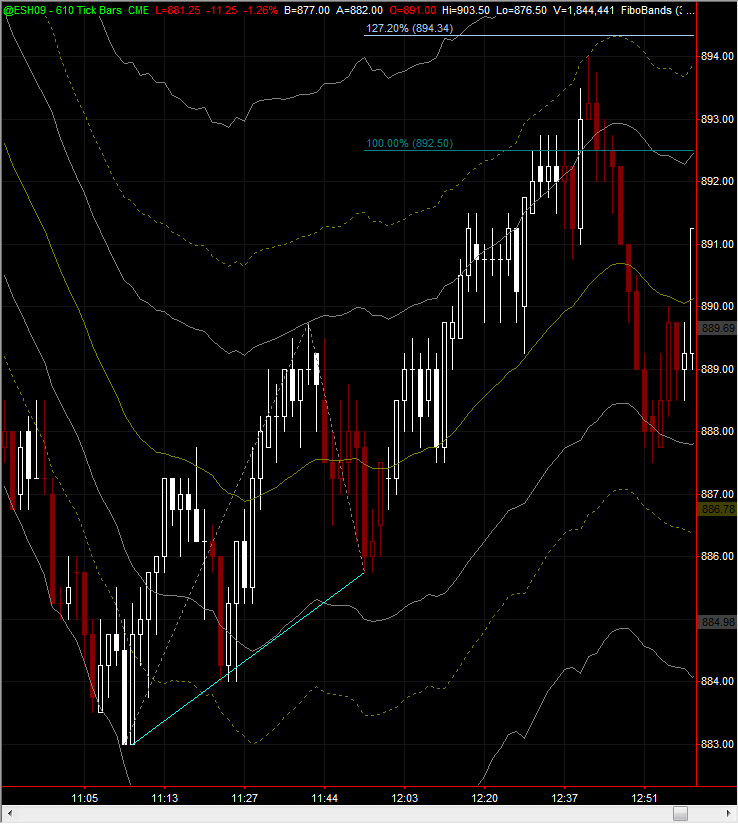
culsu you will find that once they have gone to an extreme they have a tendancy to move back across the bands to the other side as per post. That is they go from an extreme to an extreme or the 4.236's. I have found that the best ABC's are the ones that cross over the MA line to make B, then cross back down the MA line to make C. They have a tendancy to use the MA (solid gold line) as support/resistance on the way to targets.
Click image for original size
Click image for original size

Click image for original size
Click image for original size
Click image for original size
Click image for original size
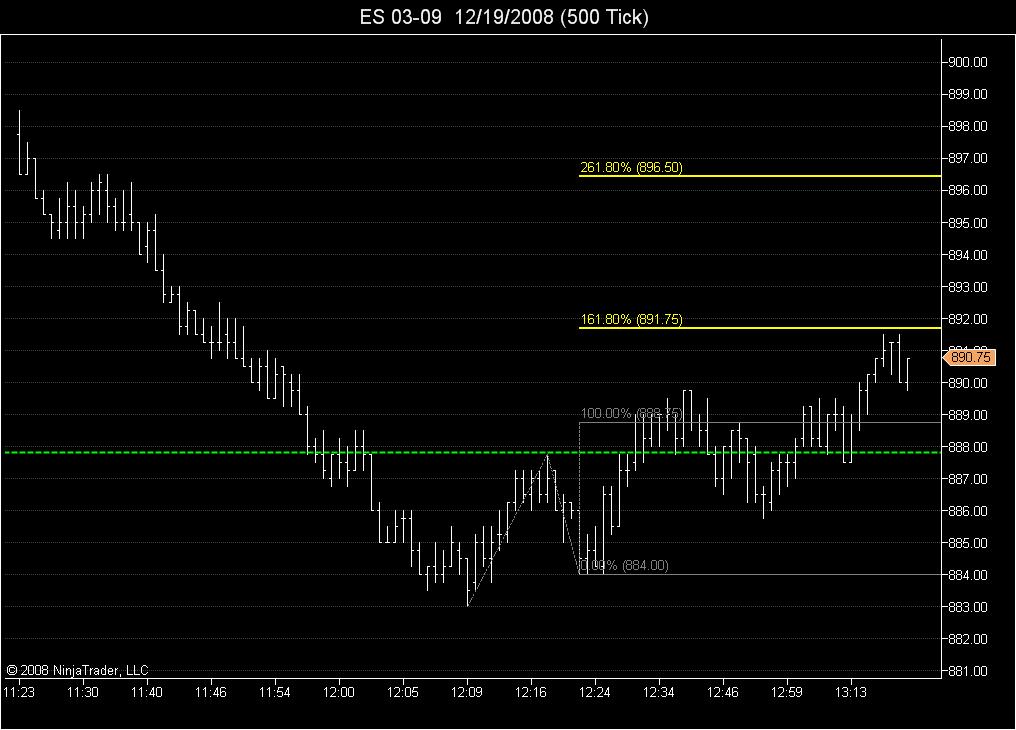
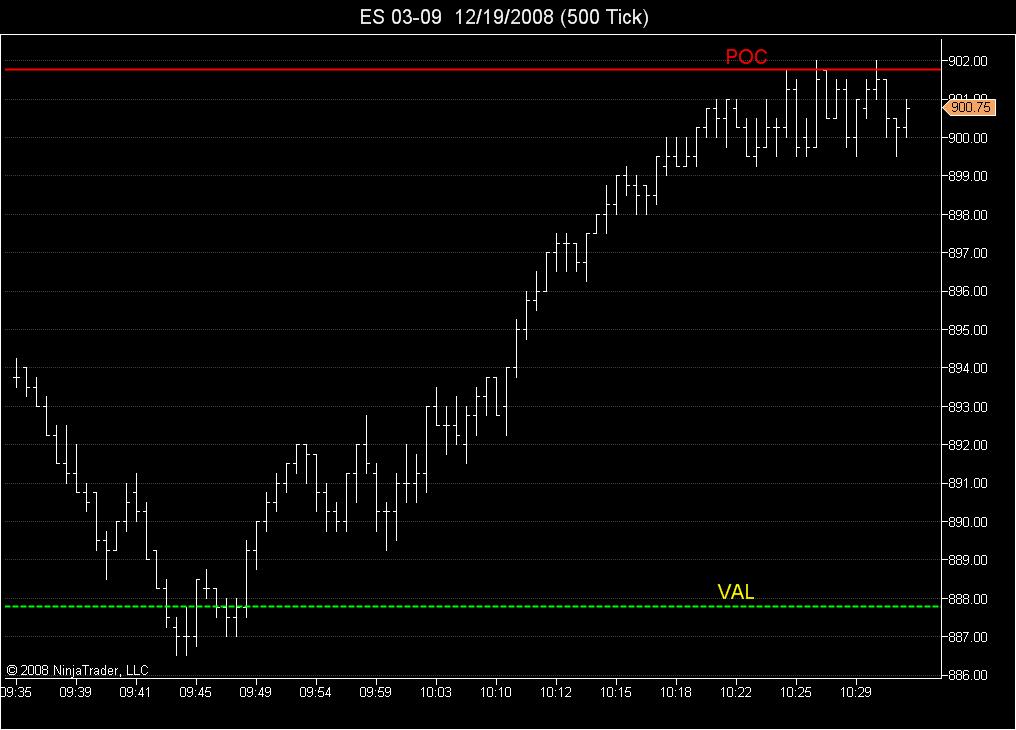
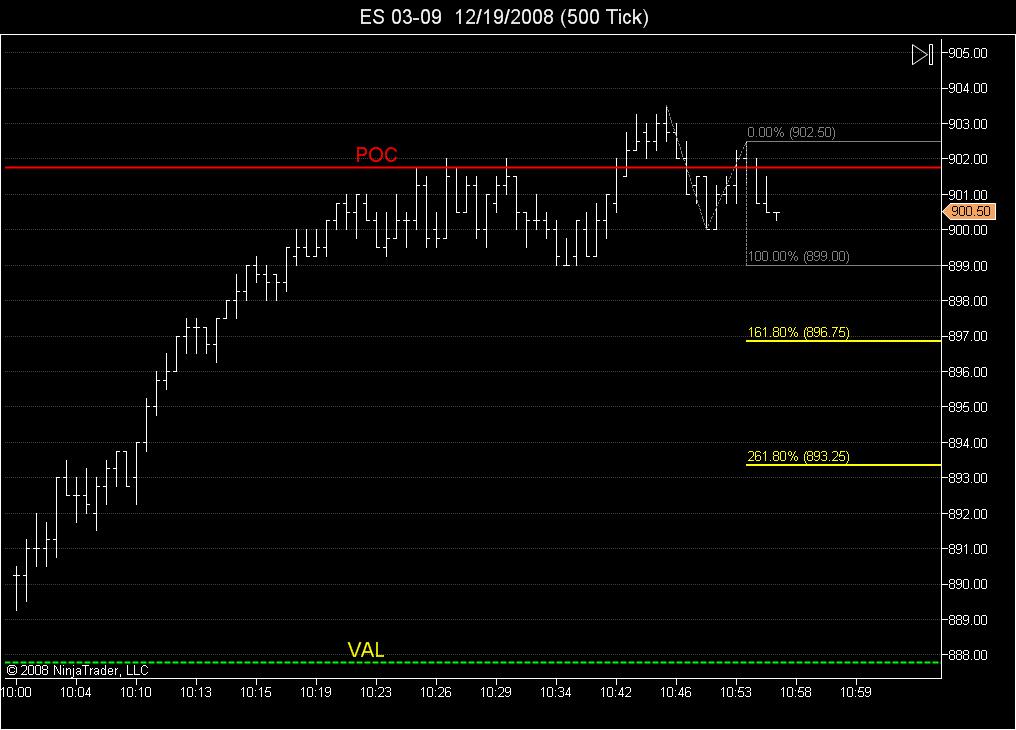
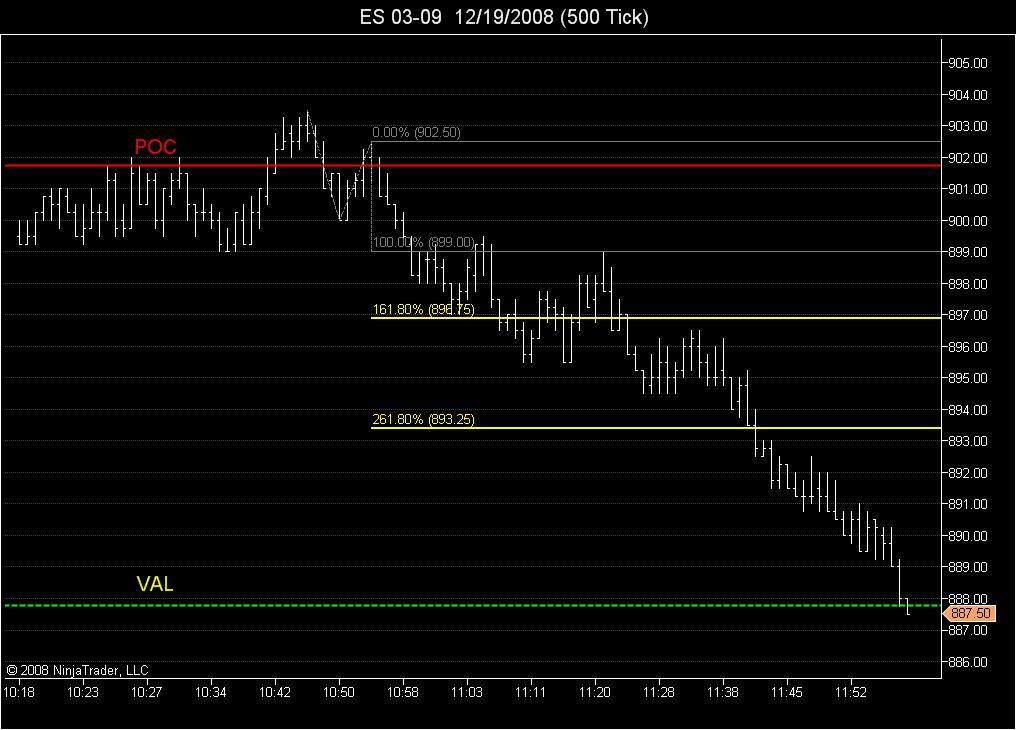
 chart courtesy of MUP (with my 877 call drawn in!)

GREAT WORK KOOLIO! Are you pointing out the volume increase on the your 5th wave with the red arrow?
PT thanks for posting your charts! I would like to claim honors for being the smart feller who bought @ VAL reversed @ POC and rode it back down to VAL again...unfortunately I can't. It was probably somebody like Bruce who hogs all the good trades!LOL!
quote:
Originally posted by VOwater
here is a look at what the upside might have in store
Click image for original size

I don't think the upside will occur. As they say in Wall Street, "As January goes, the year goes".
Beginning of 2008 started with 1478+ in the S&P. Now, it is almost half. I'd think it will end down trend to the end of the year. Your projection to the end of the year close from 706 to 752 is very possible. 739 is half of where the year started.
January? Who knows? It is a good watch for the expectancy for the rest of the year.
Emini Day Trading /
Daily Notes /
Forecast /
Economic Events /
Search /
Terms and Conditions /
Disclaimer /
Books /
Online Books /
Site Map /
Contact /
Privacy Policy /
Links /
About /
Day Trading Forum /
Investment Calculators /
Pivot Point Calculator /
Market Profile Generator /
Fibonacci Calculator /
Mailing List /
Advertise Here /
Articles /
Financial Terms /
Brokers /
Software /
Holidays /
Stock Split Calendar /
Mortgage Calculator /
Donate
Copyright © 2004-2023, MyPivots. All rights reserved.
Copyright © 2004-2023, MyPivots. All rights reserved.