CHARTS 1-16-09
Click image for original size
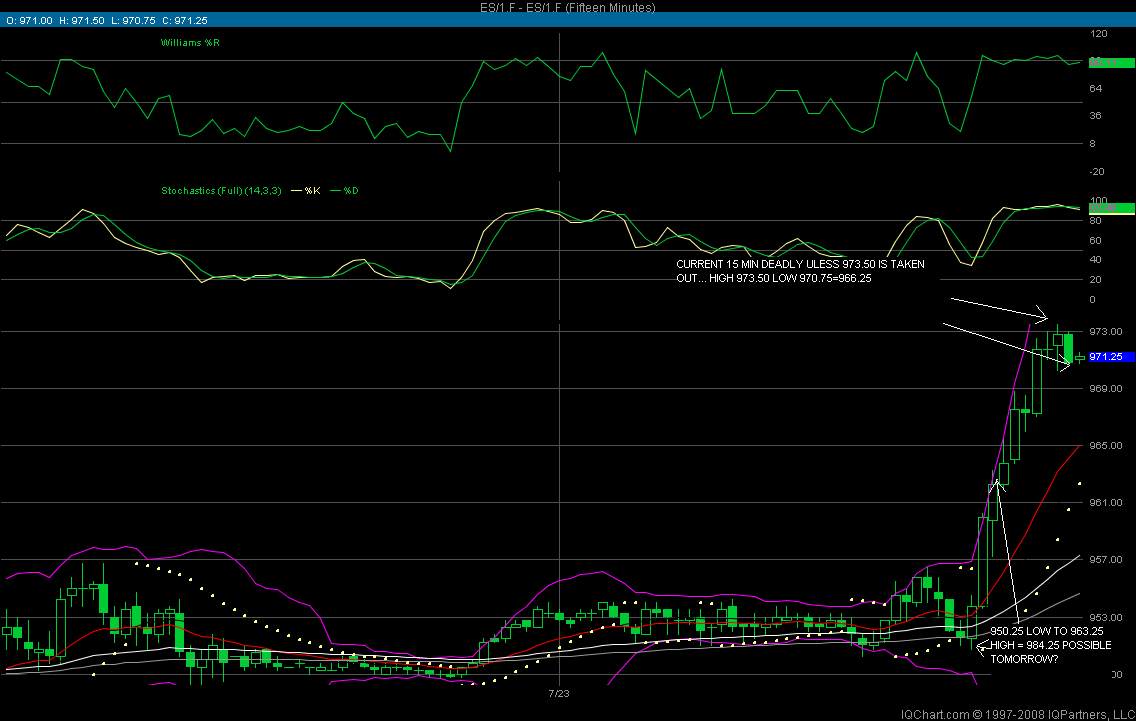
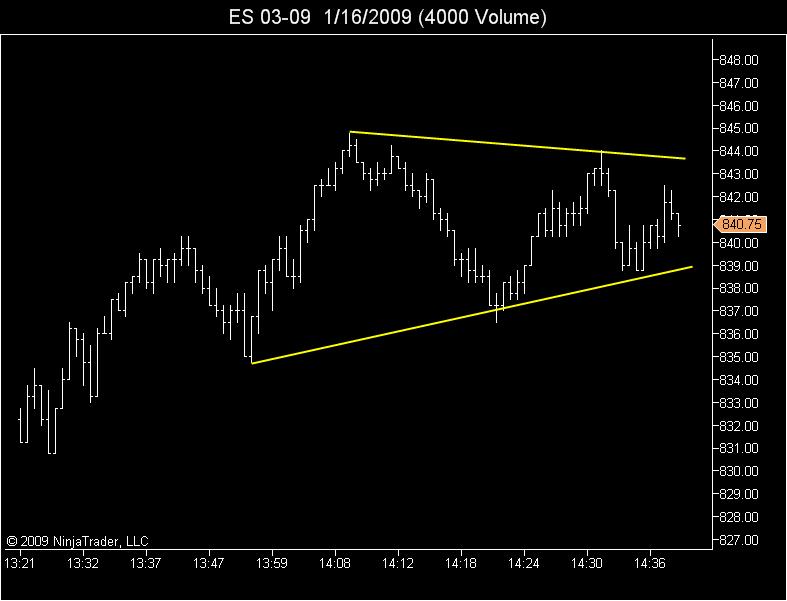
here is the resolution to this pattern from yesterday's post.
Click image for original size
Click image for original size
Click image for original size
Click image for original size
Click image for original size

Click image for original size

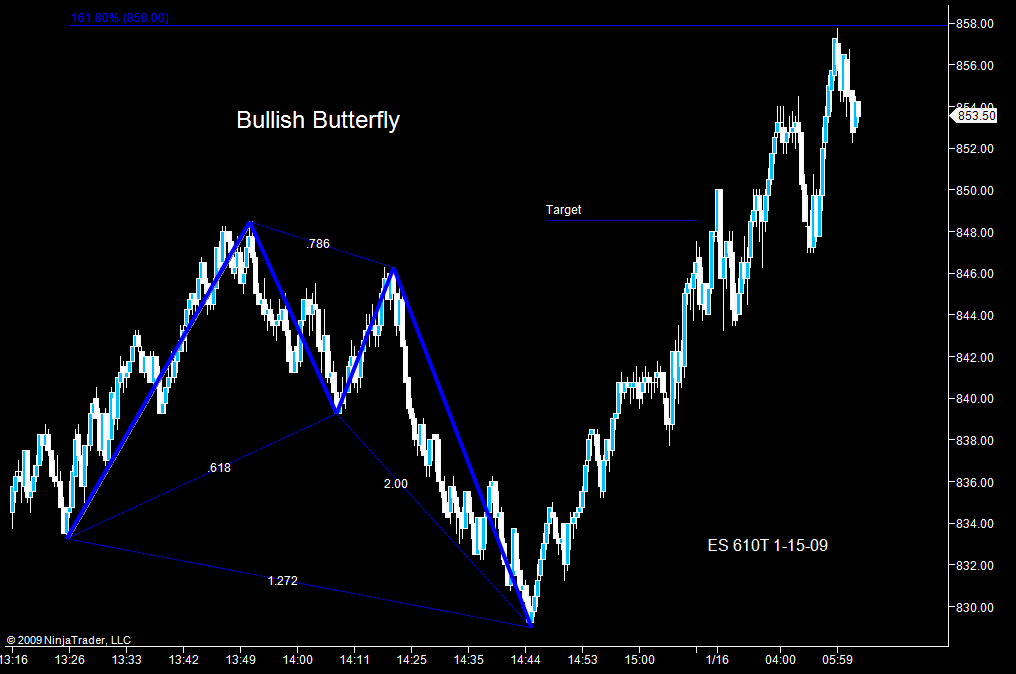
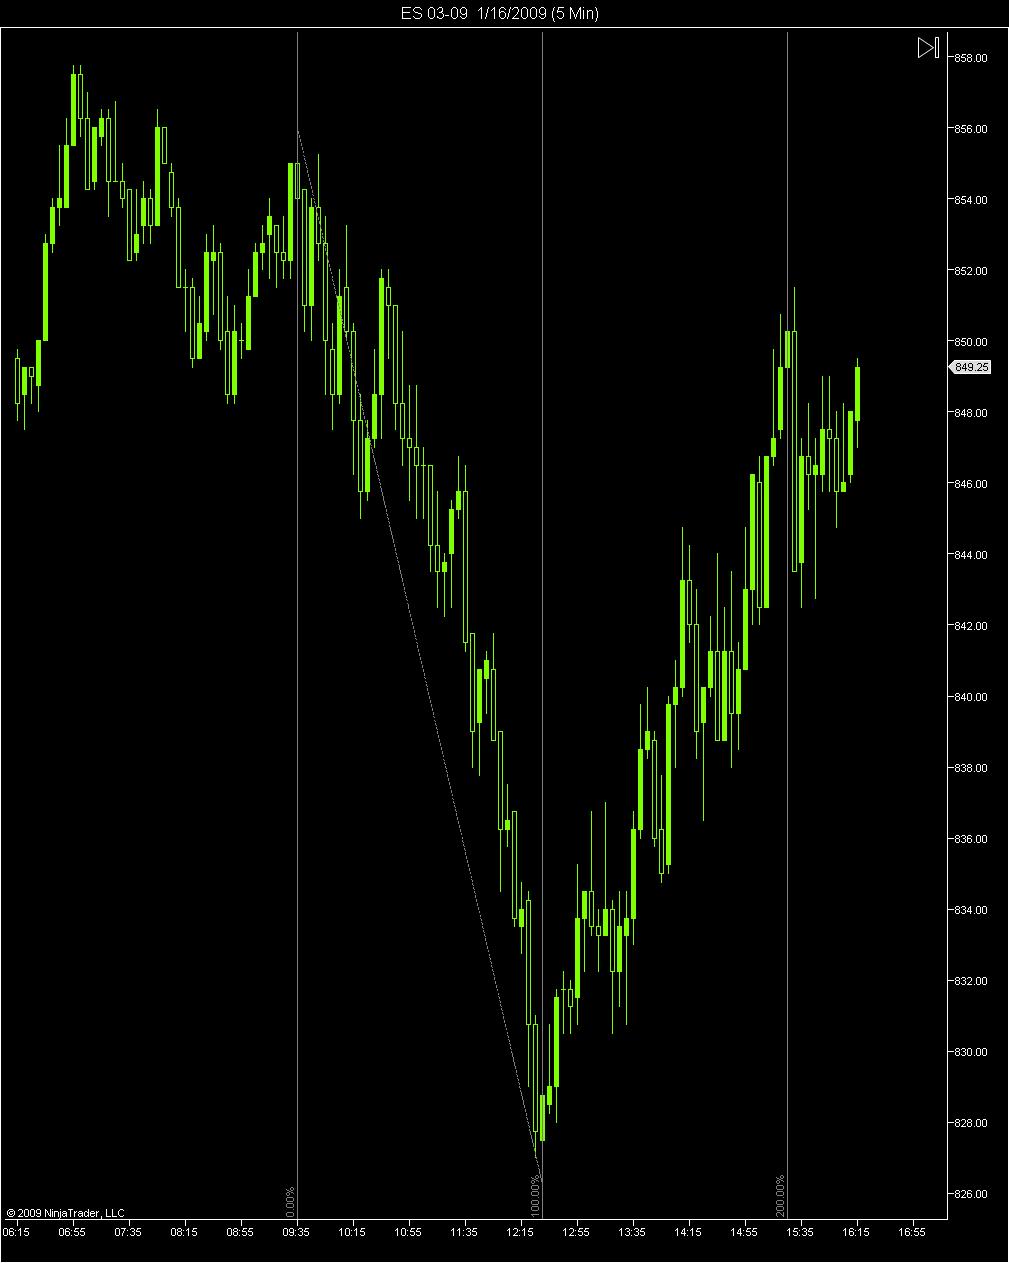
To prove KB's tool for time. Peak reached 5 mins after projected time. on 5 min chart.
Thanks KB for your trading article on time. Still studying and backtesting your Price tools and VO's concepts of 12345 and ABC.
Thanks KB for your trading article on time. Still studying and backtesting your Price tools and VO's concepts of 12345 and ABC.
Click image for original size
excellant, friend! and you will find in your studies that 1.618 tends to be another peak... thats why i use equidistant to get the low! keep up the good work!
With respect to this concept of a bullish divergence in the energy sector, I note the USO ETF also made a higher low this week.
KB, According to projections 874.25 the next peak. Dunno if I am correct with your calculations.
Equidistant to get the low? Means we we extend low time by 2?
Equidistant to get the low? Means we we extend low time by 2?
quote:for example: peak to peak equal ten bars, then ten bars later is the low...thats what i mean by equidistant.
Originally posted by lordalfa
KB, According to projections 874.25 the next peak. Dunno if I am correct with your calculations.
Equidistant to get the low? Means we we extend low time by 2?
quote:for example: peak to peak equal ten bars, then ten bars later is the low...thats what i mean by equidistant. Using the above chart, its 33 bars from peak to peak so one would expect a low at bar #66(off by one bar in the above example!). SINCE COUNTING BARS TAKES SO LONG I USE TIME INSTEAD IN MY REALTIME TRADING... works great!
Originally posted by koolblue
[quote]Originally posted by lordalfa
KB, According to projections 874.25 the next peak. Dunno if I am correct with your calculations.
Equidistant to get the low? Means we we extend low time by 2?
Emini Day Trading /
Daily Notes /
Forecast /
Economic Events /
Search /
Terms and Conditions /
Disclaimer /
Books /
Online Books /
Site Map /
Contact /
Privacy Policy /
Links /
About /
Day Trading Forum /
Investment Calculators /
Pivot Point Calculator /
Market Profile Generator /
Fibonacci Calculator /
Mailing List /
Advertise Here /
Articles /
Financial Terms /
Brokers /
Software /
Holidays /
Stock Split Calendar /
Mortgage Calculator /
Donate
Copyright © 2004-2023, MyPivots. All rights reserved.
Copyright © 2004-2023, MyPivots. All rights reserved.