Weekly Chart Summary 2-14-09
Click image for original size

Click image for original size
Click image for original size
Click image for original size
Click image for original size

Click image for original size
Click image for original size
Click image for original size

Click image for original size
Click image for original size
Click image for original size
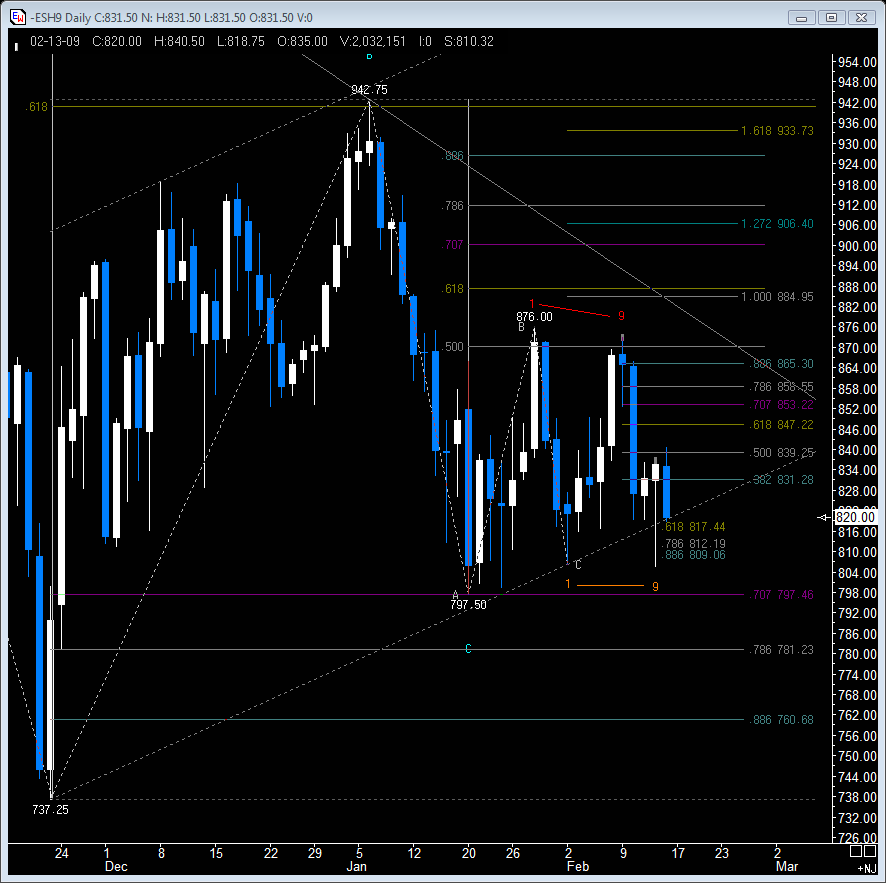
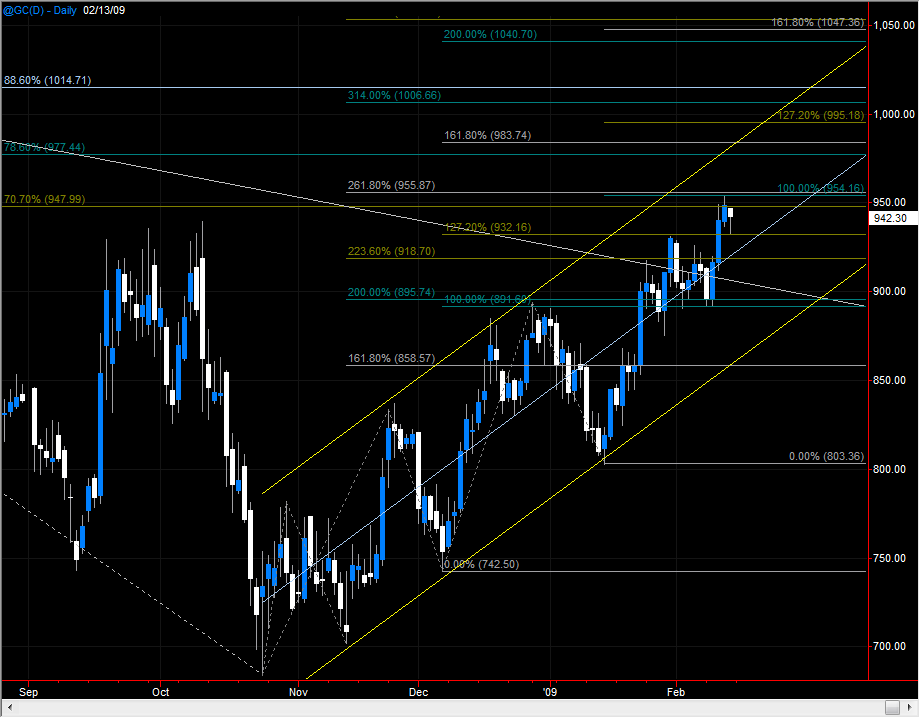
...I find IT VERY INTERESTING THAT WE ARE AT THE BOTTOM OF THIS WELL ESTABLISHED TREND LINE!
7 Wave Trend Killer
Click image for original size

Click image for original size
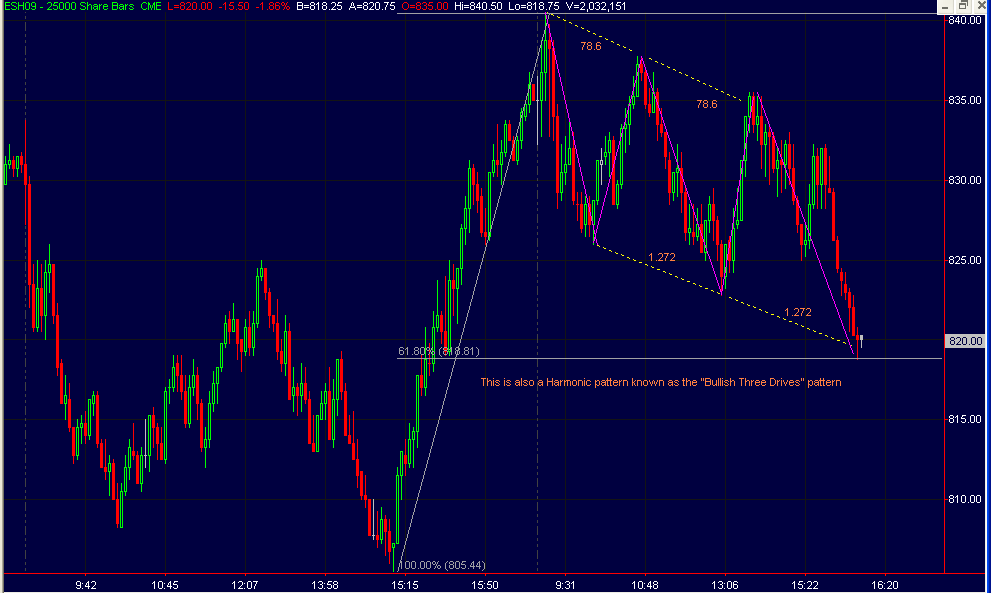
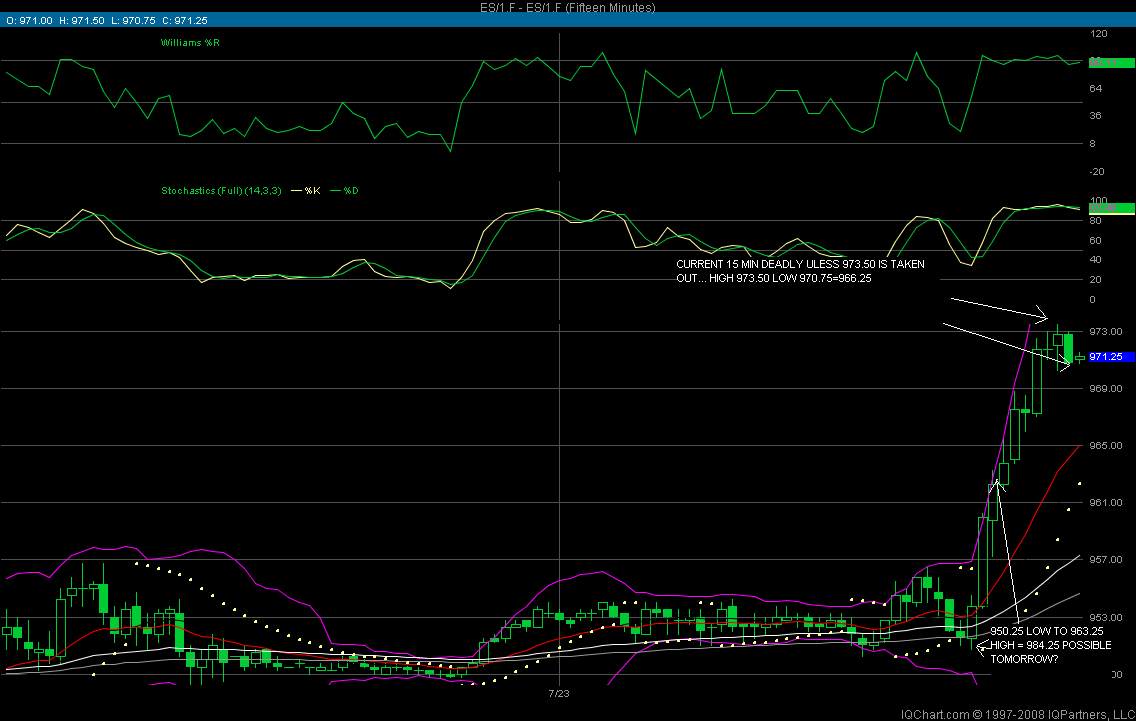
As an addition my 15 minute chart analysis (and a test posting a chart)
Click image for original size
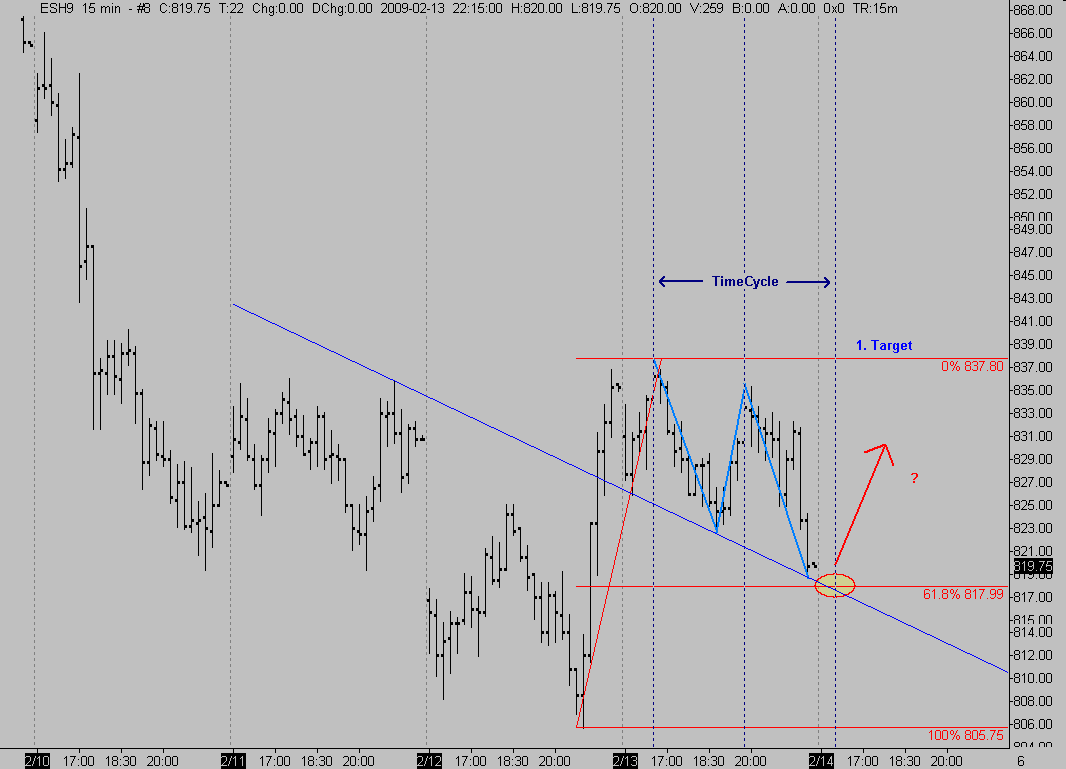
Click image for original size

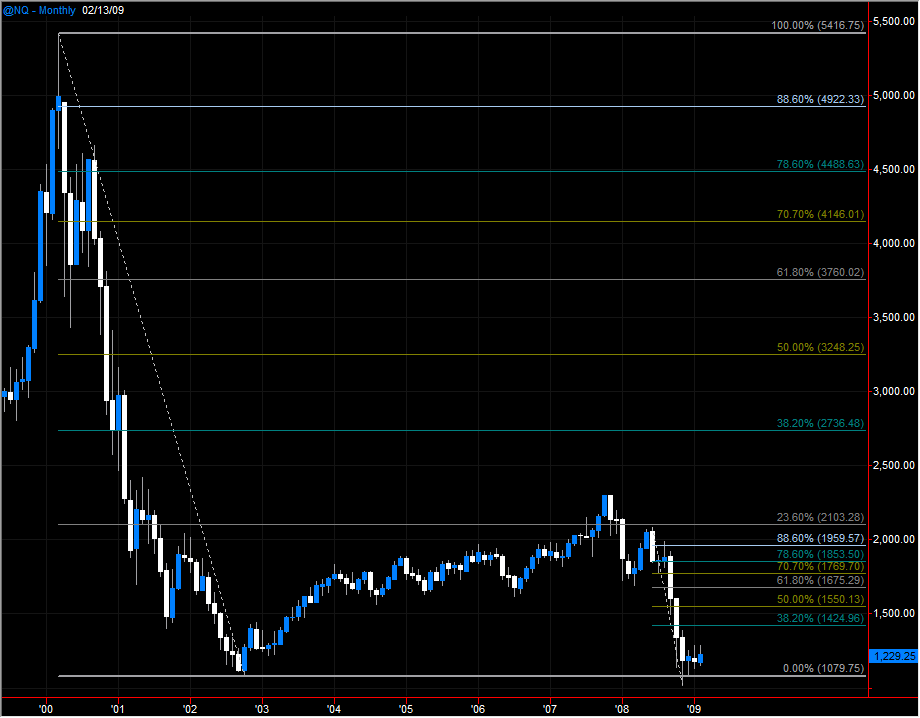
VO that charts looks scary but I have been getting almost the same analysis. I think we will see the low 600s for sure.
I still thought we would have bounced to that 870-906 area already and that has me worried for the bulls. As Kool would say the market is talk to us and if we should be bouncing and it is not then we will be in a world of pain when we are projecting a downside. Now I am thinking we will buss then 600 on the downside but who knows I have seen stranger things in this crazy market.
I still thought we would have bounced to that 870-906 area already and that has me worried for the bulls. As Kool would say the market is talk to us and if we should be bouncing and it is not then we will be in a world of pain when we are projecting a downside. Now I am thinking we will buss then 600 on the downside but who knows I have seen stranger things in this crazy market.
Palmer we are going to break our lows...the question is when and by how much - not if. We might bounce and form an A-B-C corrective wave as shown above. The retracements are possible targets if that takes place. One thing that is fairly easy to notice is how symmetrical the wave structure has been so far. Waves 2 and 4 (so far) are almost identical. Wave 3 was basically 2x that of 1. Wave 5 was simply copied from wave 1 to see where it would project. Its not a coincidence that it ends roughly at the 261.8% of the big ABC. We could go lower or stop short of that target - time will tell. I do know this much...when we end wave 5 its going to be a hell of a good time to be long.
I agree with that end of 5 wave count- should be somewhere around that 600 level and should be a good risk reward to be long.
Totally agree
Totally agree
If it weren't for corrective waves the wave count would be a breeze...those complex corrections are a sob to figure out! I gave up trying to decipher the zigzags, flats, triangles, combo's ect. its not worth the headache. All I know is that when waves overlap we are in a corrective process.
Emini Day Trading /
Daily Notes /
Forecast /
Economic Events /
Search /
Terms and Conditions /
Disclaimer /
Books /
Online Books /
Site Map /
Contact /
Privacy Policy /
Links /
About /
Day Trading Forum /
Investment Calculators /
Pivot Point Calculator /
Market Profile Generator /
Fibonacci Calculator /
Mailing List /
Advertise Here /
Articles /
Financial Terms /
Brokers /
Software /
Holidays /
Stock Split Calendar /
Mortgage Calculator /
Donate
Copyright © 2004-2023, MyPivots. All rights reserved.
Copyright © 2004-2023, MyPivots. All rights reserved.