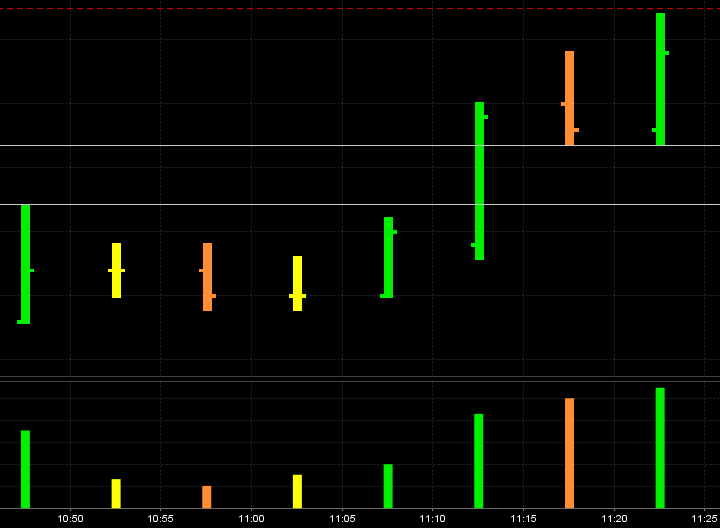
Price bar overlap
I'm planning to explain this more soon but this is a start. Notice how we have what I call an "air pocket" in between the high of the first green bar from the left and the low of the last green bar on the right.
These are 5 minute bars and I will include the context chart
This thread will attempt to expand on the concept of "mini singles" that we have covered before from the one minute chart. I have snapped a horizontal line to represent this "Pocket"
These are 5 minute bars and I will include the context chart
This thread will attempt to expand on the concept of "mini singles" that we have covered before from the one minute chart. I have snapped a horizontal line to represent this "Pocket"
Click image for original size
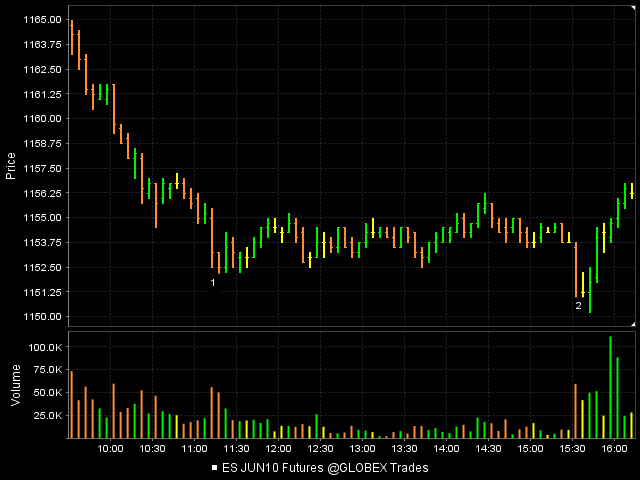
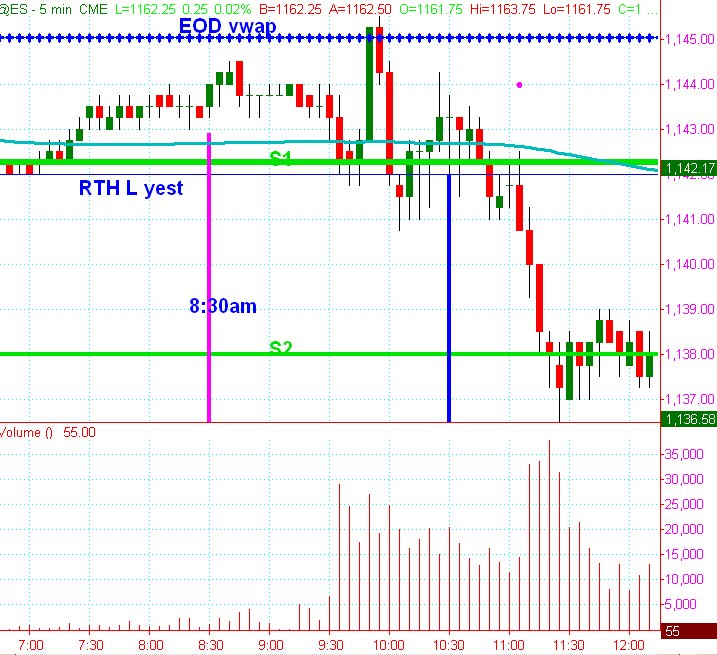
Here is the 5 minute and one minute from Friday. There was a nice morning downtrend but it was very orderly, meaning that price overlapped on the one minute time frame and didn't exhibit any good volume attractors until 11:15. This is what will seperate the good and bad trades. We want the volume there.
I have marked the two best trades at points "1" and "2". Note the volume. Note the failures of the other signals and where volume is on the one minute. This will help filter out the poor trades.Here is the 5 minute
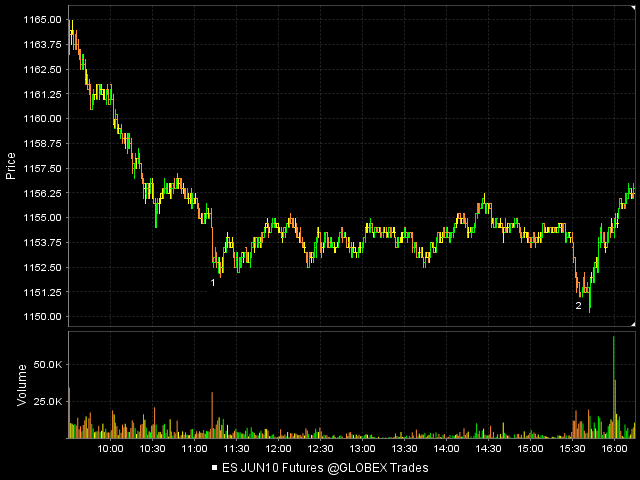
Here is the one minute:
I have marked the two best trades at points "1" and "2". Note the volume. Note the failures of the other signals and where volume is on the one minute. This will help filter out the poor trades.Here is the 5 minute
Click image for original size
Here is the one minute:
Click image for original size
Paul, you mention an excellent point about price being rejected immediately. Us Market profile traders are always aware when price opens out of value and outside a previous days range. The market trends more on these days so a counter trend approach has greater risk...we need to be more selective on those days
Originally posted by PAUL9
Hope I didn't upset anybody?
welp, the open today (Friday triple witch) was right near the 1165.50, and price was rejected immediately.
Noticed unfilled air from the RTH on Wednesday that has now been filled.
Originally posted by BruceM
here is the high close...horizontal is pre fed high....c'mon triples at 48.75 ..we all see them...
Click image for original size
Bruce if possible could you post the open and close of the fifth bar (lowest red bar) formed around 9:55 in the 16/3 5 min.chart
open 46.50
close 46...
close 46...
Thanks for your observations, BruceM.
RE Market Profile, you wrote:
MP traders are always aware when price opens outside of value and outside of previous day's range...
when I watched the first 15minutes unfold today I said jeez, this is a mirror image of Friday.
Friday had Gap up Open above RTH H of Thurs
Monday had Gap down Open below RTH L of Friday
Your comment about being wary of trend days, and the fact that you observed opens outside of value area...
Has anyone ever noticed this.
RE MP,
"P" shape supposed to be bullish
"b" shape supposed to be bearish
--BUT--
has anyone ever noticed that when a well defined, supposedly BULLISH "P" has unfolded, sometimes, on the next day, prices can tumble if the VAL is broken,
and the opposite,
if a well defined (supposedly bearish) "b" is evident, on the next day if price exceeds the VAH, positive bias, expect upside.
After BruceM's comment, I am now wondering, Like today (Monday 3-22-10) whether the open below the VAL was actually like a Wyckoff spring,
for today, Open below yesterday's RTH L and immediate buying came in, The undercut of Friday's RTH L was a search for stops? Buyers apparent immediately in the first 5m bar,
Friday produced a well defined "b" with a VAH of 56.75 (according to my crude indicator),
when price today was able to exceed Friday's VAH, have to assume buyers absolutely in control (trend day? with only small retracements?).
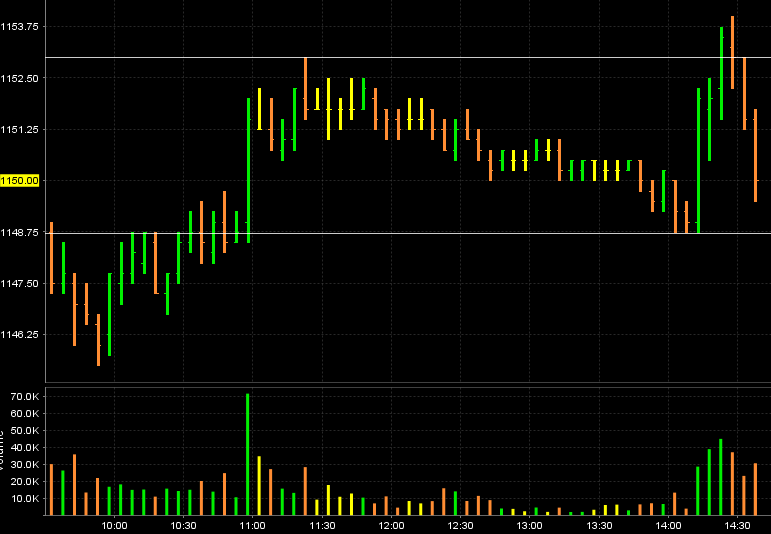
Bruce sorry for the trouble again but can you post the 5 min chart for 15/3 starting from 7:15am est to around 11:00am. Thanks in advance.
here you go, attempting to attach a chart...
for 3/15/10
for 3/15/10
trying again
Click image for original size
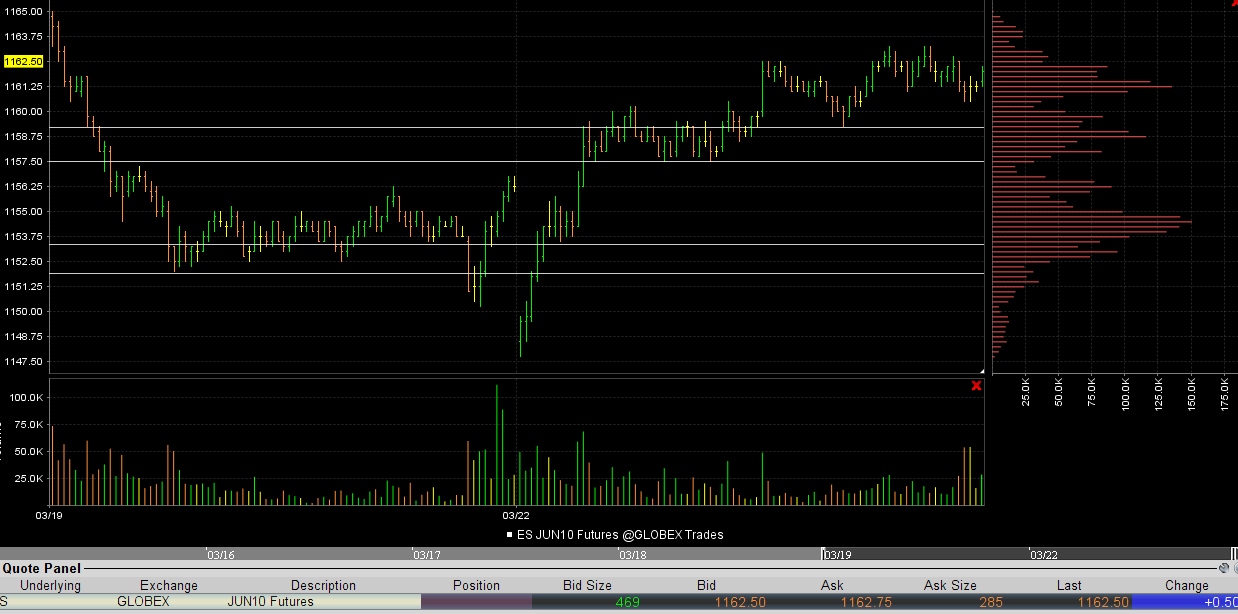
Here is how we are looking from a time/volume standpoint when we combine Friday and Monday. It seems to me that we need to fill in more of that combined range to round out the distribution...look at the volume profile on the right and all those peaks and valleys.
I'm still trading for that 57 - 58 area...
I'm still trading for that 57 - 58 area...
Click image for original size
Paul,
Here is my take on the "P" and "b" profile patterns. I'm not saying my version is correct either. Don Jones at cisco is the granddaddy of Market Profile. He thinks we should combine at least 3 days of profile to put things in context. He's probably right.
This is specifically how I view the patterns.
The "P" pattern - implies to me that we rallied but then the rally stopped and either longs are exiting or sellers are quitely and slowly getting short. So it is logical that we spend time to make the buldge in the "P". If we open lower into the stem of the "P" then we should try for a run up to test the buldge area of the pattern
The "b" - implies that we sold off and then buyers are accumulating and sellers are leaving the market so time makes the buldge. A gap higher open will try to bring in sellers first.
Dalton says that these patterns aren't perfect and take time and context....
I think your insight is correct Paul and the common viewpoint that is floating around the internet is misleading
Originally posted by PAUL9
BruceM,
Are you a head honcho?
Have to guess You are a head honcho.
I Need to find instructions for starting a thread.
I sifted through FAQ and found nothing. can you direct?
I sent you a PM with more info but basically it says click the "New Topic" link at the top of this page to create a new "thread". It's a bit confusing as threads are called topics on this forum.
Emini Day Trading /
Daily Notes /
Forecast /
Economic Events /
Search /
Terms and Conditions /
Disclaimer /
Books /
Online Books /
Site Map /
Contact /
Privacy Policy /
Links /
About /
Day Trading Forum /
Investment Calculators /
Pivot Point Calculator /
Market Profile Generator /
Fibonacci Calculator /
Mailing List /
Advertise Here /
Articles /
Financial Terms /
Brokers /
Software /
Holidays /
Stock Split Calendar /
Mortgage Calculator /
Donate
Copyright © 2004-2023, MyPivots. All rights reserved.
Copyright © 2004-2023, MyPivots. All rights reserved.