ES short term trading 7-22-10
Numbers for tomorrows day session:
1091
1086 - 1087
1079 - 1080..HV
1073 - 1075 ...singles will fill and closing Vwap
1066
1061
1053- 1056
1048
keep in mind we have singles from 70.25 - 74.25
Will refine them once we see what overnight brings
1091
1086 - 1087
1079 - 1080..HV
1073 - 1075 ...singles will fill and closing Vwap
1066
1061
1053- 1056
1048
keep in mind we have singles from 70.25 - 74.25
Will refine them once we see what overnight brings
new low $ticks...so if this is really a trend then price will hold and we will get new highs.......so basically these low Ticks need to attract sellers now!! and get below that hour high and stay below there!!
.......
Click image for original size
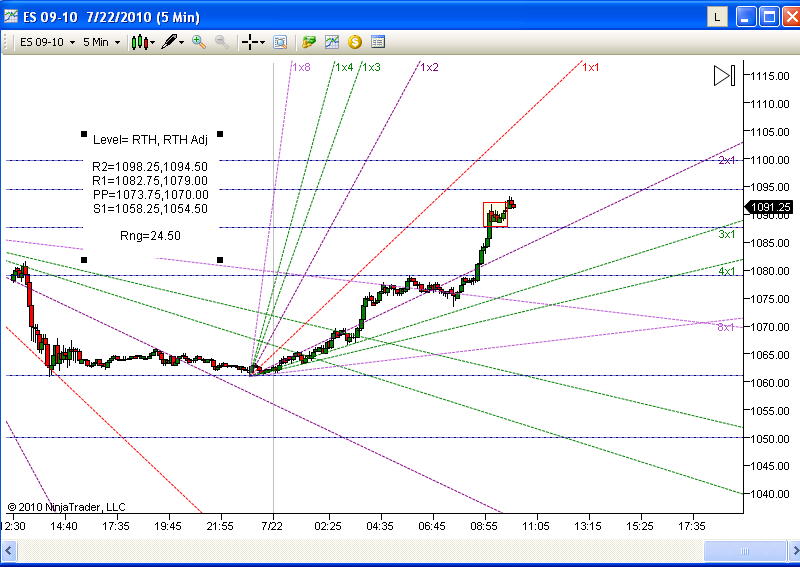
The range based S/R idea I stole from Dr. Steenbarger.
According to his data which is tested back to 2002, the odds of hitting R1 or S1 is 67%. It becomes a high probability target if volume is average or higher.
R2 or S2 probabilities of being hit going back to 2002 are 41%.
Here is the link to his page which discusses this.
http://traderfeed.blogspot.com/2010/03/bonus-post-calculating-price-targets.html
Originally posted by blue
Originally posted by Lorn
1094.50 R1 range based.
Figure we'll hit this?
Surpass it?
oops...heading labels reversed
Originally posted by Lorn
The range based S/R idea I stole from Dr. Steenbarger.
According to his data which is tested back to 2002, the odds of hitting R1 or S1 is 67%. It becomes a high probability target if volume is average or higher.
R2 or S2 probabilities of being hit going back to 2002 are 41%.
Thanks Lorn,
so is that a no you don't think we'll get to 94.50?
Ha!
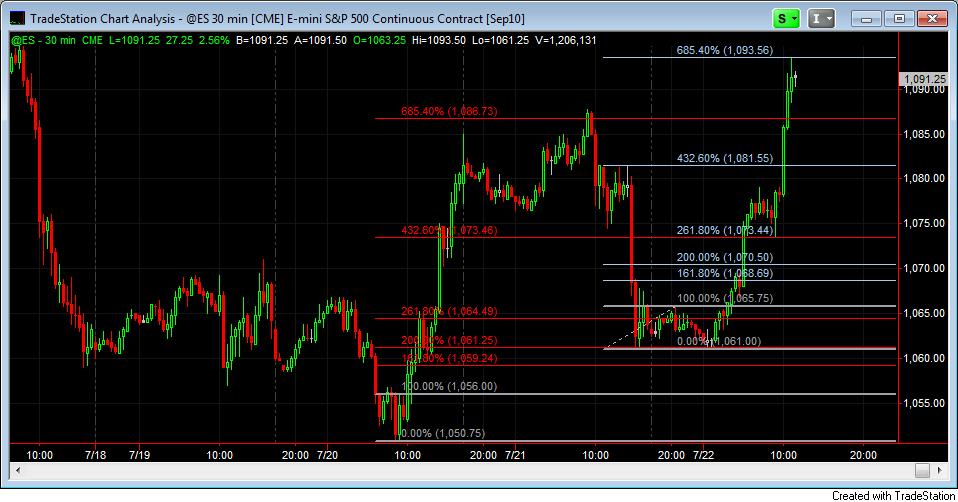
I think its a high probability target today. You can see the attached 30min chart with two different fib projections. The red projection is drawn off Tuesday's lows and prices just surpassed the large 6.854 level yesterday before reversing.
The second projection drawn off the low of yesterday into this morning is showing prices hitting its 6.854 projection.
These are all tools. They don't work 100% of the time but enough of the time that they are useful.
Click image for original size
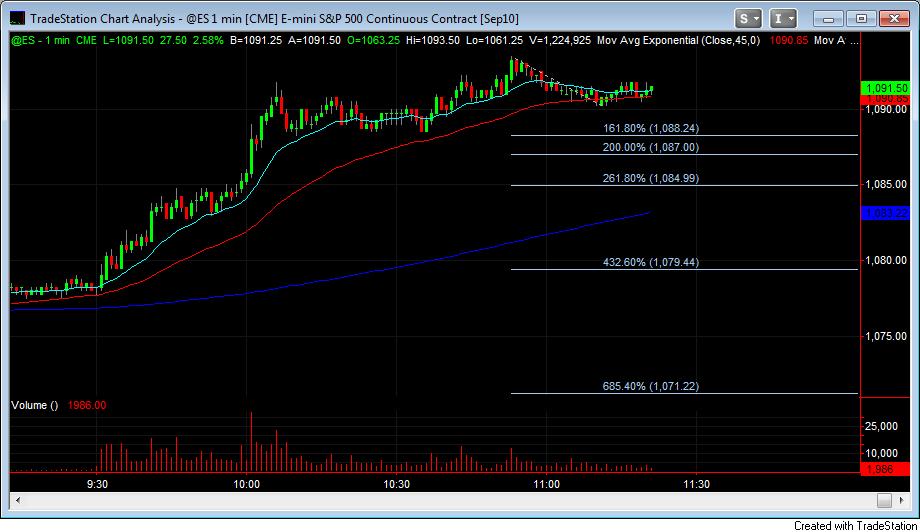
I've got to leave for the day. Here is one last chart with a projection down. 1 min chart as per Kool.
Click image for original size
wouldn't get too married to the long idea yet.....most of that volume happened over the report and so far buyers aren't aggressive above the hour highs......triples form in Low volume usually.....I'm not convinced yet
TTT 3 day cycle, Sell day, push price up to sell what was bought at yesterday lows, hold price up while selling... FWIW
many thanks Lorn.
OK, you got the explosive rally off of the 12-13 day low. If you go back and look at my charts you will notice the high never comes in untill day 5 at the earliest, more commonly day 6-8. Friday would be day 3 ,the way i count it. however you have this little demon to deal with....Closing tick +1238! And you know how i feel about that! I would not be surprised to see some back and fill tomorrow.certainly by the close mon! ... good trading all!!!
Emini Day Trading /
Daily Notes /
Forecast /
Economic Events /
Search /
Terms and Conditions /
Disclaimer /
Books /
Online Books /
Site Map /
Contact /
Privacy Policy /
Links /
About /
Day Trading Forum /
Investment Calculators /
Pivot Point Calculator /
Market Profile Generator /
Fibonacci Calculator /
Mailing List /
Advertise Here /
Articles /
Financial Terms /
Brokers /
Software /
Holidays /
Stock Split Calendar /
Mortgage Calculator /
Donate
Copyright © 2004-2023, MyPivots. All rights reserved.
Copyright © 2004-2023, MyPivots. All rights reserved.