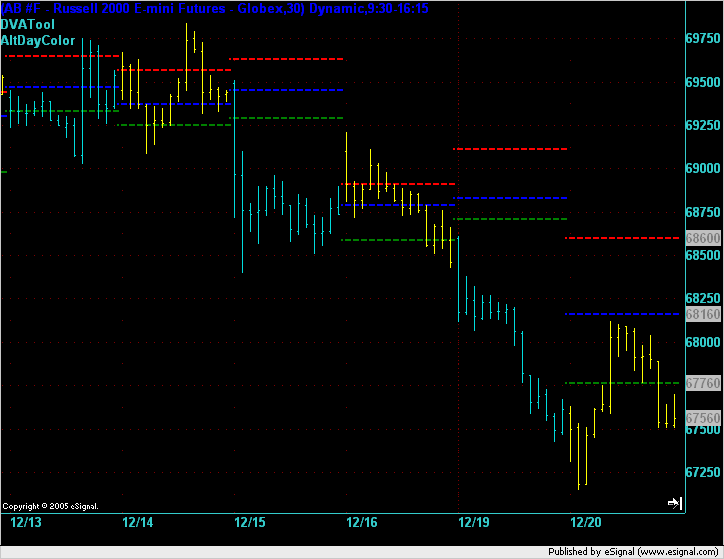
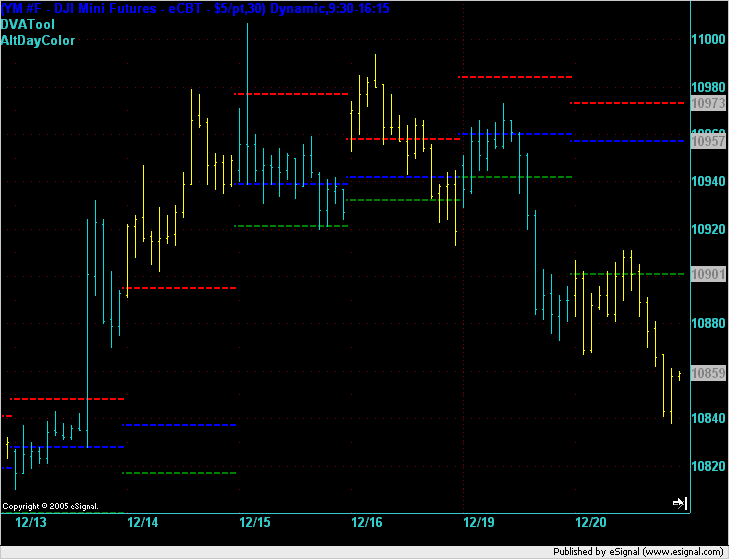
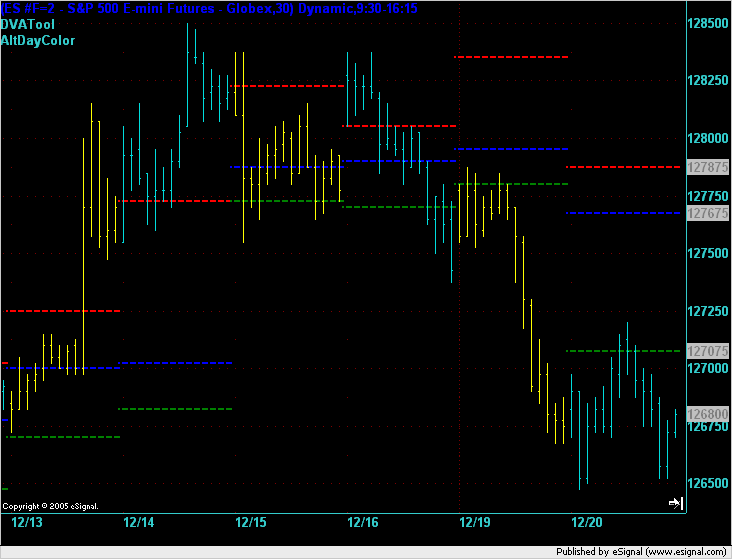
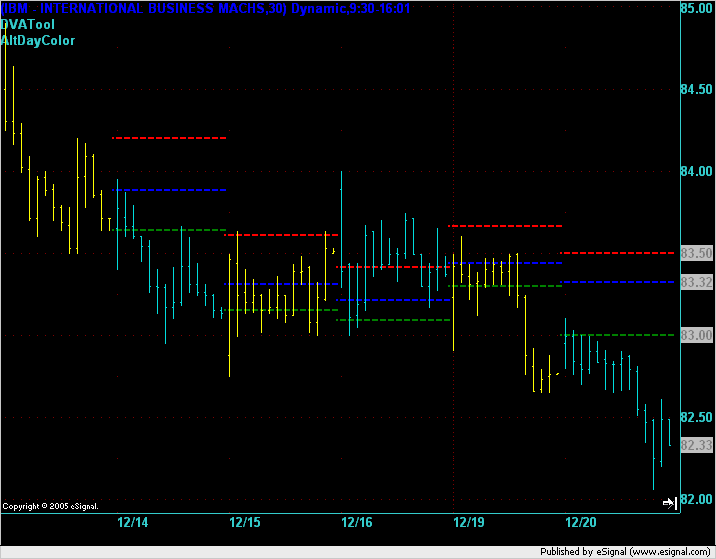
Each chart is a 30 minute bar chart with a time template of RTH on it. Days are alternately colored so that you can distinguish which day is which. The 3 horizontal lines are VAH, POC, VAL. If a line is missing this is probably because it overlaps with another.