The thirty minute closes
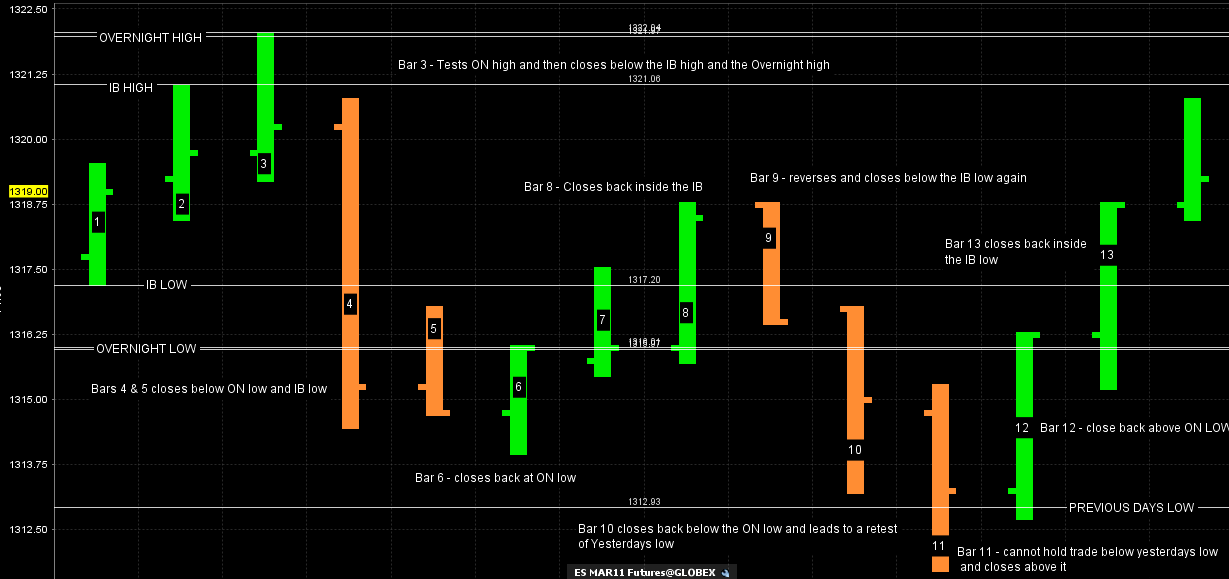
Here is a work in progress idea that I'm using to help qualify fade trades and hold trades that may be initiated from inside the key ranges. On a fade trade the basic idea is that you want to see the 30 minute bars close back inside key ranges after an attempted break of those ranges.
You would also like to see the bars close above and below the key ranges if you have taken trades from INSIDE of those ranges. So if you were a buyer for example inside a 60 minute range then you want to see the 30 minute bars close outside the 60 minute highs in order to hold runners for longer term targets.
The key ranges include the previous days RTH high and low, the most recent Overnight high and low and the 60 minute (IB)high and low. This takes advantage of the markets inability to break out of these key ranges. When true break outs happen we will see single prints form and move to the next target. We will also see consecutive higher or lower closes depending on the direction of the breakout.
I'll add to this thread as I go but as a quick example from today we saw bar number 3 attempt to break out of the IB high and the Overnight high. It failed and closed back below the IB high and below the O/N high. So those of us who fade breakouts WANT to see that and it helps as a filter to hold runners without watching the market for every squiggle that the market moves.
The real market students will find additional ways to use this information and hopefully share it with the forum. This was inspired by the daily close concept. Many traders like to see daily closes above and below key market points to potentially signal breakout moves. So I'm using this with the key intraday ranges. Afterall, we need to get 30 minute closes above or below key areas before we can get daily closes in the same direction. Hopefully we'll get an example of a trend day soon.
This chart below has lots of good examples as today was a neutral day and had some good and bad reversals. It's a bit busy but hopefully can be understood.
Click image for original size
Great stuff Bruce. I think its extremely useful to be working with all the important ranges you mention and mark on this chart. It allows the trader to make a mental picture of where current trading is in relation to the immediate past and I might add (although no way of proving it) over time the subconscious mind will internalize these levels and allow the trader to make much more instinctive trades as the trader becomes in tune with the markets. I'm a big believer of that kind of stuff and anything which helps a trader reach that level of experience is top notch!
Something else I've always like about paying attention to 30 minute closes. Think about it this way, we live our lives in 30 min time sets. TV and news shows, school sessions, meeting times, etc...
I was hoping to get a trend day today but this is instructive in it's own way.
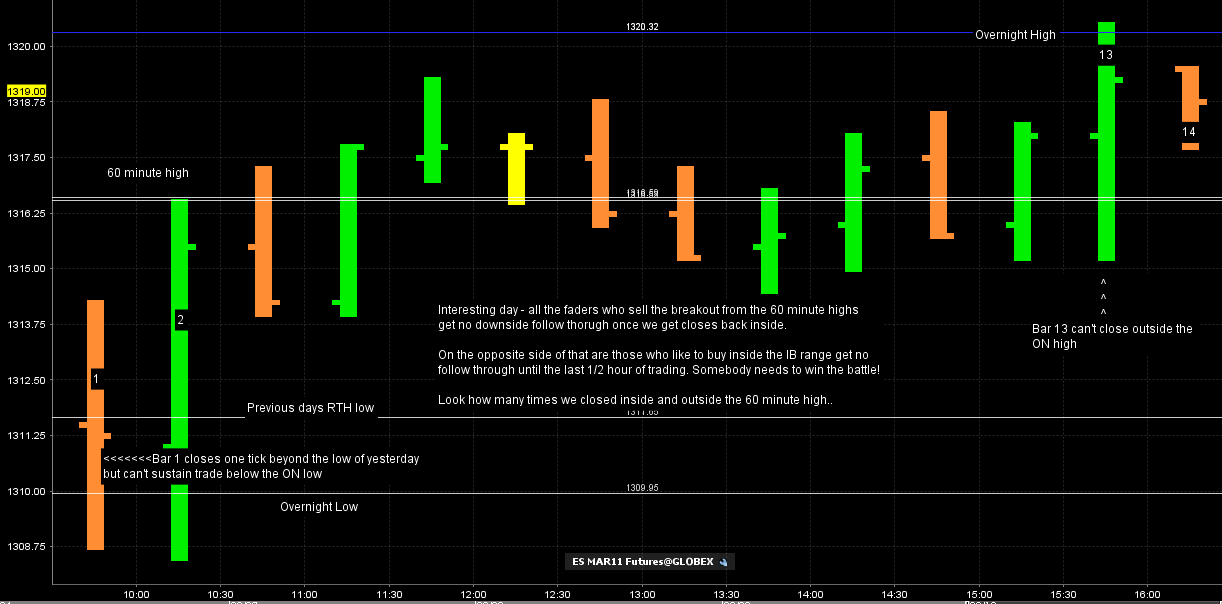
Those of us who like to buy breakdowns got rewarded this morning but the fades from the 60 minute range were challenging. I'm certainly not implying I took any particular trade from this chart. To see what I did you'd have to visit the day trading threads.
Ideally what I like to see happen is that everyone who is caught on the wrong side of a move gets trapped and they have to cover and it leads to further price move in our desired direction. That happened at the lows today.
Those of us who faded the 60 minute breakout where only slightly rewarded as we didn't get much downside follow through AFTER we closed back inside the 60 minute range. This is classic stuff and a good day to see how markets battle it out.
Ideally a close back inside a range should move in our favor faster after a false breakout. This didn't happen today and buyers stepped in once we re-entered the 60 minute range. Now those who bought were not really rewarded either as closes BACK outside the 60 minute highs didn't always go onto make new highs or hit the next objective until the days end when somebody was bound to win.
It is wise to expect range failures as we just don't trend enough in the ES. Expecting markets to trend is a losing game in my opinion and should only be attempted with runner contracts.
Here is today's chart:
Click image for original size
I'm mostly a price action/level trader but I'm putting out this idea for further research.
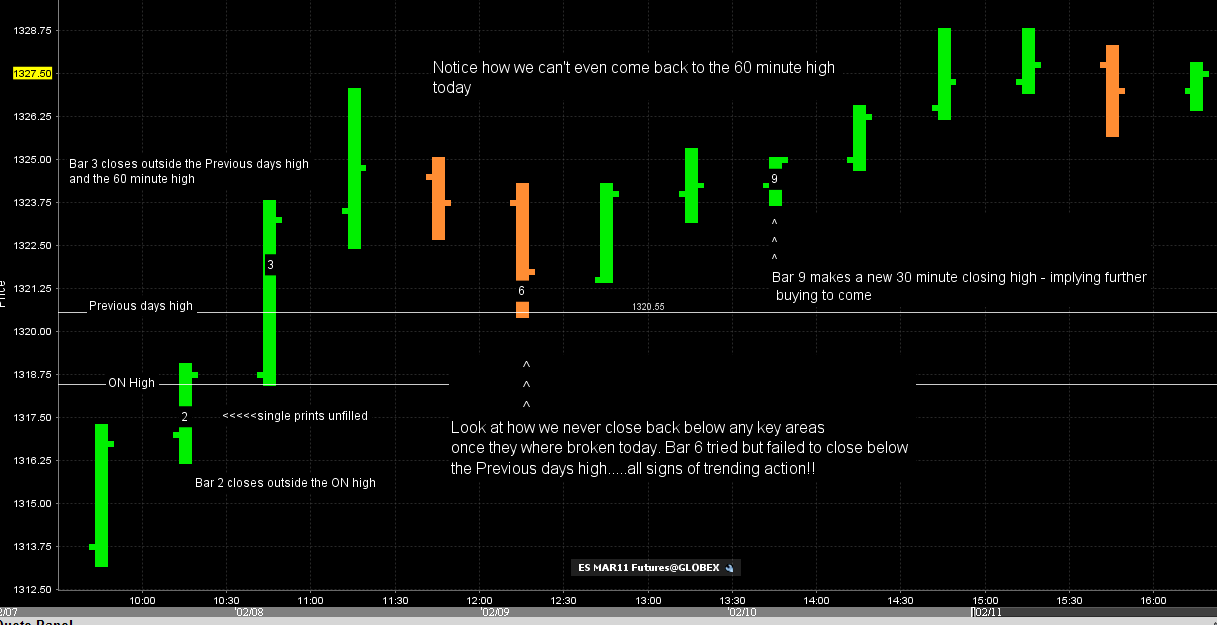
I think we could qualify breakouts by how many ES points we trade beyond the key levels. For those who eventiually read this you may find that a close 4 points for example below an Overnight low is much more powerful than a close of only one tic..... this is just an idea I'm tossing out there and not meant to be anything specific in terms of point thresholds you should use.
I think we could qualify breakouts by how many ES points we trade beyond the key levels. For those who eventiually read this you may find that a close 4 points for example below an Overnight low is much more powerful than a close of only one tic..... this is just an idea I'm tossing out there and not meant to be anything specific in terms of point thresholds you should use.
Today was somewhat of a trend day ( at least part of the day)and one of the key things to look at is the ability of the market to get 30 minute closes outside the key levels early leaving single prints in it's wake. . The bold is intentional and the critical point. The other take away from this chart is the markets inability to close back inside any key areas once they are penetrated...
So the trend traders win today....and we are provided with some good examples for our 30 minute ideas!
So the trend traders win today....and we are provided with some good examples for our 30 minute ideas!
Click image for original size
Good stuff Bruce.
I'm adding some key ideas as I see fit. On days when the 60 minute fades fail, you will quite often get a good fade once we trade above the high of the 90 minute high. Esepecially when you get the first 3 bars of the day moving in the same direction. This makes sense as the market can only push in one direction for so long without needing to take a break and move counter to the trend.
You can also see how we closed below the 90 minute high today but later reversed and closed outside it leading to new highs. Some use the first 90 minutes of trade for the IB. It is not the intent of this thread to fiqure out what is the best IB to use. You can see the struggle on 2-07-11 at the 90 minute high and then the close below it which led to selling. Just tossing that out there. I suggest you go back and look at a few 90 minute highs and lows if interested.
You can also see how we closed below the 90 minute high today but later reversed and closed outside it leading to new highs. Some use the first 90 minutes of trade for the IB. It is not the intent of this thread to fiqure out what is the best IB to use. You can see the struggle on 2-07-11 at the 90 minute high and then the close below it which led to selling. Just tossing that out there. I suggest you go back and look at a few 90 minute highs and lows if interested.
Bruce, im a firm believer that any technical analysis worth its salt will be valid on all time frames and markets. I realize this is a work in progress, but i find it very interesting and valid. Have you ever considered trying these analysis techniques on a daily time frame? That would be really interesting!
Bruce, since the RTH's close at :15 past the hour, what are your chart times set for !?!
RTH Open to Close?
RTH Open to Close?
Good point Kool and that is what this originated from - the daily time frame.....so the big traders will watch how and where the daily closes form to signal breakouts etc,,,
I watch the daily close and am usually aware of when we close inside or outside key ranges but I don't trade off dailies or hold longer term positions based on this alone.
I watch the daily close and am usually aware of when we close inside or outside key ranges but I don't trade off dailies or hold longer term positions based on this alone.
Originally posted by koolblue
Bruce, im a firm believer that any technical analysis worth its salt will be valid on all time frames and markets. I realize this is a work in progress, but i find it very interesting and valid. Have you ever considered trying these analysis techniques on a daily time frame? That would be really interesting!
Just having up the 5IB levels is a help as to direction, so no, these 30 Min Closes certainly aren't garbage.
It's another indicator of directional strength at the very least, and even could become a trading method for those with "healthy" trading accts.
It's another indicator of directional strength at the very least, and even could become a trading method for those with "healthy" trading accts.
Emini Day Trading /
Daily Notes /
Forecast /
Economic Events /
Search /
Terms and Conditions /
Disclaimer /
Books /
Online Books /
Site Map /
Contact /
Privacy Policy /
Links /
About /
Day Trading Forum /
Investment Calculators /
Pivot Point Calculator /
Market Profile Generator /
Fibonacci Calculator /
Mailing List /
Advertise Here /
Articles /
Financial Terms /
Brokers /
Software /
Holidays /
Stock Split Calendar /
Mortgage Calculator /
Donate
Copyright © 2004-2023, MyPivots. All rights reserved.
Copyright © 2004-2023, MyPivots. All rights reserved.