ES numbers 4-28-11
key support zone and probable magnet:
1345 - 1347.25 - this has VPOC, vwap, the Va high, the midrange.....I think that will need to get tested and soon perhaps in O/N trade still
1352 - this was the biggest volume from YD trade at around 3:35, then the 4 pm close was here and then the 4:15 close....so lots of interest there
Yesterday that was a spike in the afternoon and the market did not get TIME to digest that late afternoon rally( read Daltons MOM) so where we open in relation to that spike means something
1-2-3 sell in place
took something off at 53 print ..ahead of key area...prefer to see this stay below hour high in order for runners to go get that 51.50....problem with the 51.50 is that we need to go thorugh peak volume to reach that....so a harder hold...
took some off at VWAP
huge electrical storm here, I'm shutting down
good luck to all.
good luck to all.
Originally posted by koolblueglass floor!!!
Originally posted by BruceMGood luck, friend! hellova ledge there which will undoubtably break in time!
what do u call that at 51.50.....? A big old target...short on 53.50 !! will add higher if needed
next stop...48.50... eventually
New person here...wanted to just throw out a huge thank you to all of you, especially Bruce for all the guidance on the books and in his posts.
Watching, reading, learning...and trying to keep up!
Watching, reading, learning...and trying to keep up!
flat at 51.75....classic stuff...big volume to break out of hour high and YD high but no follow through
I have 1348.25 as a big-volume number from yesterday
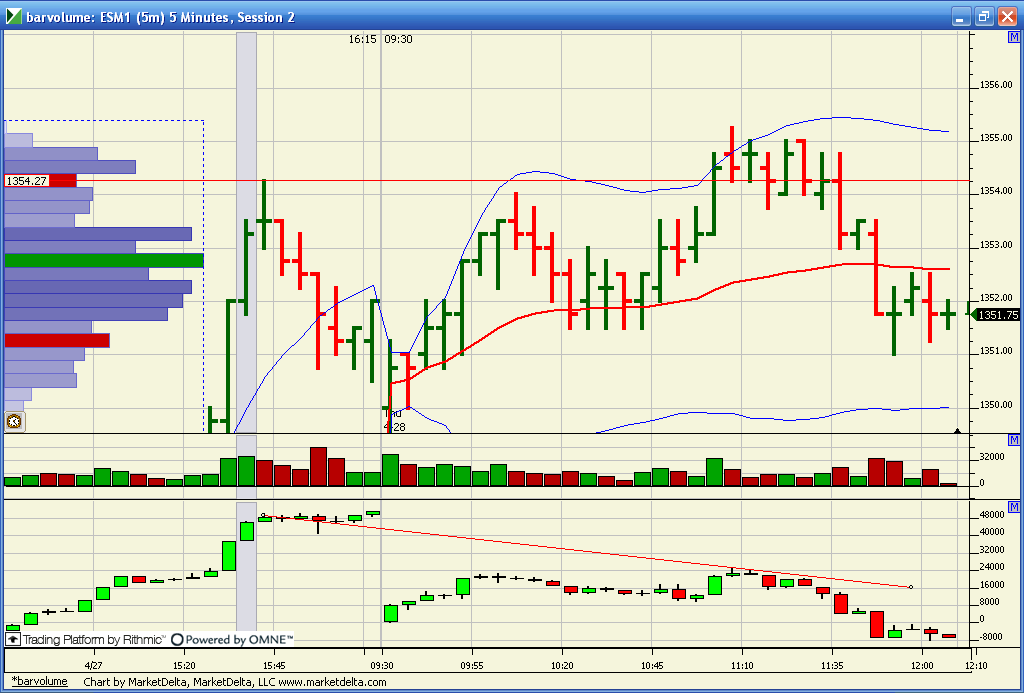
here is a chart... a bit crude as I haven't worked on making it look good yet...On the left side you can see the Volume histogram....classic bell shape. RED horizontal line is Yesterdays high, blue lines that look like bollinger are 2nd standard deviation off Vwap.....all things I've watched but now have them on one screen..
Lower pane is still experimental but that is Day only Cummulative delta...
So here is the the hour breakout, that took out Yesterdays highs and look at where the CD is ?..Not even close to the energy (CD) levels that created yesterdays high....so that high is run out on much less energy.. nobody is that interested yet in trade up there...so we revert back..
Just another form of internals confirmation...Volume and $tick diverged from yesterdays level too.......
Click image for original size
don't you just set that up as a 5 tic reversal chart in Market delta...? perhaps I missed the Point and fiqure option.....I'll need to look again...thanks
Originally posted by Lisa P
Originally posted by BruceM
Lisa I have Zenfire data and we aren't matching up...is that IB data you have on your 5 tic reversal footprint ? Can anyone fire a chart like that up and see if their data matches....?
I had buyers winning into the 11:16 bar but then at 11:30 bar the sellers took over...just want to make sure my zenfire data isn't goofy!!
Bruce, yes, I have IB feed. Please note that I use "point and figure" chart which is NOT time-based, not sure what you use.
Emini Day Trading /
Daily Notes /
Forecast /
Economic Events /
Search /
Terms and Conditions /
Disclaimer /
Books /
Online Books /
Site Map /
Contact /
Privacy Policy /
Links /
About /
Day Trading Forum /
Investment Calculators /
Pivot Point Calculator /
Market Profile Generator /
Fibonacci Calculator /
Mailing List /
Advertise Here /
Articles /
Financial Terms /
Brokers /
Software /
Holidays /
Stock Split Calendar /
Mortgage Calculator /
Donate
Copyright © 2004-2023, MyPivots. All rights reserved.
Copyright © 2004-2023, MyPivots. All rights reserved.