ES Day Trading 5-25-2011
Two vprofiles on this chart. Last weeks and the developing one for this week. Tight range so far this week and the bell curve shaped profile signaling a fight between bulls and bears. Interesting to note VPOC is below last weeks range.
Click image for original size
VIX at support, INDU at resistance - hang in Bruce....lol
Too bullish IMHO... longs only for me.
now why do I get the feeling they are gonna do one of those big volume surges up...to shake me out...single prints are offical in 7 minutes....not adding unless I see the surge or we get back under the 90 minute highs..
whentheytrendwelose.com
whentheytrendwelose.com
Click image for original size
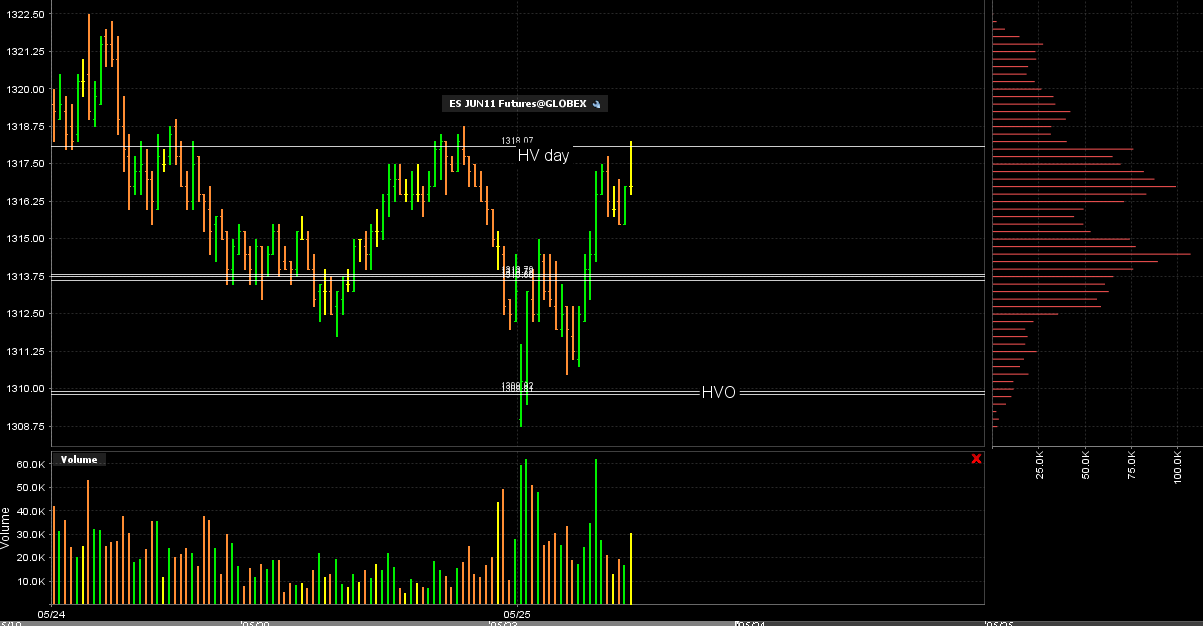
here is the visual of two days combined...notice the low spot in the middle....so it is developing...and if it is to go as a bell curve then they will need to fill in the center again so we will trade back down...a big volume surge will mess up the theroy and the formation
this stuff distracts me so I don't worry about the trade...notice the Volume histogram on the right side
hopefully this will be my "post of the day" meaning that the trade will work and we fill in
this stuff distracts me so I don't worry about the trade...notice the Volume histogram on the right side
Click image for original size
hopefully this will be my "post of the day" meaning that the trade will work and we fill in
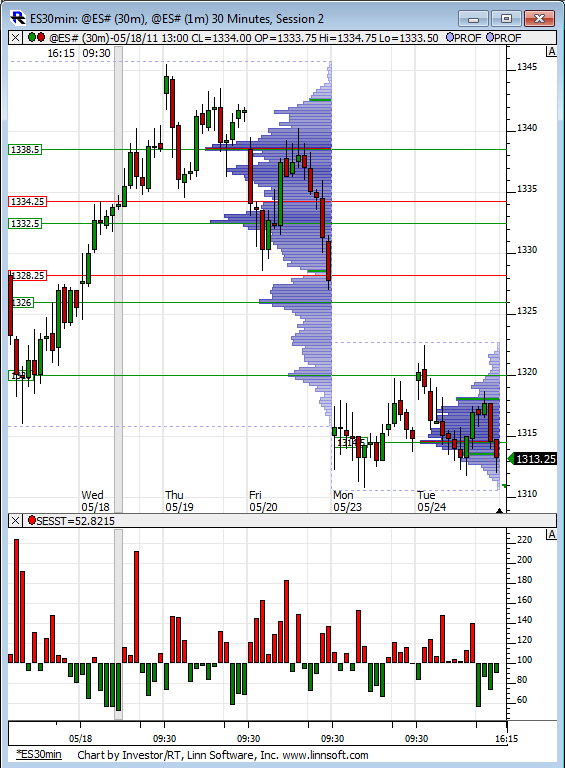
no test of any previous 30 minute low theory in effect now too!!
May the force be with Me!!
May the force be with Me!!
VIX is still at support
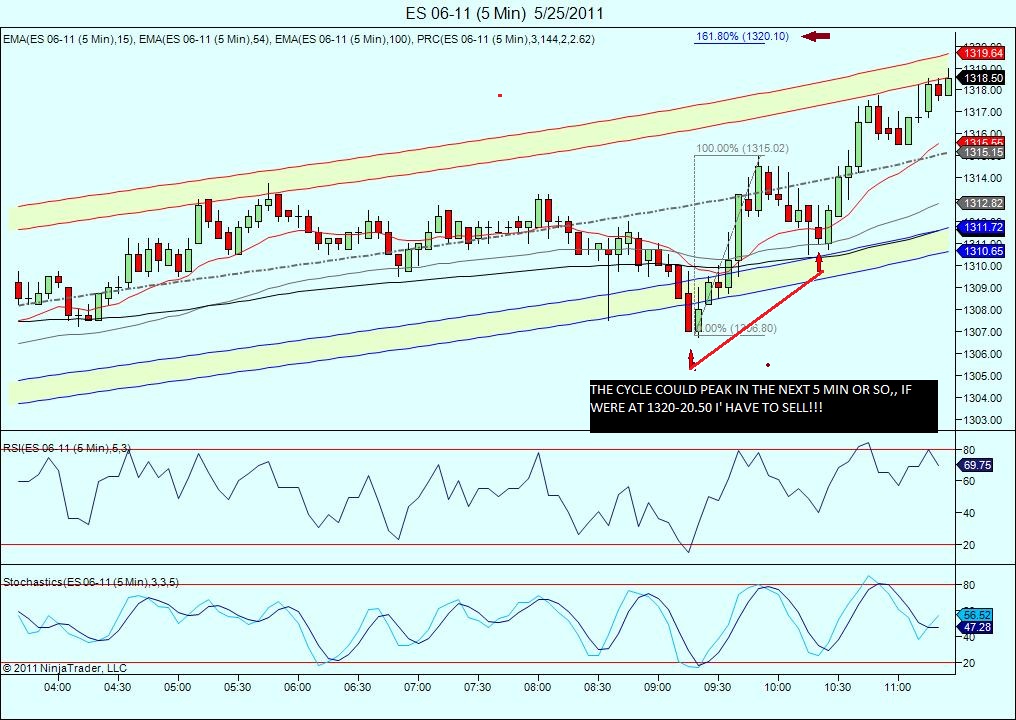
R1 is at 1320.
The range between the PP and R1 is relatively small (4 points, in this case). I've seen this to mean that R1 is "weak" and won't offer as much resistance.
Instead I look at PP to R2 (52.8% of that range is at 1321.75) for targets. Not to say we can't see a pullback to 1317 or so, but more money in the longs, IMHO.
I know that doesn't fit in with what others are looking at... but I thought I'd share.
split last adds at 18.25 and 20.75.....loser will now be above YD RTH highs...avergae in price is 18.50....
Originally posted by neoikon
Instead I look at PP to R2 (52.8% of that range is at 1321.75) for targets...
1321.68 to be exact. 1321.25 is pretty close! ;]
78.6% of PP to R2 is 1324.50... which is also 52.8% extension of Monday's RTH upwards. If we get there, I'd expect some resistance.
Would like to see ~17 now, though.
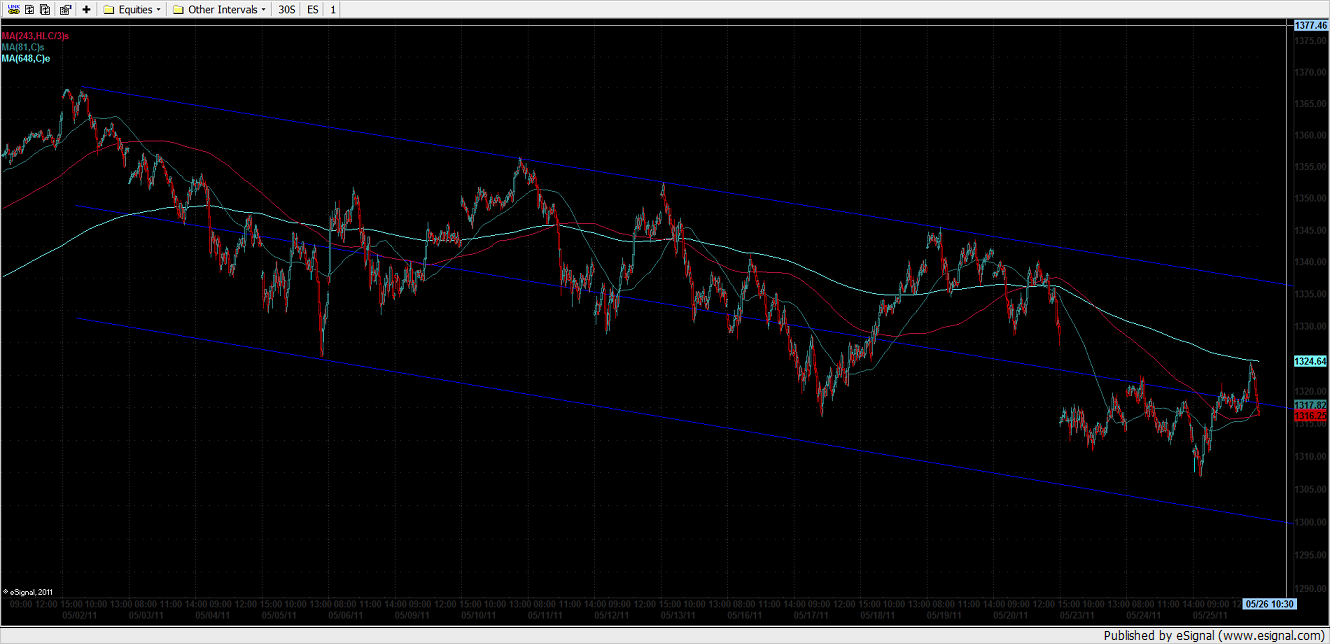
There's divergence in this market. This is a 5 min (daily numbers: 1 SMA, 3 typical SMA, & 8 EMA. The 8's leveling off and the 1 and 3 are trying to drive prices lower. Some heavy chop swings coming down the pike.
Chop I says. 12, 16, 21, 35, 43 I says.
Chop I says. 12, 16, 21, 35, 43 I says.
Click image for original size
Emini Day Trading /
Daily Notes /
Forecast /
Economic Events /
Search /
Terms and Conditions /
Disclaimer /
Books /
Online Books /
Site Map /
Contact /
Privacy Policy /
Links /
About /
Day Trading Forum /
Investment Calculators /
Pivot Point Calculator /
Market Profile Generator /
Fibonacci Calculator /
Mailing List /
Advertise Here /
Articles /
Financial Terms /
Brokers /
Software /
Holidays /
Stock Split Calendar /
Mortgage Calculator /
Donate
Copyright © 2004-2023, MyPivots. All rights reserved.
Copyright © 2004-2023, MyPivots. All rights reserved.