ES 6-8-2011
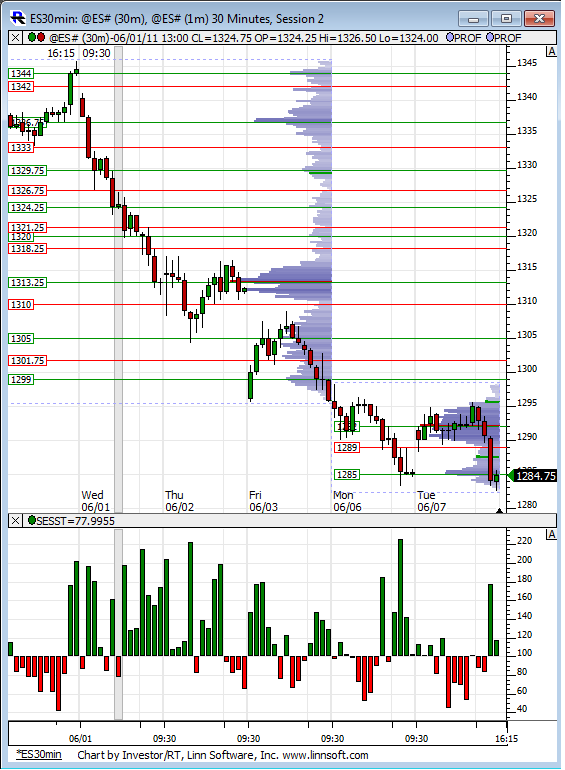
From the perspective of the RTH session only as on this chart, you can see that Monday/Tuesday have been a big consolidation from last weeks down move. Are we seeing a break of the range to the downside here in the O/N? The only clue on this chart is down moves have come on surging volume, up moves on decreasing volume.
Low from 3-23 of 1279 has now been breached and if you look at a daily all session chart there is a gap in the data from the open on 3-18 of 1268.50 to the low on 3-21 of 1274.75.
Low from 3-23 of 1279 has now been breached and if you look at a daily all session chart there is a gap in the data from the open on 3-18 of 1268.50 to the low on 3-21 of 1274.75.
Click image for original size
i think your data provider may have rolled the contracts to september
thanks Nick..at 4:30 my IB data froze again so I went over to Finviz...they were showing 1270 but I don't know how they arrive at the data...now that Ib is back I'm showing 75.25 for the June lows.....
Ib had data problems yesterday too... usually they are failry good
Ib had data problems yesterday too... usually they are failry good
i thought the same thing when i looked at my screen after 4.30pm but then i noticed dtn-iq had rolled over to sep; don't know why, jun is still good till tomorrow afternoon, volume wise
Originally posted by NickP
i thought the same thing when i looked at my screen after 4.30pm but then i noticed dtn-iq had rolled over to sep; don't know why, jun is still good till tomorrow afternoon, volume wise
My research shows that volume switches to the new contract at 9:30am tomorrow morning:
http://www.mypivots.com/articles/articles.aspx?artnum=10&page=5
Emini Day Trading /
Daily Notes /
Forecast /
Economic Events /
Search /
Terms and Conditions /
Disclaimer /
Books /
Online Books /
Site Map /
Contact /
Privacy Policy /
Links /
About /
Day Trading Forum /
Investment Calculators /
Pivot Point Calculator /
Market Profile Generator /
Fibonacci Calculator /
Mailing List /
Advertise Here /
Articles /
Financial Terms /
Brokers /
Software /
Holidays /
Stock Split Calendar /
Mortgage Calculator /
Donate
Copyright © 2004-2023, MyPivots. All rights reserved.
Copyright © 2004-2023, MyPivots. All rights reserved.