ES 6-8-2011
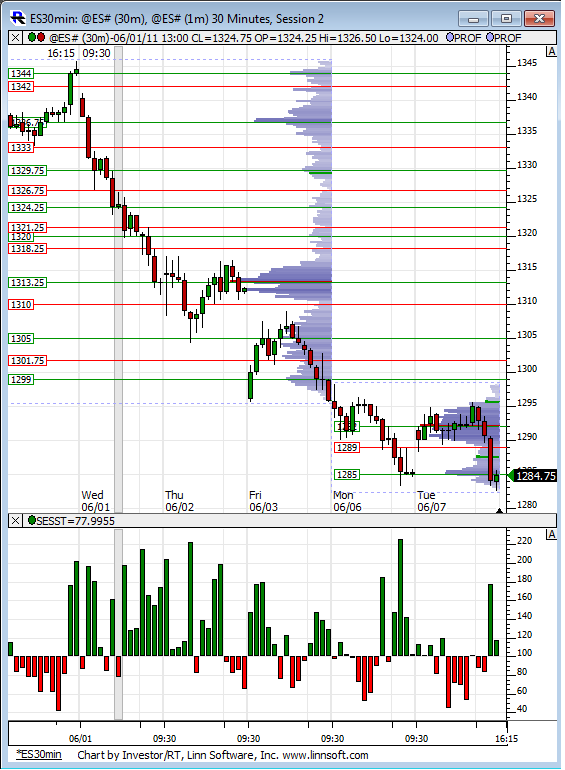
From the perspective of the RTH session only as on this chart, you can see that Monday/Tuesday have been a big consolidation from last weeks down move. Are we seeing a break of the range to the downside here in the O/N? The only clue on this chart is down moves have come on surging volume, up moves on decreasing volume.
Low from 3-23 of 1279 has now been breached and if you look at a daily all session chart there is a gap in the data from the open on 3-18 of 1268.50 to the low on 3-21 of 1274.75.
Low from 3-23 of 1279 has now been breached and if you look at a daily all session chart there is a gap in the data from the open on 3-18 of 1268.50 to the low on 3-21 of 1274.75.
Click image for original size
look here
http://www.mypivots.com/board/topic/1337/1/pitbull-three-strategy
http://www.mypivots.com/board/topic/1337/1/pitbull-three-strategy
Originally posted by palmer
Bruce - where can I find what is PITBULL #. never heard of that
I use to visit that site regularly and then forgot about it...thanks ...I must be getting lazy..thank you for posting that and bringing that back into focus...that's a good site
Originally posted by apk781
that report is a non event
i am sure most of you are familiar with this website: http://fidweek.econoday.com/
for those of you that don't know which reports are relevant and which are not (aside from the unemployment numbers and so on) there is a star next to the time of the announcement that indicates its importance: ie red very important, yellow somewhat important , etc
Re: Significance of reports ... some reports are typically non-events but will take on more significance (and vice versa) at different times. A perfect example is with housing reports and home sales related numbers. These became market movers due to the significance of what happened with real estate over the past few years.
Also, energy supplies/inventories can move the stock market as well ... and sometimes not ... depending on a variety of factors.
Just tossing in 2 more cents here.
Also, energy supplies/inventories can move the stock market as well ... and sometimes not ... depending on a variety of factors.
Just tossing in 2 more cents here.
whew..that damn 82.50 is a powerful magnet so far..I was holding one contract for 87.50 and got stopped out at 84.50....I often think about how crazy the math gets....I was one point away from my target and gave up two points of potential profit to reach that last point of profit..
so hard to get fair risk to reward most times...especially if you trade with a target in mind first..was hoping the 60/90 minute breakout would have actually worked for a change...serves me right..I should have know better..
so hard to get fair risk to reward most times...especially if you trade with a target in mind first..was hoping the 60/90 minute breakout would have actually worked for a change...serves me right..I should have know better..
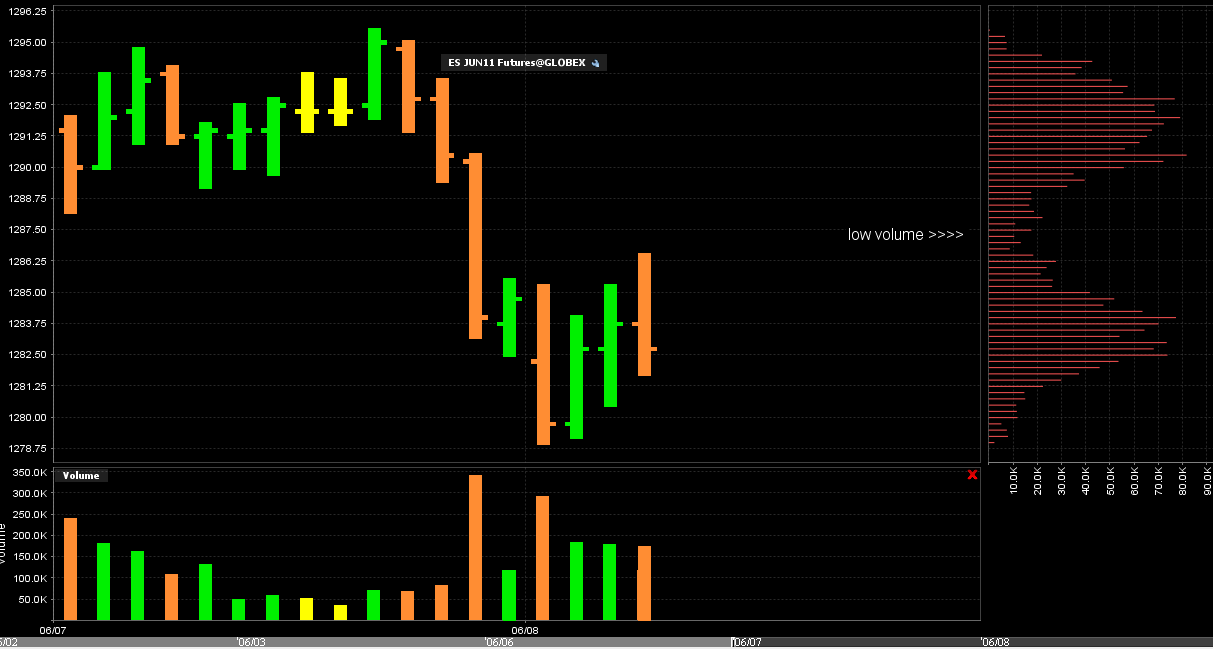
here is a look at just the last two days with volume....I can't sell down here and will look to get long again.......this is the famous Moneky Meat " two boobs and cleavage " pattern....I'd rather miss the downside then trade against this...
Ideal location for me will be below 80 again.... that will put us 2.5 points below the 82.50 so we can use that to target from below and then tighten runners up...easier said than done!!
Ideal location for me will be below 80 again.... that will put us 2.5 points below the 82.50 so we can use that to target from below and then tighten runners up...easier said than done!!
Click image for original size
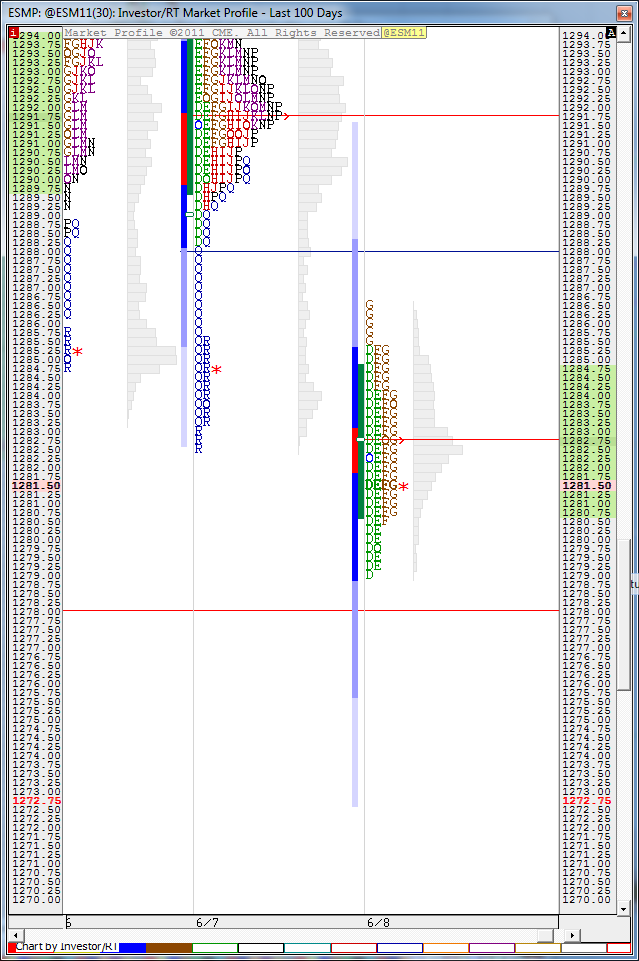
Thought I'd point this out. That red line at 1278 is a naked POC from 3-18.
Click image for original size
hard to believe that in classic market profile terms we are still one time framing up....
Only from a monthly perspective but yes.
Originally posted by BruceM
hard to believe that in classic market profile terms we are still one time framing up....
I was refering to todays RTH 30 minute bars...we have yet to trade below any 30 minute bars low today.....but we will !
LOL...doh!
Originally posted by BruceM
I was refering to todays RTH 30 minute bars...we have yet to trade below any 30 minute bars low today.....but we will !
Originally posted by NickP
i thought the same thing when i looked at my screen after 4.30pm but then i noticed dtn-iq had rolled over to sep; don't know why, jun is still good till tomorrow afternoon, volume wise
My research shows that volume switches to the new contract at 9:30am tomorrow morning:
http://www.mypivots.com/articles/articles.aspx?artnum=10&page=5
Emini Day Trading /
Daily Notes /
Forecast /
Economic Events /
Search /
Terms and Conditions /
Disclaimer /
Books /
Online Books /
Site Map /
Contact /
Privacy Policy /
Links /
About /
Day Trading Forum /
Investment Calculators /
Pivot Point Calculator /
Market Profile Generator /
Fibonacci Calculator /
Mailing List /
Advertise Here /
Articles /
Financial Terms /
Brokers /
Software /
Holidays /
Stock Split Calendar /
Mortgage Calculator /
Donate
Copyright © 2004-2023, MyPivots. All rights reserved.
Copyright © 2004-2023, MyPivots. All rights reserved.