Housing Futures
Today the CME launched the Housing Futures. These futures are trading 2 listed contracts at the moment: The August (Q) and November (X) contracts.
Ticker symbols for the 10 city contracts + 1 composite contract are:
CUS=Composite Index
BOS=Boston
CHI=Chicago
DEN=Denver
LAV=Las Vegas
LAX=Los Angeles
MIA=Miami
NYM=New York
SDG=San Diego
SFR=San Francisco
WDC=Washington, DC
I'm going to try and get more information about how and where these contracts traded today - their inaugural day.
Click link to access uploaded file:
CMEHousingFutures.xls
CMEHousingFutures.xls
The spreadsheet above holds as much data as I could find at around 12:00 EST on the launch day of the CME Housing Futures.
The contracts listed are the Aug 06 (Q6) and Nov 06 (X6) contracts and these are apparently the last traded or quoted prices - not sure which yet.
Note that all the city indexes were set to 100 as at January 2000. The value of the future reflects the anticipated appreciation (or depreciation) of housing in that city from January 2000 to the final index calculation. The difference between the August and November contracts reflects the anticipated appreciation/depreciation between those 2 dates which covers 3 months or 1 quarter.
Note that the futures reflect appreciation from August to November in all cities. The smallest appreciation expected is in Boston with 0.9% during that quarter and the largest is in Miami with 7.8%
In order to calculated the change since January 2000 you should divide the value by 100 and then subtract 1. Turn this value into a percentage (by multiplying by 100) and this will give you the % appreciation since January 2000. For example, the composite future for Q6 was showing a 145% appreciation and the Miami future 224%.
Here is some information (as I understand it) about how the cash and futures settle.
At 13:15 CST on the last Tuesday of each month the value of the cash indexes (in 10 cities and 1 composite) is announced. This cash index is the Cash-Shiller tradable index and should not be confused with other indexes published.
The futures run on the February cycle and will expire at the same time but only on 4 of the 12 cash index announcement dates. We would expect the futures values to spike sharply away from current value on the announcement dates if the cash index is not close to expectation.
So, according to my calendar calculations we should have 3 cash index announcements on 30 May, 27 June, and 25 July before the first dual future and cash index expiration on 29 August 2006.
If you have any questions about any of this or want me to expand on it then just post a reply to this topic.
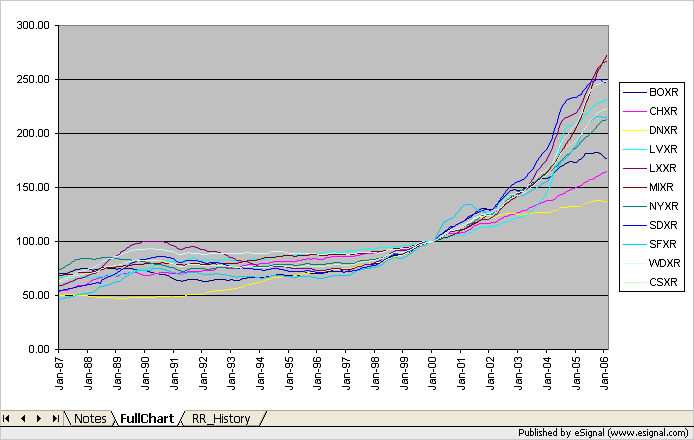
You may also find this spreadsheet of use. It holds the monthly price index for the 10 cities and composite from Jan 1987 to Feb 2006 and there is also a chart in there that compares the 11 index values. The spreadsheet values were taken from the CME web site and the chart was generated by me.
Here is an image of the chart but better resolution can probably be seen in the spreadsheet.
Click link to access uploaded file:
MetroArea_PriceHistory.xls
MetroArea_PriceHistory.xls
Here is an image of the chart but better resolution can probably be seen in the spreadsheet.
Click image for original size
Using eSignal to get quotes on the CME Housing Futures:
First find the symbol:
CUS=Composite Index
BOS=Boston
CHI=Chicago
DEN=Denver
LAV=Las Vegas
LAX=Los Angeles
MIA=Miami
NYM=New York
SDG=San Diego
SFR=San Francisco
WDC=Washington, DC
Then the code for the month:
Aug 06 (Q6) and Nov 06 (X6)
And put them together with a space between them. This is for eSignal. Other charting and trading platforms do not use the space or use a slightly different syntax which should be easily work-out-able from here.
eSignal example:
Composite Index Future for Nov 06
CUS X6
Las Vegas Index Future for Aug 06
LAV Q6
CME Housing Futures Update
The CME Housing Futures have been trading for 3 weeks now. From the data that I have been able to access it appears that the Los Angeles and Miami indexes are the most active in both the August (Q6) and the October (X6) expiry months. Have said that, there does not appear to be very much activity with around 20 contracts traded in each over the 3 weeks they have been 'live.'
I have discovered that there are 2 new contracts being listed. The February (G7) and May (K7) contracts for 2007. I have done some analysis of the prices as at close on 9 June 2006 over the 11 indexes and 4 expiration dates.
As you can see from the image above, the anticipated change in the housing prices from the August 2006 contract through to May 2007 is generally down. All indexes show a drop over this period except for Los Angeles which shows a 0.5% increase. The largest anticipated fall is in Boston with a 3.6% drop. Although Las Vegas shows a 1.8% fall from Aug 2006 to Nov 2006 this fall is reduced by May 2007.
Comments welcome...
The CME Housing Futures have been trading for 3 weeks now. From the data that I have been able to access it appears that the Los Angeles and Miami indexes are the most active in both the August (Q6) and the October (X6) expiry months. Have said that, there does not appear to be very much activity with around 20 contracts traded in each over the 3 weeks they have been 'live.'
I have discovered that there are 2 new contracts being listed. The February (G7) and May (K7) contracts for 2007. I have done some analysis of the prices as at close on 9 June 2006 over the 11 indexes and 4 expiration dates.
Click image for original size
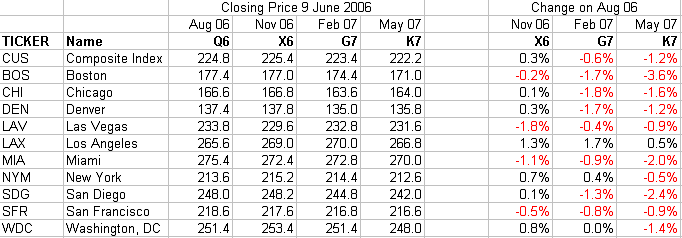
As you can see from the image above, the anticipated change in the housing prices from the August 2006 contract through to May 2007 is generally down. All indexes show a drop over this period except for Los Angeles which shows a 0.5% increase. The largest anticipated fall is in Boston with a 3.6% drop. Although Las Vegas shows a 1.8% fall from Aug 2006 to Nov 2006 this fall is reduced by May 2007.
Comments welcome...
Here are some snapshots of what the live quote screens in the CME Housing Futures looked like at around 11:30 to 12:00 EST on 6/12/2006.
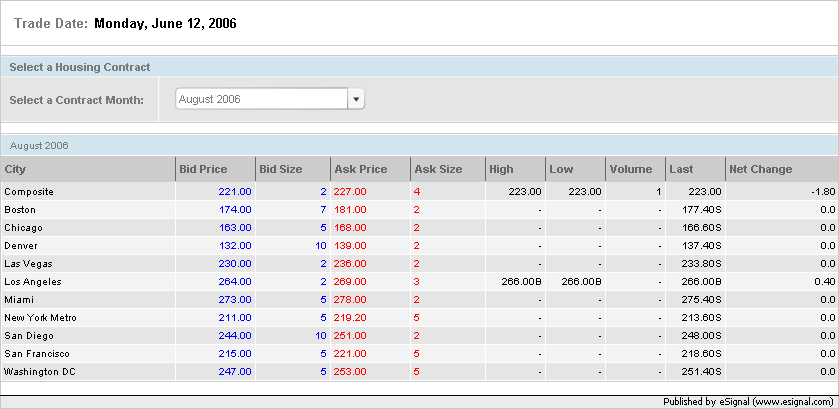
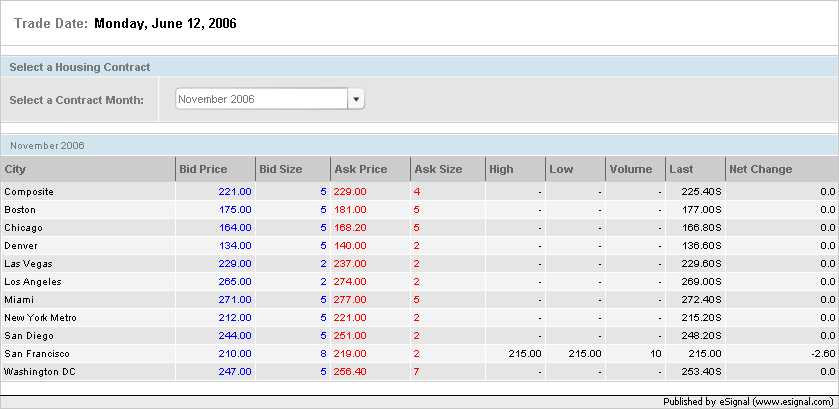
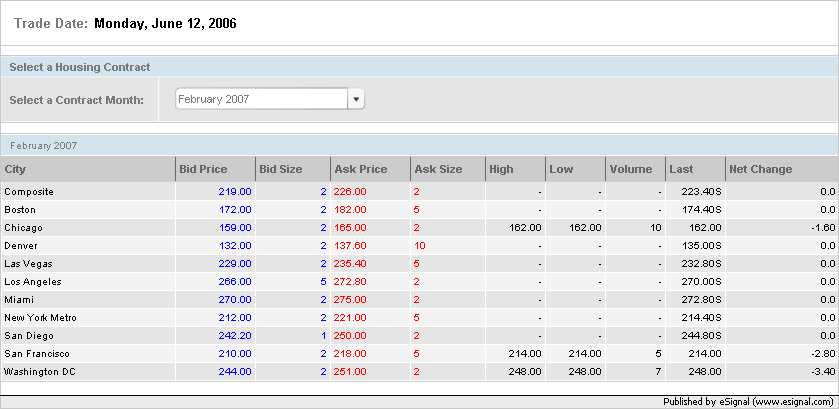
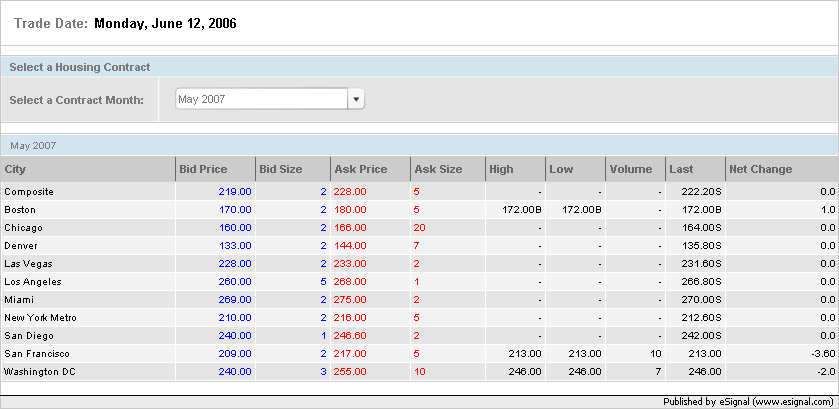
Chart showing the housing futures out to 1 year:
Future US House Prices
(updated today with today's prices and a write up.)
Future US House Prices
(updated today with today's prices and a write up.)
Emini Day Trading /
Daily Notes /
Forecast /
Economic Events /
Search /
Terms and Conditions /
Disclaimer /
Books /
Online Books /
Site Map /
Contact /
Privacy Policy /
Links /
About /
Day Trading Forum /
Investment Calculators /
Pivot Point Calculator /
Market Profile Generator /
Fibonacci Calculator /
Mailing List /
Advertise Here /
Articles /
Financial Terms /
Brokers /
Software /
Holidays /
Stock Split Calendar /
Mortgage Calculator /
Donate
Copyright © 2004-2023, MyPivots. All rights reserved.
Copyright © 2004-2023, MyPivots. All rights reserved.