Pitbull setup Part II
To be honest I donot know if I will be able to articulate this but I will try. This is probably more of a concept then a setup and today wasn't the perfect day but I'll attempt it anyway. Some key ideas 1) many Market profile users and traders consider areas on a price that have not been traded at on the same day more than once to be areas of low volume ( You may need to study the Single print concept to really get this) but I have noticed on the one minute time frame that prices actually push away from other prices on High Volume and you will not see price bar overlap on the one minute....some examples from today may help...but you have been warned....
You will notice on the far right of the screen that prices broke down on high volume...and left an area that was pushed away from rather quickly. Well the point of this post is to demonstrate that on many days these areas are tested as if the market particpants are saying " Hey, they broke it down from here before , lets see if they can do it again."....so from this chart you can see that the 1435 -1435.25 area was pushed away from fast. That being the case this High Volume area will need to be tested....so here is what happened soon after
Notice how the market comes back up to test this area..
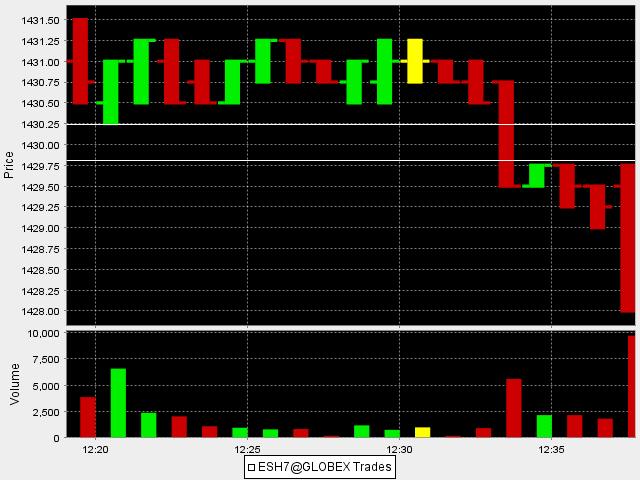
Later on in the day we get another push down on high volume here is a shot of that..notice the horizontal lines drawn at the 1429.75 - 1430.25 area..there is no price bar overlap on this high volume push..so the theory being that this area should be tested...here is the push down
and here is the retest..
I have found that these are excellent areas to trade for..I have also found that on trend days this counter trend approach will kill you.
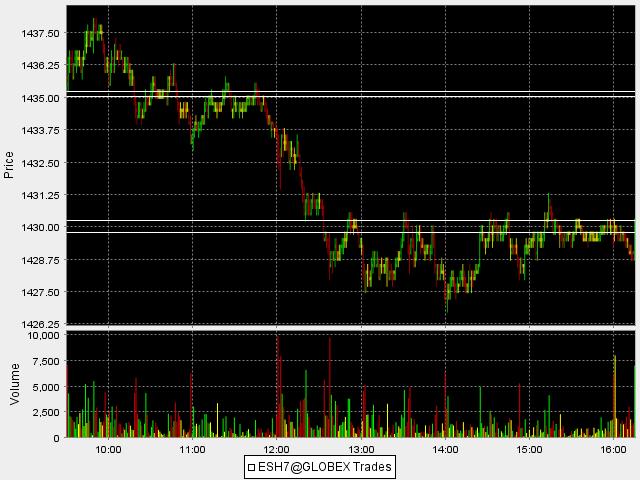
These high volume areas also become dynamic support and resistence areas for the rest of the day quite often...so here are those high push areas and how they affected the market for the rest of todays trading....this is the entire day with those horizontal push out areas left in place
Ask me questions if unclear as this is hard for me to put into words..it makes sense to me but we may need to view a few days before you can see what the H-E-L-L I'm writing about..
Bruce
Click image for original size
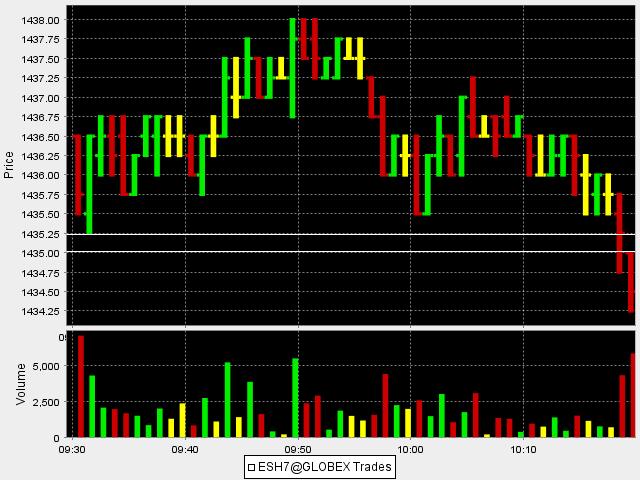
You will notice on the far right of the screen that prices broke down on high volume...and left an area that was pushed away from rather quickly. Well the point of this post is to demonstrate that on many days these areas are tested as if the market particpants are saying " Hey, they broke it down from here before , lets see if they can do it again."....so from this chart you can see that the 1435 -1435.25 area was pushed away from fast. That being the case this High Volume area will need to be tested....so here is what happened soon after
Click image for original size
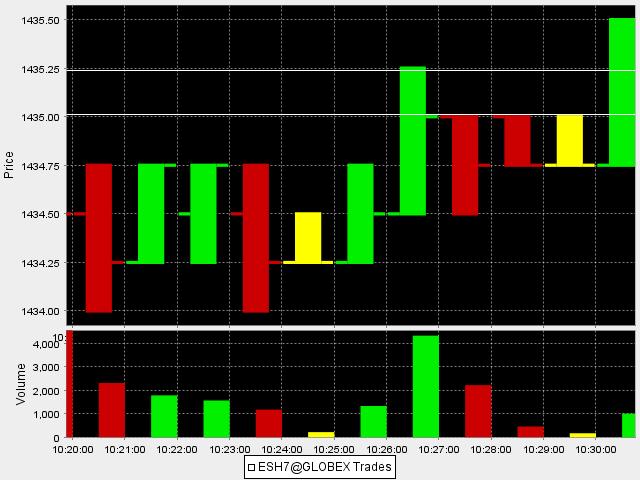
Notice how the market comes back up to test this area..
Later on in the day we get another push down on high volume here is a shot of that..notice the horizontal lines drawn at the 1429.75 - 1430.25 area..there is no price bar overlap on this high volume push..so the theory being that this area should be tested...here is the push down
Click image for original size
and here is the retest..
Click image for original size

I have found that these are excellent areas to trade for..I have also found that on trend days this counter trend approach will kill you.
These high volume areas also become dynamic support and resistence areas for the rest of the day quite often...so here are those high push areas and how they affected the market for the rest of todays trading....this is the entire day with those horizontal push out areas left in place
Click image for original size
Ask me questions if unclear as this is hard for me to put into words..it makes sense to me but we may need to view a few days before you can see what the H-E-L-L I'm writing about..
Bruce
Well, the overnight hi was 44.75 and we just hit the 36 so this is close enough......too bad I wasn't holding short still...lol.....
quote:
Originally posted by BruceM
I missed the last part but now there exists a band up near 45 - 46.25...It would be cool to start out Monday by filling in this band and then rolling over to get the 36...
Good market read!
Thanks DT, there is the 1445 officially hit in the day session. Seems like a good place for shorts with that gap down below....we'll see...there exists a band at the 41 area so that would make a good target if this market can get some steam together on the downside
Bruce
I had to edit this again as my own post made me laugh - Imagine a 4 point move is over half the average days range now and I say that you need "steam" to get to such a target. The bottom line is that these dimished ranges are pathetic.
Bruce
I had to edit this again as my own post made me laugh - Imagine a 4 point move is over half the average days range now and I say that you need "steam" to get to such a target. The bottom line is that these dimished ranges are pathetic.
quote:
Originally posted by day trading
Good market read!
Emini Day Trading /
Daily Notes /
Forecast /
Economic Events /
Search /
Terms and Conditions /
Disclaimer /
Books /
Online Books /
Site Map /
Contact /
Privacy Policy /
Links /
About /
Day Trading Forum /
Investment Calculators /
Pivot Point Calculator /
Market Profile Generator /
Fibonacci Calculator /
Mailing List /
Advertise Here /
Articles /
Financial Terms /
Brokers /
Software /
Holidays /
Stock Split Calendar /
Mortgage Calculator /
Donate
Copyright © 2004-2023, MyPivots. All rights reserved.
Copyright © 2004-2023, MyPivots. All rights reserved.