The "p" and "b" patterns
This is a question to all you MP pros out there...in Daltons new book and on various places on the internet ( this forum too) The "P" and "b" patterns are talked about. My question is this: Dalton says that when a "P" pattern forms then you can look for a retest of the "fat" part ( Largest tpo area/ High volume area) of the formation the next day. So if we open Higher look for sells and if we open below the "Bulge" of the "P" then look for buys....( reverse the concept for the "b" pattern).I'm wondering if anyone has found this to be true over time in the S&P's on a daily time frame? If not then have you found a longer term profile for this concept to be of greater statistical significance like the weekly profile etc.....thanks in advance
Bruce
Bruce
Any idea if Dalton came to those conclusions through back testing or visual observation?
I don't think it was backtesting...seems like only an observation based on the way it was worded in the book
quote:
Originally posted by day trading
Any idea if Dalton came to those conclusions through back testing or visual observation?
Here is a 3 day profile showing the "P" pattern. I'm not convinced that the upper extremes will be tested this week. I'm curious if anyone has found any good information on using longer term profiles? Please let me know if you have had any success in figuring out how to use longer profiles. Some use 5, 10, 20 days...some use weekly , monthly etc...
My take on these "P" profiles is that since the bigger volume is up top then that should act as resistance and drive the market lower....the other side of that is that the volume will act as a magnet and pull prices up.........I read somewhere that the pattern forms after an extended move and then the market retraces....AlleyB where are you? I wouldn't call a three day rally an extended move..
Anyway, here is my S&P chart....we have low volume at the 71 area and high volume at the 1381 so those would be the areas that I'm interested in....any thoughts???
Click image for original size

Bruce, hope you don't mind but I cropped your image down to a smaller size and removed all of that white space to the left.
My take on the b and P patterns is that if (1) the fat part of the curve was most recently traded in then the outer parts of the fat part will act as resistance (2) if the tail was last traded in then look for more extension in that direction. This is based on the theory that the market is most comfortable where it last traded which comes straight from the premise of the bell curve and why MP works. When we're herding we're going to stay in the middle for protection and so the edges are higher probability trades to come back to the middle when in the fat part.
My take on the b and P patterns is that if (1) the fat part of the curve was most recently traded in then the outer parts of the fat part will act as resistance (2) if the tail was last traded in then look for more extension in that direction. This is based on the theory that the market is most comfortable where it last traded which comes straight from the premise of the bell curve and why MP works. When we're herding we're going to stay in the middle for protection and so the edges are higher probability trades to come back to the middle when in the fat part.
thanks DT...please let me know how to crop the chart and I'll take care of them...I'm not familiar with IRT's screen captures...yet......seems logical to me that if we are trading near the 71 area then we could be buyers......interesting how overnight so far has highs and lows at the 81 and 71 areas.....I'm expecting some back filling to upside....to fill in that distribution a bit....
For cropping images I use Paint.net. It's a great free utility for doing that. Open the image in Paint.net. Use the top left hand tool to activate the select cursor. Select the area you want to keep and then press Ctrl+Shift+X and it will reduce the image to that size.
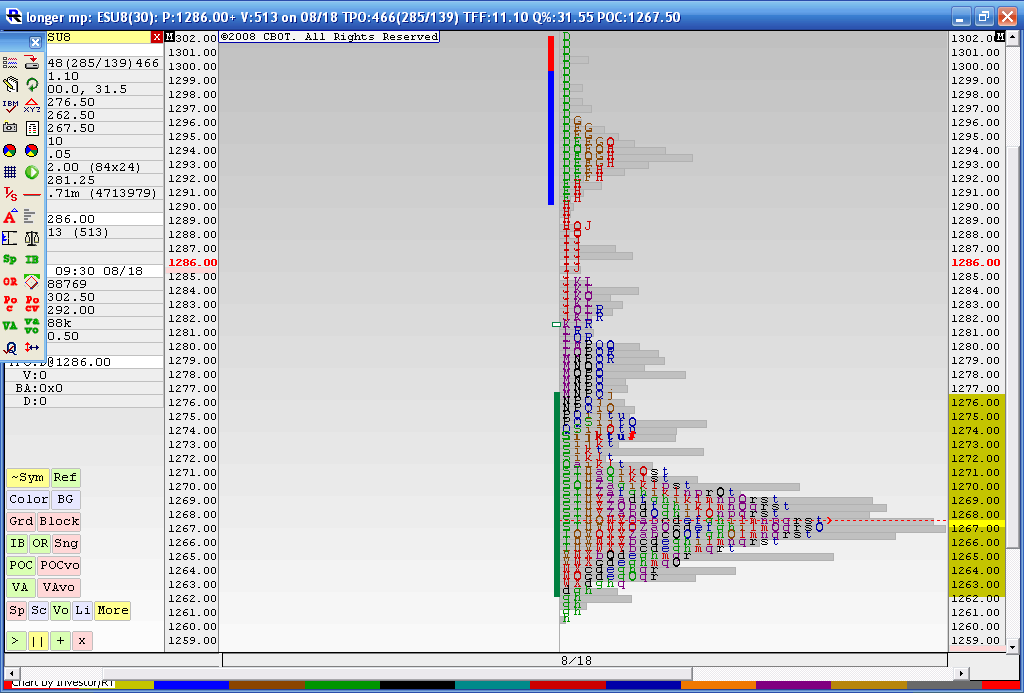
here is the 'b' pattern which I ran before the Thursday trading day////
On Thursday the S&P traded up into the 1282 area and now on Friday we have traded as high as 1288.50 in the overnight...
So they are "Filling it in"
On Thursday the S&P traded up into the 1282 area and now on Friday we have traded as high as 1288.50 in the overnight...
So they are "Filling it in"
Click image for original size
Here a nifty tool for any screen capturing, I gave to the forum years back......MWSnap... clean and user friendly, I'm using it for 6 yeas now.
http://www.mirekw.com/winfreeware/index.html
http://www.mirekw.com/winfreeware/index.html
I can't get charts posted on this but on 2-13-08 we had a late day rally and formed a 'b' pattern on the daily chart closing on the highs of the day...this came off of a three day decline. The interesting part is that in the overnight we went back and forth in an 8 point range up against a minor number I have been watching .....the 840.......
The point is if we combine the late day rally and the overnight we form just the opposite , the 'p' pattern. My guess is that we will need to fill in the lower volume sections of the two patterns once the day session opens on the downside. In other words I'm not planning on following any extension up ( Not going long) this morning but it will be interesting to see what actually happens Theory is fun but reality is quite different sometimes as we all know...
The point is if we combine the late day rally and the overnight we form just the opposite , the 'p' pattern. My guess is that we will need to fill in the lower volume sections of the two patterns once the day session opens on the downside. In other words I'm not planning on following any extension up ( Not going long) this morning but it will be interesting to see what actually happens Theory is fun but reality is quite different sometimes as we all know...
This is what inspired me to write that last post.....the last thing to happen in the day session was an upside break away from value to form the "pole" section of the "b" pattern but the last thing to happen with the overnight session is the consolidation part that makes up a 'P' pattern.
An alternative view would be that the overnight is accepting the buying that occurred in the day session since it is consolidating at the highs instead of selling off..
An alternative view would be that the overnight is accepting the buying that occurred in the day session since it is consolidating at the highs instead of selling off..
quote:
Originally posted by day trading
Bruce, hope you don't mind but I cropped your image down to a smaller size and removed all of that white space to the left.
My take on the b and P patterns is that if (1) the fat part of the curve was most recently traded in then the outer parts of the fat part will act as resistance (2) if the tail was last traded in then look for more extension in that direction. This is based on the theory that the market is most comfortable where it last traded which comes straight from the premise of the bell curve and why MP works. When we're herding we're going to stay in the middle for protection and so the edges are higher probability trades to come back to the middle when in the fat part.
I was watching the ES on Globex 2 days ago..Feb 11 and on my dome there was a lot of traffic.
The ES movement may be tight or move up and down by a lot of points...see the charts. The big boys have their men/women all over and screw with your mind. How else they going to make money? When you have the book, you can gap up or down, move up and down by a lot of points.Check the globex..you can see it.
You have to think like them even though you may know the numbers.
The ES...daily chart has been in a channel, so the highs and lows were easy pickings on a weekly basis. I'm expecting it to break to upside....until April. I could be wrong.
Given the last reversal +1 I was expecting the ES to zoom up becasue we had a nice WW pattern on the 15 min. However it went down. This is the first time I watched the dome...and it helped me. Plus 831 area was my special time... and they hesitated there...played the game....and dropped like a rock at the end.
Now I'm expecting ES and all other to go up till Apr time. So the reversal days may be up days.
Oh yes...I could be wrong.
Good luck
Emini Day Trading /
Daily Notes /
Forecast /
Economic Events /
Search /
Terms and Conditions /
Disclaimer /
Books /
Online Books /
Site Map /
Contact /
Privacy Policy /
Links /
About /
Day Trading Forum /
Investment Calculators /
Pivot Point Calculator /
Market Profile Generator /
Fibonacci Calculator /
Mailing List /
Advertise Here /
Articles /
Financial Terms /
Brokers /
Software /
Holidays /
Stock Split Calendar /
Mortgage Calculator /
Donate
Copyright © 2004-2023, MyPivots. All rights reserved.
Copyright © 2004-2023, MyPivots. All rights reserved.