Multi - day profiles
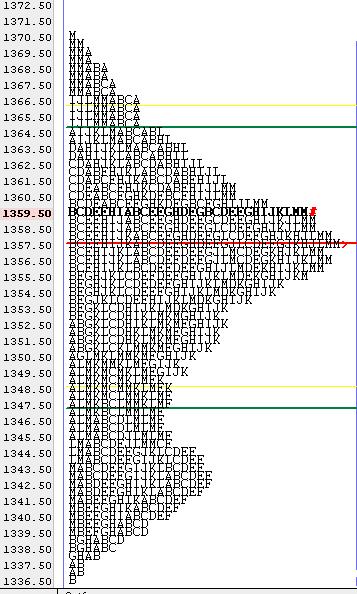
Eventually I'd like to kick off a discussion on multi - day profiles....for now here is a composite of the ES that formed during that recent consolidation that began on February 6th....Currently the Es is hitting against the 1357 area as I type in the overnight session. It will be interesting to see what happens from here.
My guess is that the long side is going to take hold but please make any comment you care to. I know some use a fixed amount of days and others will use ranges......I'd like this thread to eventual fiqure out what would be more practical. My hunch is that using a fixed time will NOT be the best way to go but I'm certainly no expert....
My guess is that the long side is going to take hold but please make any comment you care to. I know some use a fixed amount of days and others will use ranges......I'd like this thread to eventual fiqure out what would be more practical. My hunch is that using a fixed time will NOT be the best way to go but I'm certainly no expert....
Click image for original size
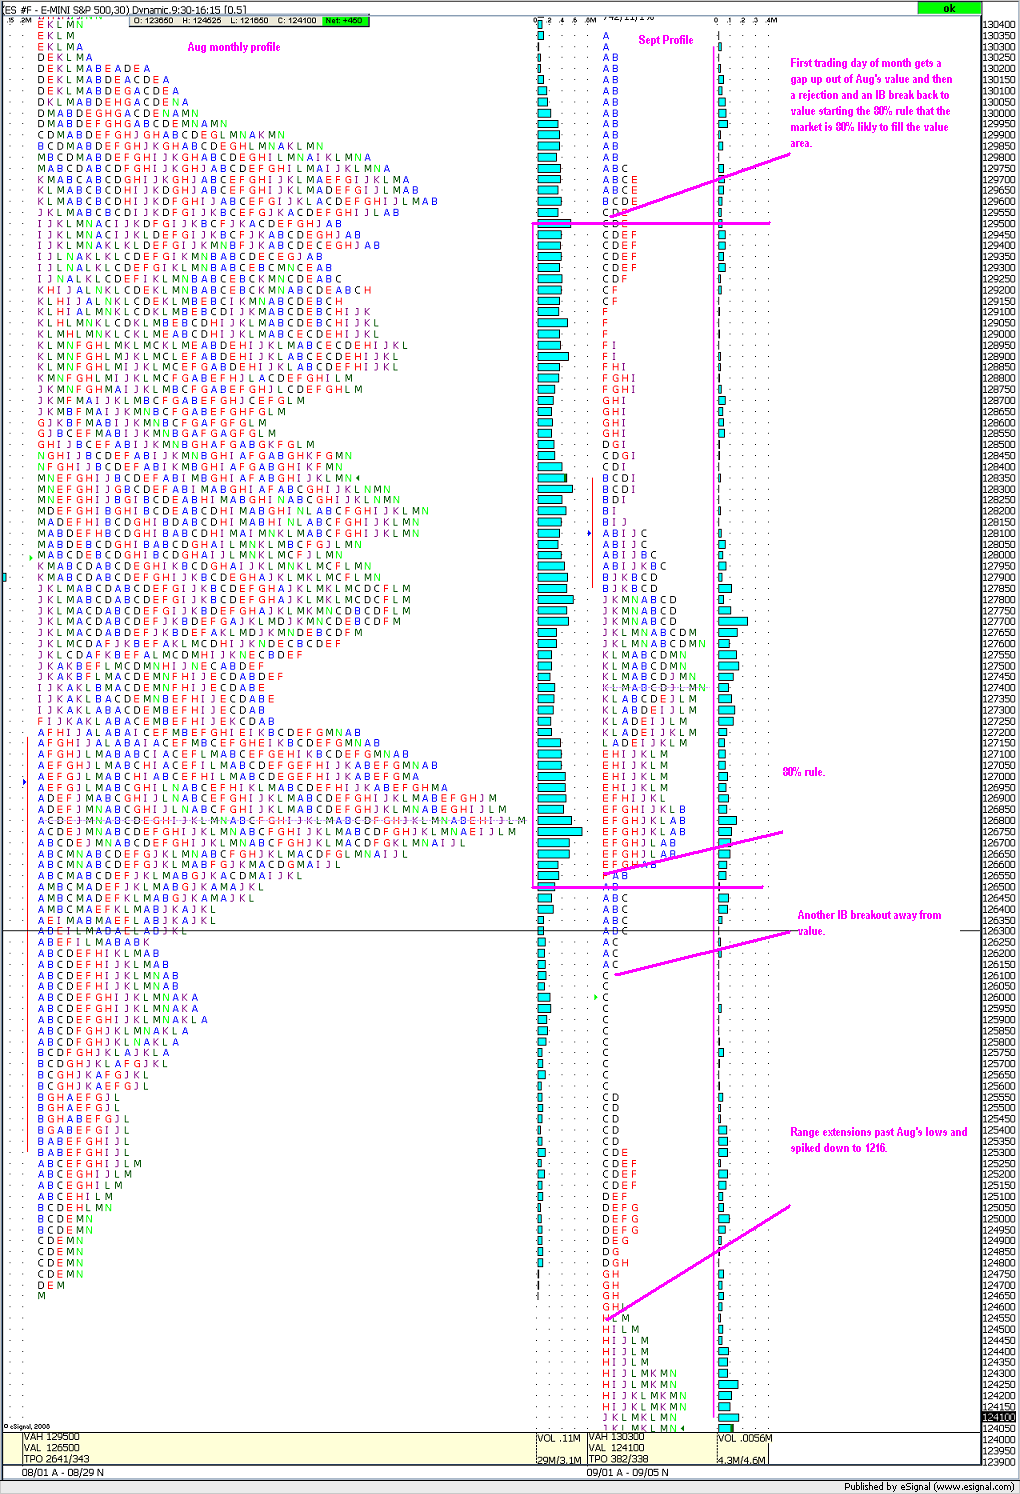
Once again you can refer to the charts on 9/02 and 8/29 all tetter totter on the monthly VA extreams and then break it on the "C"
Click image for original size
Not really much to mention on Sept 5 fridays trading, but we did close at the value area low on the monthly profile. I'll be watching the IB breakout monday as long as its in the monthly Value for the upside and below value and away from value for the downside.
Click image for original size
well done Joe...thanks once again....now I'd really like to know if the big players watch daily closes if they are using longer term profiles...or if they still "dial it down" to a lower time frame to reduce risk....
Joe, It will be interesting to see how the August numbers come into play....the challenge I have with the longer term stuff is trying to fiqure out which are the best numbers to use.....I posted some numbers here..
http://www.mypivots.com/forum/topic.asp?whichpage=1&TOPIC_ID=3246#16030
but they don't completely match up with the longer term August profiles, mine are from last weeks trading....they are close but far from perfect....
http://www.mypivots.com/forum/topic.asp?whichpage=1&TOPIC_ID=3246#16030
but they don't completely match up with the longer term August profiles, mine are from last weeks trading....they are close but far from perfect....
Its because its set on .50 instead of .25, I did that so I could fit more profile on the chart. It took the high volume from 76.75 and added it to the next tick up making 77 the VWAP. I haven't used volume that much, other than the VWAP, but I found that the DVAL and DVAH are suburb intra day S/R and short term market direction (ex. coming up off the Monthly VAL and heading towards the DVAH)
I have mine set to 1.0 just so I can view the whole chart...IRT needs to clean up their MP charts a bit....thanks for the reply and good luck on the short side....I gotta sleep tonight....
quote:
Originally posted by CharterJoe
Its because its set on .50 instead of .25, I did that so I could fit more profile on the chart. It took the high volume from 76.75 and added it to the next tick up making 77 the VWAP. I haven't used volume that much, other than the VWAP, but I found that the DVAL and DVAH are suburb intra day S/R and short term market direction (ex. coming up off the Monthly VAL and heading towards the DVAH)
BUMP for bruce....
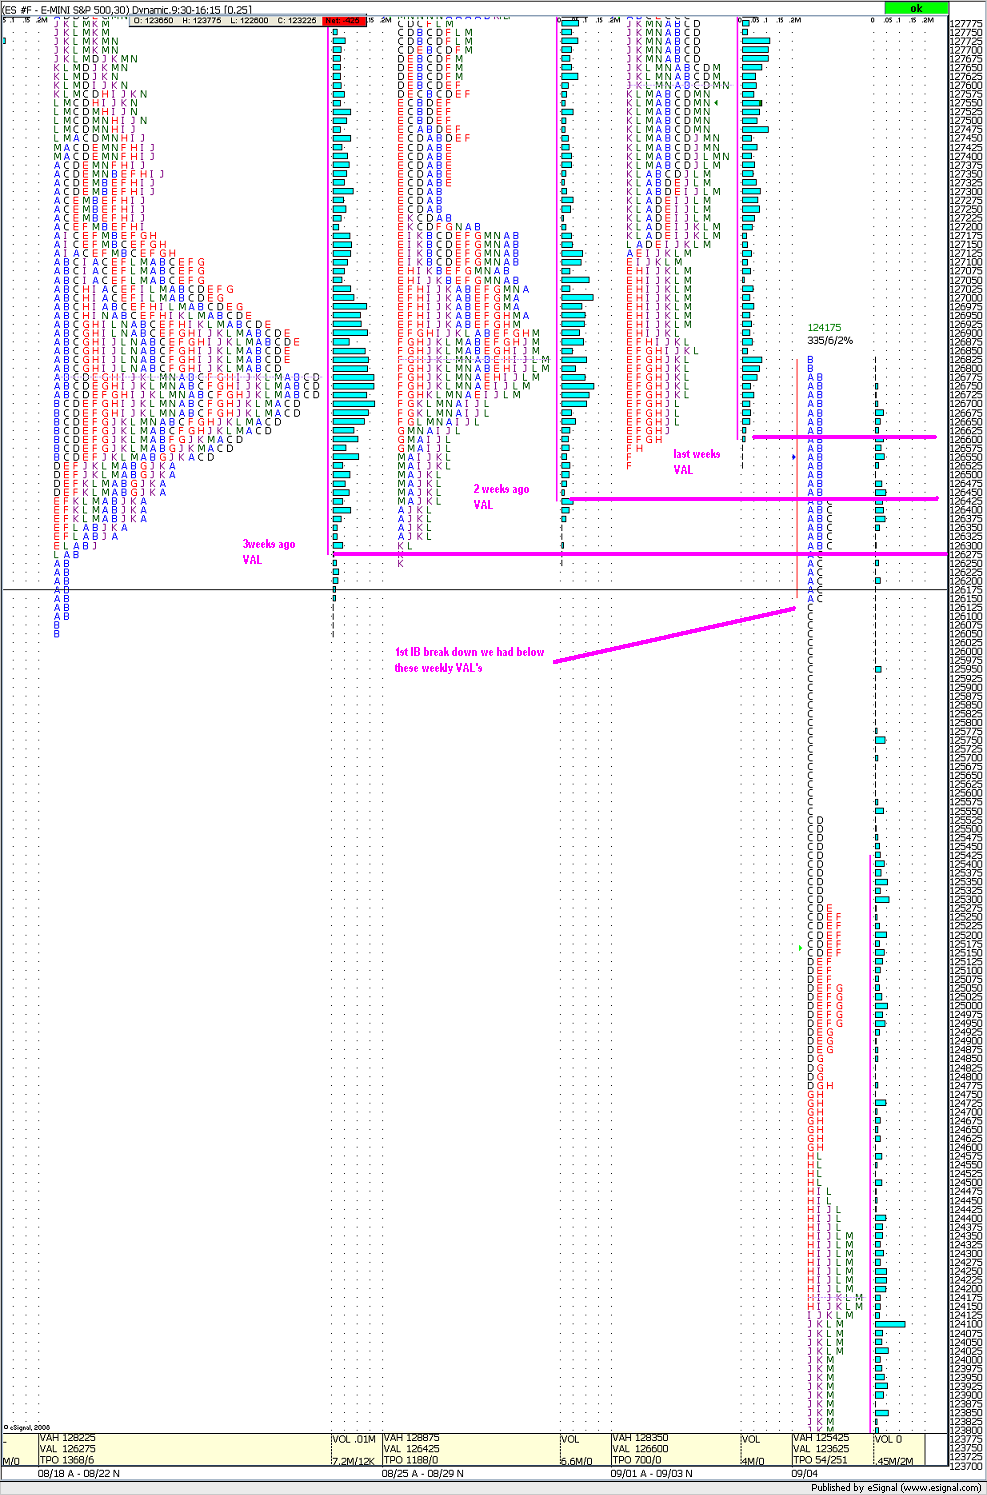
Are these what you were talking about? The number one thing I look for is a penetration in the IB within the first hour not after (thats the A and B has to break the resistance or support) and then a break in that direction. Like the first chart the IB broke 3 weeks VAL's and then broke the IB and tanked 40 points, I remember that trade.
Are these what you were talking about? The number one thing I look for is a penetration in the IB within the first hour not after (thats the A and B has to break the resistance or support) and then a break in that direction. Like the first chart the IB broke 3 weeks VAL's and then broke the IB and tanked 40 points, I remember that trade.
Emini Day Trading /
Daily Notes /
Forecast /
Economic Events /
Search /
Terms and Conditions /
Disclaimer /
Books /
Online Books /
Site Map /
Contact /
Privacy Policy /
Links /
About /
Day Trading Forum /
Investment Calculators /
Pivot Point Calculator /
Market Profile Generator /
Fibonacci Calculator /
Mailing List /
Advertise Here /
Articles /
Financial Terms /
Brokers /
Software /
Holidays /
Stock Split Calendar /
Mortgage Calculator /
Donate
Copyright © 2004-2023, MyPivots. All rights reserved.
Copyright © 2004-2023, MyPivots. All rights reserved.