Short Term ES cycles.
Click image for original size
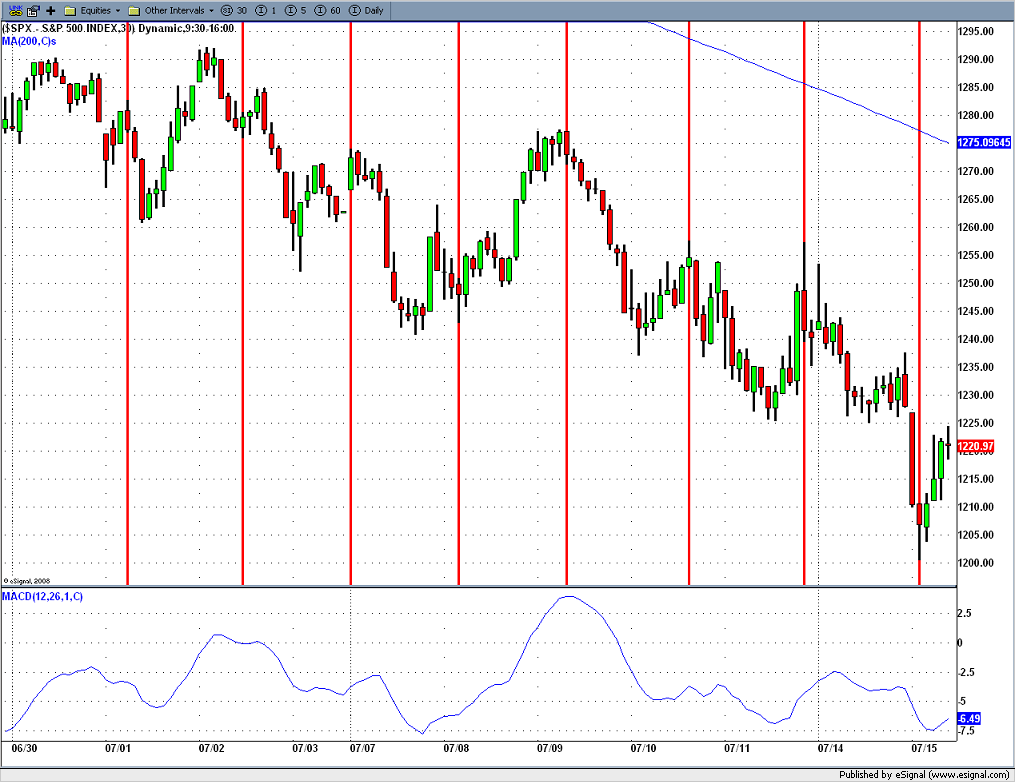
Each one of these red lines is 16-30min bars this cycle has been lasting at least since late 06. Next reversal is due at 11:30 tommorow 7/16.
Next cycle due @ 1:00 30min bar.
Click image for original size
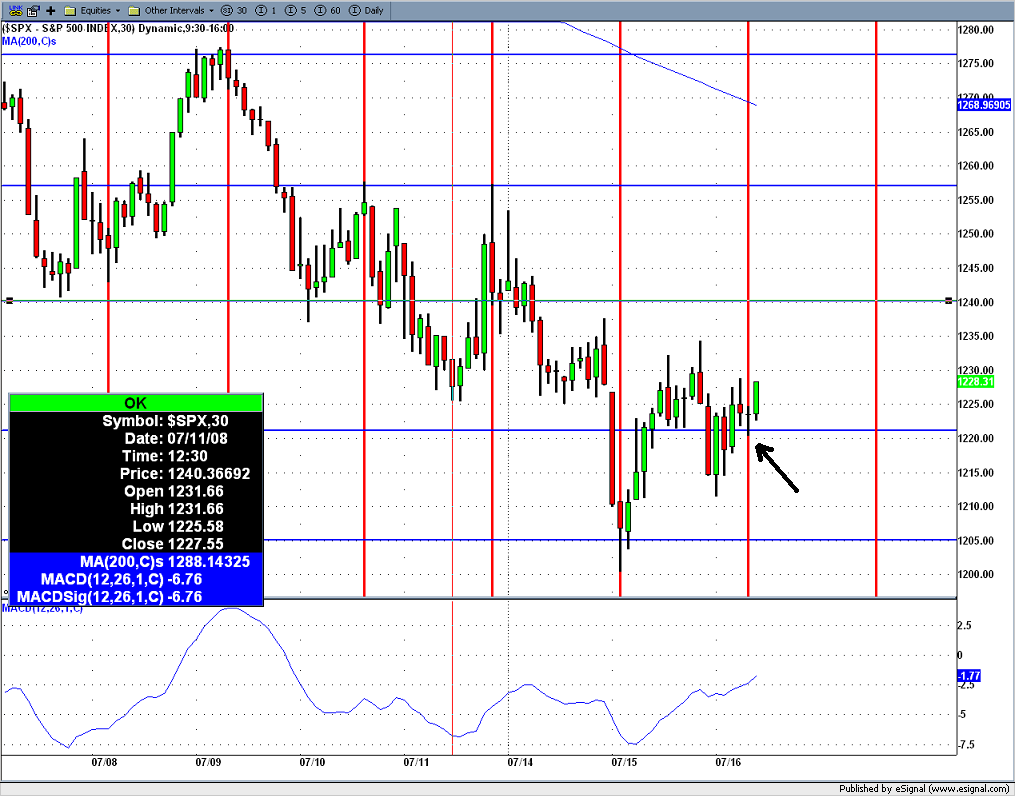
1:00 tommorow thursday 7/17 not today @ 1:00.
Great Call Joe!!!
Another Great Call 1pm
Next one is @ 2:30 July 18th.
Joe, how do you calculate the cycle's duration?
Thanks!
Thanks!
I'ld be interested in learning how to time forecast as well, Joe. Keep in mind I'm not asking for the keys to the kingdom, just some direction. Thank you in advance.
Thanks for the intrest,
But I really cannot expalin it in a couple of minitues how it works or why and how to figure it. I had taken the J.M Hurst cource a couple of years of years ago (200 hour cource) and turned it into an very short term indicator. Here is a link to the basics if your interested I would buy one of hursts books and stronlgly advise you to do hand drawn charts if your interested. this is a very powerful to to be addded to any good price tools. Sorry I couldn't directly answer your question but there's no easy way to expalin it, the good news is once you've done all the work it last forever and never changes. The same cylce I use now worked in the 60's when Hurst was selling his cources. You can search these books on AMZN...channels and cycles: a tribute to J.M. Hurst......And Cyclic Analyiss bu J.m. Hurst....both are just a few bucks. But if you really want to get your feet wet I'd get the cource. But its a lot of work.
http://marketscalpel.com/approach/cycleTheory.htm
Make sure to click that link in the link.
Joe; Would you post one more?
well done Joe..I think most underestimate these lines
Emini Day Trading /
Daily Notes /
Forecast /
Economic Events /
Search /
Terms and Conditions /
Disclaimer /
Books /
Online Books /
Site Map /
Contact /
Privacy Policy /
Links /
About /
Day Trading Forum /
Investment Calculators /
Pivot Point Calculator /
Market Profile Generator /
Fibonacci Calculator /
Mailing List /
Advertise Here /
Articles /
Financial Terms /
Brokers /
Software /
Holidays /
Stock Split Calendar /
Mortgage Calculator /
Donate
Copyright © 2004-2023, MyPivots. All rights reserved.
Copyright © 2004-2023, MyPivots. All rights reserved.