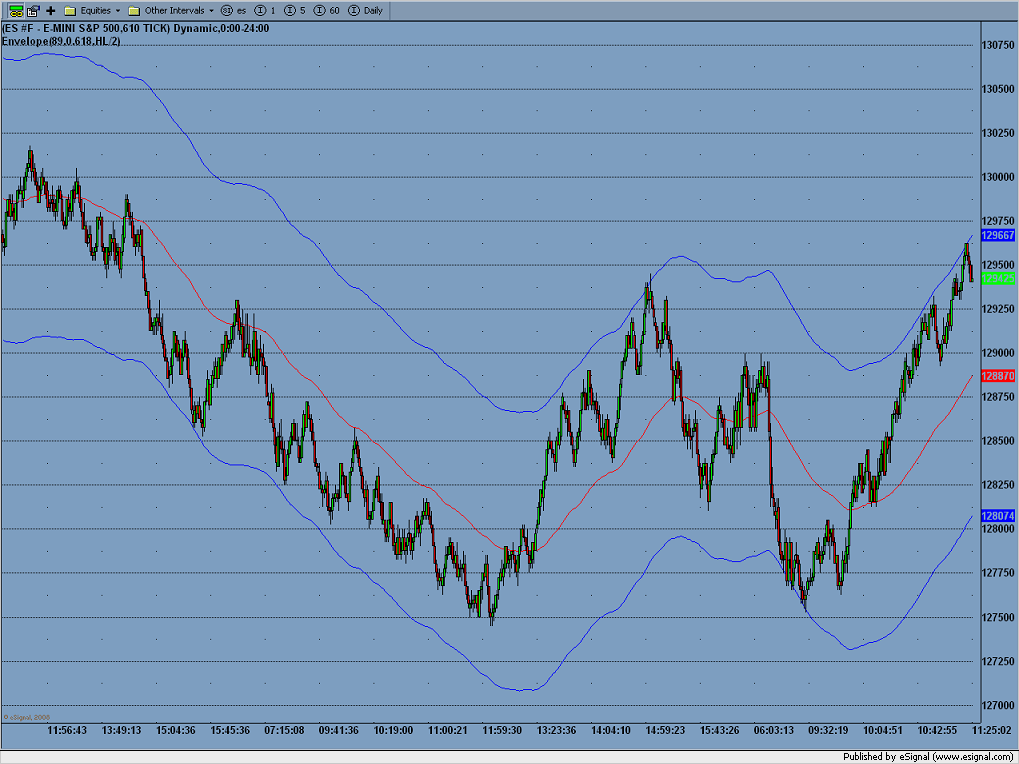
Channel surfing the ES
This is by no means a buy/sell black box system but is a set of EMA parameters that alert me to a coming movement. Picture it like this the red line is the pivot point, the blue are the extreams like a dog on a rubber leash it'll go back and forth. from blue to red to red....
Parameters are 610 tick chart 89 period EMA with a H/L divided by 2 EMA, off set .618% enevolpe....
I am still searching for a good enevolpe for my bread and butter 30min ES chart.
Parameters are 610 tick chart 89 period EMA with a H/L divided by 2 EMA, off set .618% enevolpe....
I am still searching for a good enevolpe for my bread and butter 30min ES chart.
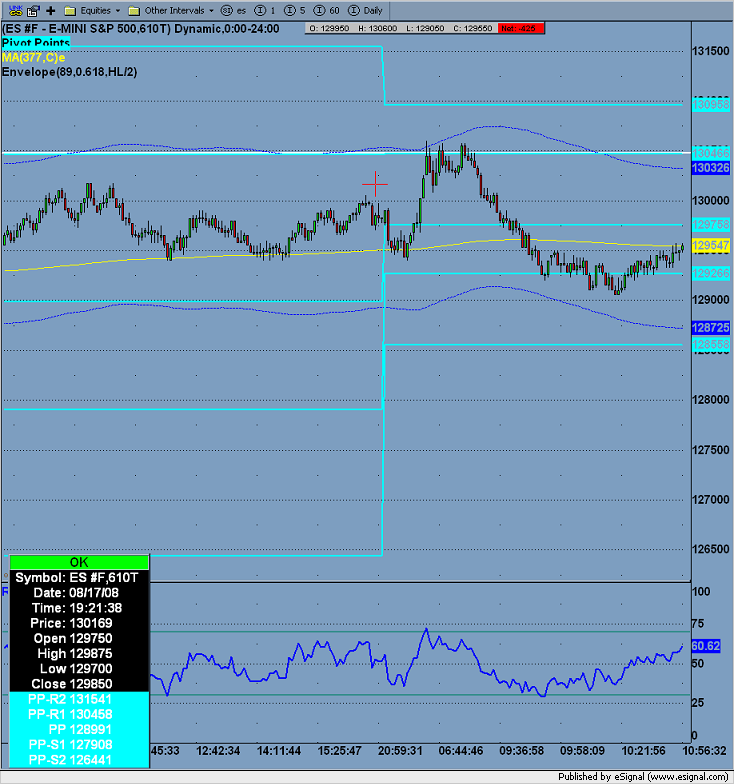
Click image for original size
Here's an updated chart
Click image for original size

That's neat, Joe.
This 89 EMA (close) also works wonders on a 1 min. chart. But I can't generate these envelope as my trading platform has only Bollinger bands. Any advise on their settings that can correspond to your envelops
What platform are you using?
A tweak shouldn't be hard to come up with for bollinger bands if the OP doesn't have one. The only difference between the two is BBs use a standard deviation and the envelope a fixed percentage.
If we find out what platform is being used I can probably find plug and play code on the net as a first option.
We really should bang this one out all across the board for everyone because I immediately rid my rig of a lot of analysis paralysis junk in favor of the envelope, and a few choice charts and indicators.
Thanks for the offering, Joe.
I tried a number of parameters, none came close. Thats odd becuause every platform I have used always had envelopes.
Your welcome SPQR....make sure to use a tick chart, gaps mess it up. ans normal min charts mess it up on the globex And also like anything else, this like all things shouldn't be traded as a stand alone, steps should always be taken to avoid tunnel vision, but not to much to cause paralsis.
@kbi - Does your charting platform allow you to vertically offset your lines? If so then add 2 more EMA lines with the same settings and vertically offset them, one up and one down, using the 0.618% that CharterJoe is using.
@CharterJoe - Have you ever tried using volume charts instead of tick charts? I agree that tick are better than time but also think that volume are better than tick...
@CharterJoe - Have you ever tried using volume charts instead of tick charts? I agree that tick are better than time but also think that volume are better than tick...
I agree DT. On a suggestion I nearly replaced my 5000T and 10000T with a 10000V, and, it seems to be more manageable swing channel tagging than a 10 minute chart. It's looking promising being really useful using Joe's parameter, too.
Give that number a try if you haven't already.
Give that number a try if you haven't already.
Emini Day Trading /
Daily Notes /
Forecast /
Economic Events /
Search /
Terms and Conditions /
Disclaimer /
Books /
Online Books /
Site Map /
Contact /
Privacy Policy /
Links /
About /
Day Trading Forum /
Investment Calculators /
Pivot Point Calculator /
Market Profile Generator /
Fibonacci Calculator /
Mailing List /
Advertise Here /
Articles /
Financial Terms /
Brokers /
Software /
Holidays /
Stock Split Calendar /
Mortgage Calculator /
Donate
Copyright © 2004-2023, MyPivots. All rights reserved.
Copyright © 2004-2023, MyPivots. All rights reserved.