Daily Market Profiles on ES
Click image for original size
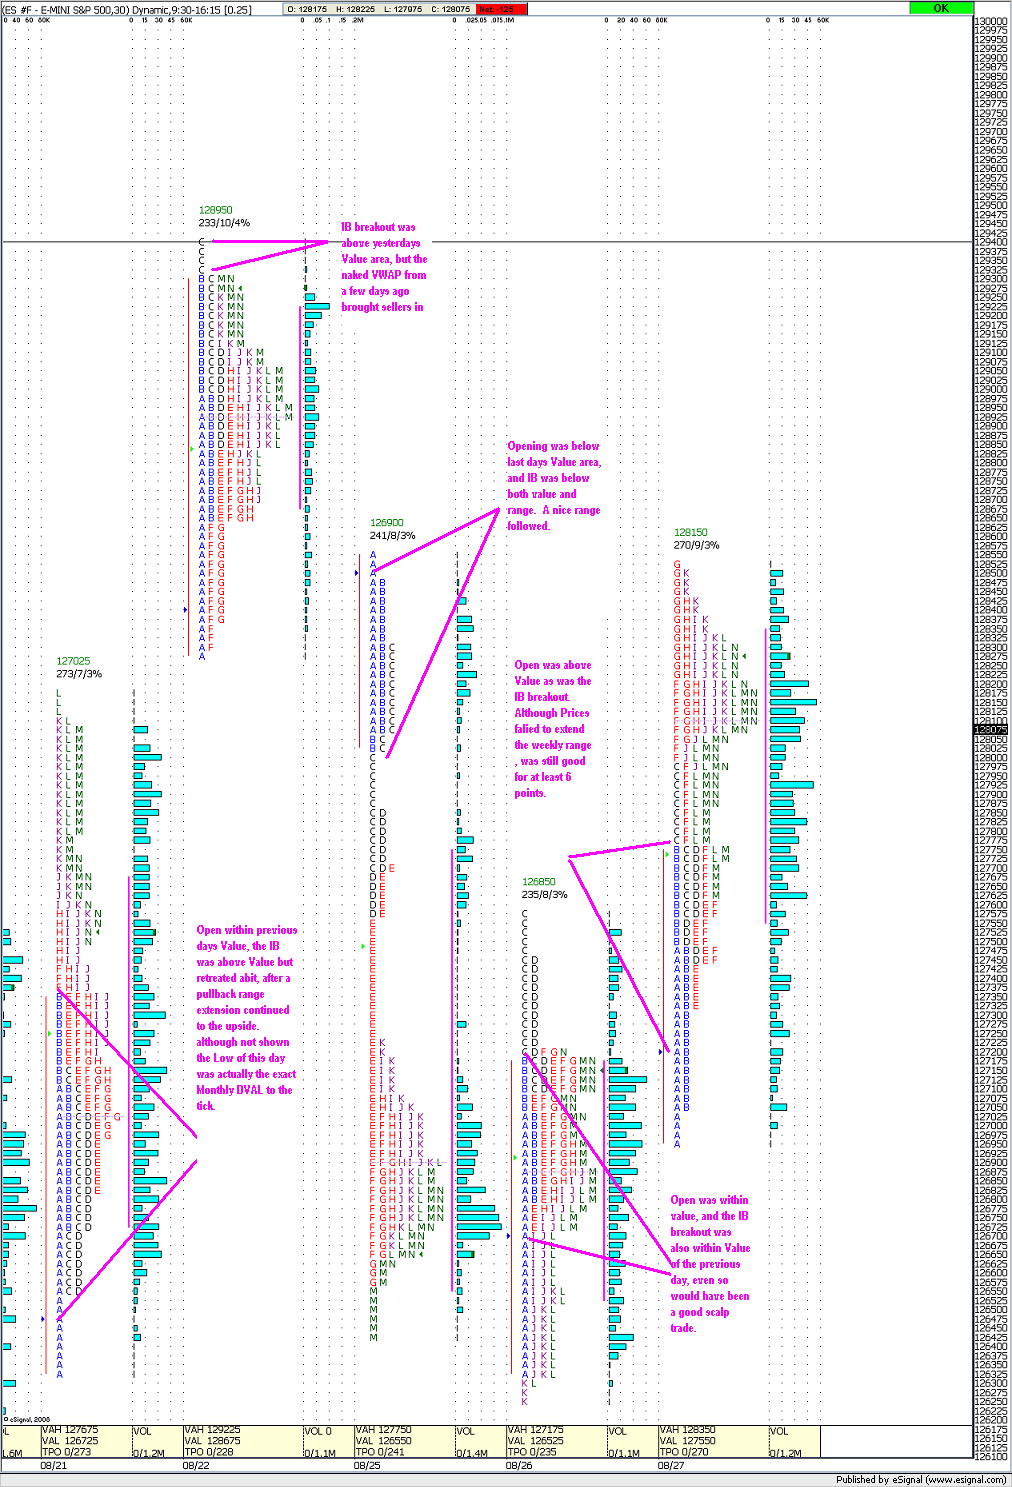
8/21 low was exact tick of monthly DVAL
8/22 High was 2 points within the monthly DVAH
8/23 Low was exact tick of the monthly DVAL
8/26 Low was 5 ticks below monthly DVAL
Sooo are we going to make it back to 94 before the end of the month???
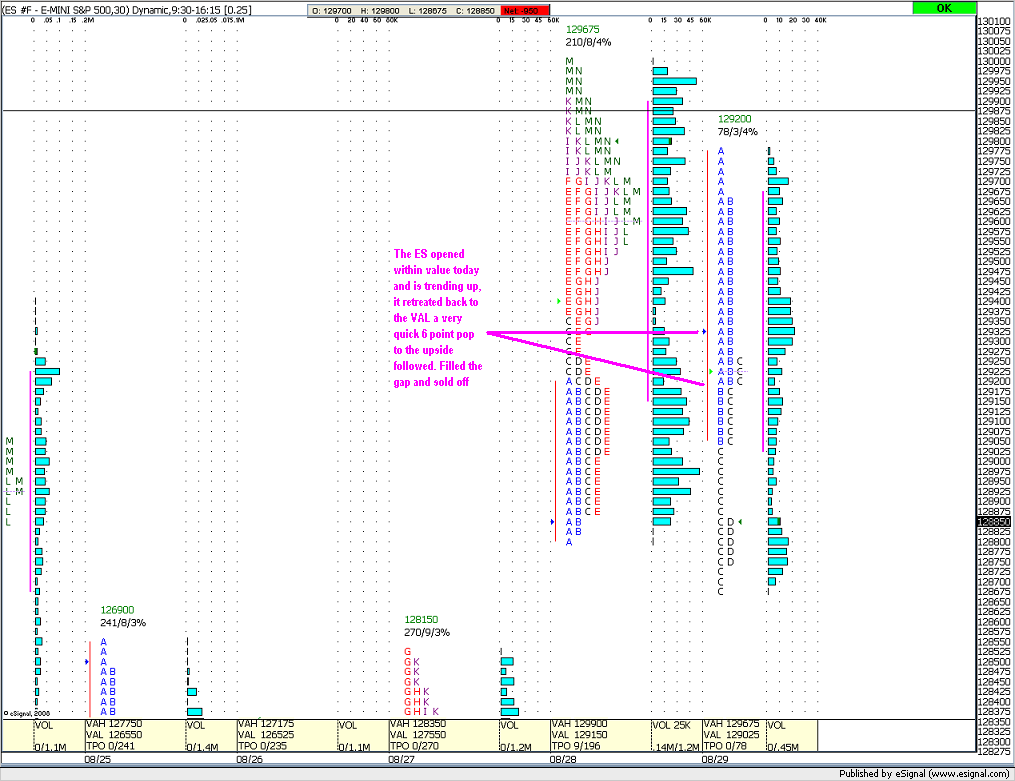
Volume was lower today than yesterday, even though we moved highier, and value rose...
I'll be watching to see which way we test the buldge in the "p" formation yesterday...( this implies lower trading in general but the billion dollar question is WHEN)....so a higher open implies lower trading......a lower open implies we run up to test the buldge from below...
Click image for original size

Click image for original size

Here's the finished product. 6 range estensions in the direction of the gap. Slow but steadiy day up.
thanks Joe.....This shows another "P" pattern.....I think the last two days have actually shown the smart money as sellers...but even a broken watch is correct twice a day.....my point is that we can have expectations that don't always get met with the trades we take...I'd like to be like a "reed in the breeze" but I usually have a bias....today it will be short again...93.75 - 95.50 is the tricky zone......thanks for taking the time with the charts..
You would be better off watching cumulative ticks close on the nyse. Anytime the tick are 800 or more on the close there has been a significant decline begining within two days.I believe this has happened every time going back to 2002.On Aug.26 the ticks closed at 1059.(declines of 20-50 points are indicated.)Also watch the nasdaq.Rember 2days ago the dow and s&p500 were slightly positive but the nas. was negative?
Click image for original size
quote:
Originally posted by koolblue
You would be better off watching cumulative ticks close on the nyse. Anytime the tick are 800 or more on the close there has been a significant decline begining within two days.I believe this has happened every time going back to 2002.On Aug.26 the ticks closed at 1059.(declines of 20-50 points are indicated.)Also watch the nasdaq.Rember 2days ago the dow and s&p500 were slightly positive but the nas. was negative?
Thanks Kool; I watch these areas also. I just think it's interesting
when I put the ES & QM side by side to see the price action
Click image for original size
Some of the same stuff, we actually traded down to 45.5 area after trading around yesterdays VAH in the IB and then broke down with the IB breakout. I like to see A and/or B penetrate the VAH or VAL and then a breakout in that direction, I use this for pivots and my other s/r lines. I like to see a penetration of the IB first it seems to yield better results.
That is just as I would have put it. I like to see a first hour penetration of any major S/R areas not just the MP VA. A good example is 9/04 when in the first hour we broke that critical 61-64 area pulled back a bit then busted through it at 10:00 or "C" a massive 15 point spike followed with little pull back, because the support had been validated in the first hour.
Emini Day Trading /
Daily Notes /
Forecast /
Economic Events /
Search /
Terms and Conditions /
Disclaimer /
Books /
Online Books /
Site Map /
Contact /
Privacy Policy /
Links /
About /
Day Trading Forum /
Investment Calculators /
Pivot Point Calculator /
Market Profile Generator /
Fibonacci Calculator /
Mailing List /
Advertise Here /
Articles /
Financial Terms /
Brokers /
Software /
Holidays /
Stock Split Calendar /
Mortgage Calculator /
Donate
Copyright © 2004-2023, MyPivots. All rights reserved.
Copyright © 2004-2023, MyPivots. All rights reserved.