Market Review
Since daytrading is not easy, I allways try to make possible scenarios as to what the market has made during the day and what to possibly expect for the next day also. I mainly trade using Elliott Waves (EW) with Fib numbers from projections and retracements, recently I have added the TTT book to help me have better chances as where the market might go during the day and I try to look for possible clusters zones from my Fib numbers and the TTT numbers highs and lows.
That being said I need to post more charts or keep on adding new threads until we get to that second page.
I sure do hope this will be very soon.
At last this is it.
I sure do hope this will be very soon.
At last this is it.
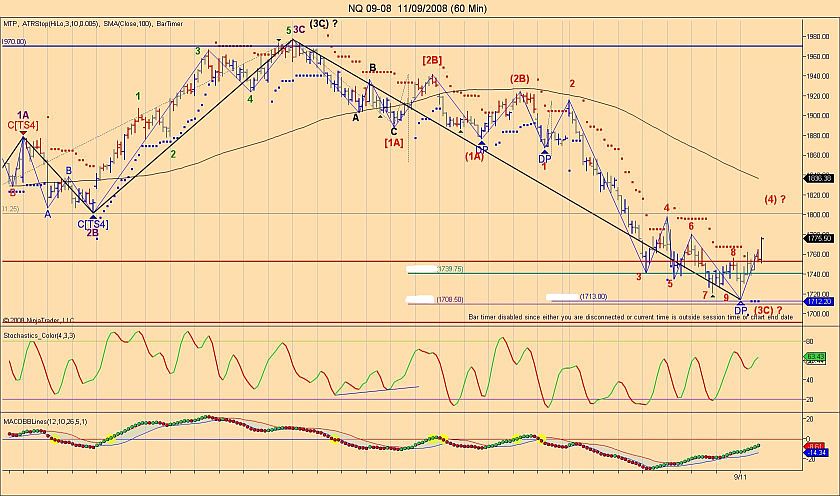
Some people may have noticed that I bought the NQ this morning and may wonder why did I bought this index instead of ES well a very simple reason this was the first chart that was ready for me to trade so I bought NQ instead of ES.
The odds were as good as the ES as we had achieved what I thought was an intermediate or major bottom as we were in a cluster are and I had a big MAC divergence also that was on from 3 days ago so the market was clearly oversold and was creaming to be bought. So once again based on my EW count some indicators and the TTT expected low being close to 1705 on the sept contract the odds were very big that a market rally would unfold unfortunately I was taken out on a profit order as I didn't had time to move it up as I was taking a live pic of the trade and after that I was too tired to trade again for the rest of the day as I had to finish up setting up all my charts as I mentioned before it is very hard to take pic's of live trade then post them. It will be more time consuming now that I need to reduce the charts so there might be more delays before I post a trade but I will try to always show you what are the possibilities as where the market can go but can't show the TTT odds and numbers for obvious reasons.
The odds were as good as the ES as we had achieved what I thought was an intermediate or major bottom as we were in a cluster are and I had a big MAC divergence also that was on from 3 days ago so the market was clearly oversold and was creaming to be bought. So once again based on my EW count some indicators and the TTT expected low being close to 1705 on the sept contract the odds were very big that a market rally would unfold unfortunately I was taken out on a profit order as I didn't had time to move it up as I was taking a live pic of the trade and after that I was too tired to trade again for the rest of the day as I had to finish up setting up all my charts as I mentioned before it is very hard to take pic's of live trade then post them. It will be more time consuming now that I need to reduce the charts so there might be more delays before I post a trade but I will try to always show you what are the possibilities as where the market can go but can't show the TTT odds and numbers for obvious reasons.
Click image for original size
Hi everyone I hope you all had a good trading day, I didn't trade today as I had a lot of things that needed to be done so the reason why I haven't posted much also.
I will post 3 charts with 3 different time frame and I will leave the post like that so if this brings interest to you please post in the Market Review comments sections and don't be shy to post your own wave counts as I am to open to any scenario you may have.
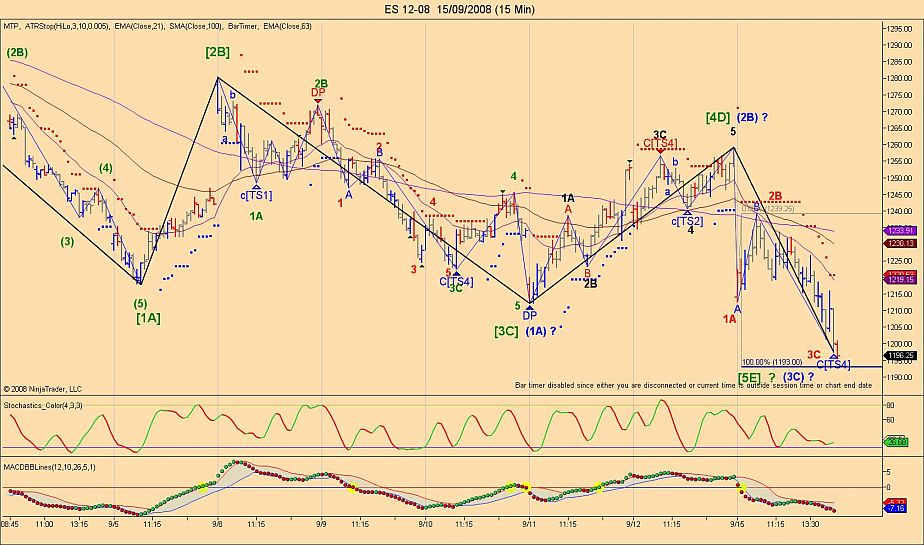
I will say that today was a sell short day and we found resistance on the 62% retracement on the 15 min charts it was also a 38 % retrace on the 60 min and we also had the first expected TTT high in that zone so this was a nice cluster zone to sell, as a matter of fact we did got a decline from it but market showed some strength as the possible B wave or wave 2.
Next resistance we see on the charts is at 1263 and 65 zone.
Have a nice weekend all.
I will post 3 charts with 3 different time frame and I will leave the post like that so if this brings interest to you please post in the Market Review comments sections and don't be shy to post your own wave counts as I am to open to any scenario you may have.
I will say that today was a sell short day and we found resistance on the 62% retracement on the 15 min charts it was also a 38 % retrace on the 60 min and we also had the first expected TTT high in that zone so this was a nice cluster zone to sell, as a matter of fact we did got a decline from it but market showed some strength as the possible B wave or wave 2.
Next resistance we see on the charts is at 1263 and 65 zone.
Have a nice weekend all.
Click image for original size
Click image for original size
Click image for original size
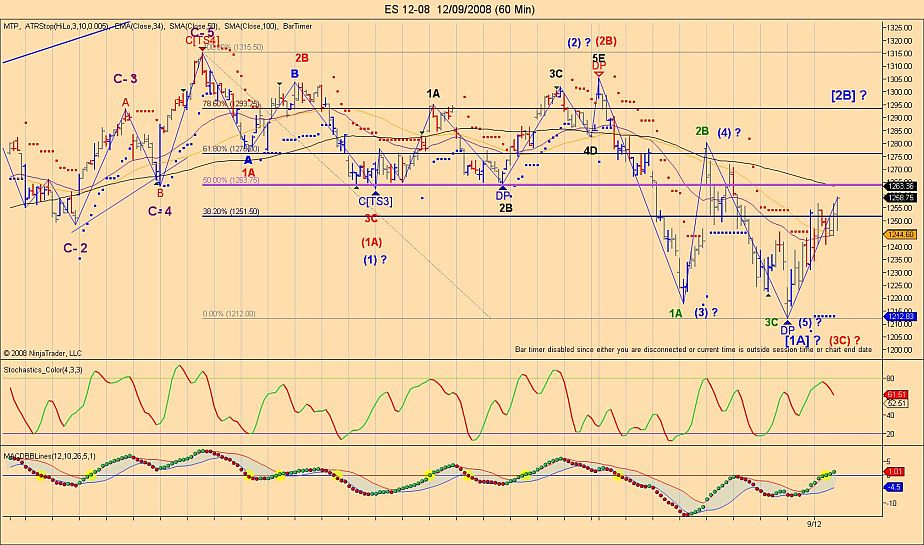
I forgot to mention that on the 60 min charts I have put 2 possible wave counts The Red is my preferred one but as usual I like to have more then 1 possible wave count so I added a blue one as this could be possible but less likely as in this scenario wave 4 would overlapped the low of wave 1 but that being said I have seen this happening before so we need to keep an open mind and bend the rules sometimes.
On the big time frame we have the same wave count then I posted previously ABC down with wave 1A and 3C having 3 legs in each of them and wave 2B consist of 5 waves overlapped same as and ABC.
So once again feel free to post in the Market Review comments section if you have any questions.
On the big time frame we have the same wave count then I posted previously ABC down with wave 1A and 3C having 3 legs in each of them and wave 2B consist of 5 waves overlapped same as and ABC.
So once again feel free to post in the Market Review comments section if you have any questions.
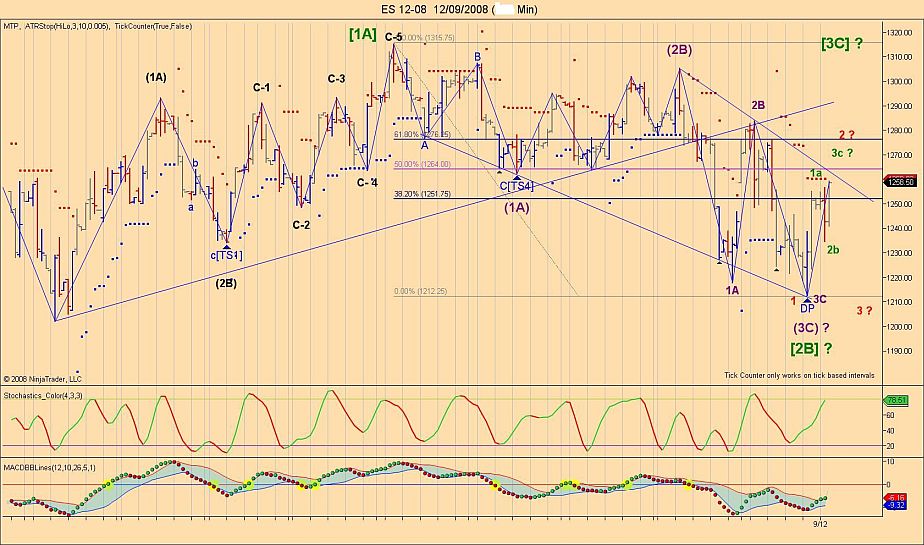
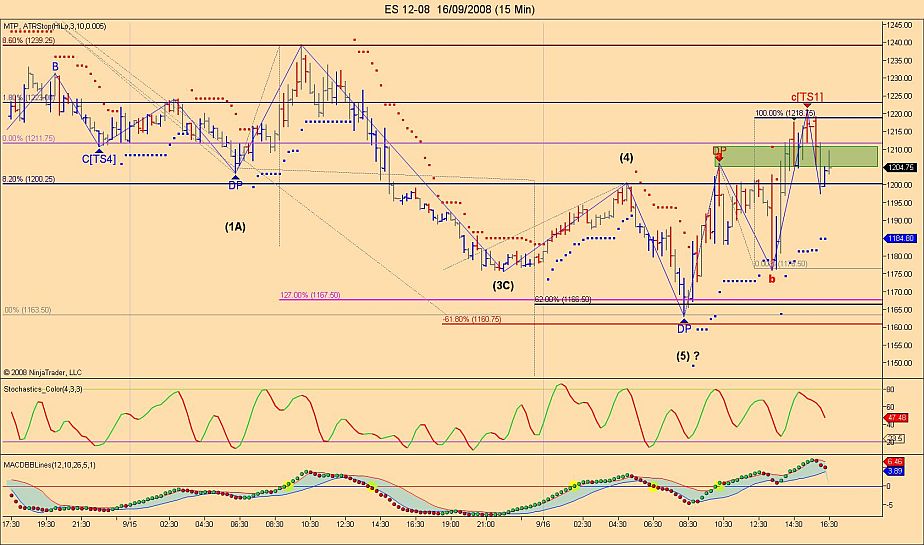
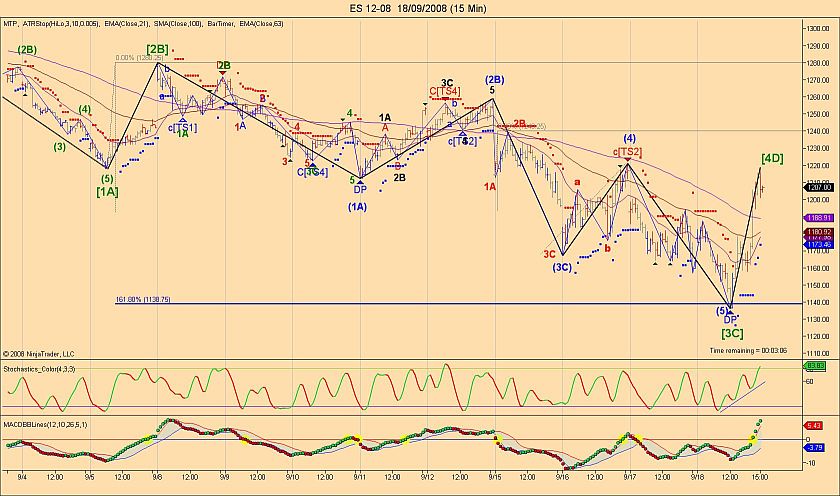
Hi All, the B wave low scenario has now been invalidated so we have no choice then take the bearish [1A] scenario with the alternate one more bearish also. I will only focus on the 15 min as this could become way too complicated to post the entire bearish count so we will concentrate on the shorter term time frame since this post is based on daytrading.
From this 15 min chart we can see that we have now 2 possibilities we are currently in wave [5E] (green label and that being said the last leg down seems to be subdividing and we would be in wave 3 so being in an impulsive wave down we should expect a wave 4 then wave 5 once wave 3 low is in place. The more bearish scenario would indicate that we have made [1A] [2B] (green label) then wave 3 would subdivide in 5 waves and we are now in wave 3 of (3C)? (blue label). I will have to study more my charts tonight but this is what I see for the moment.
From this 15 min chart we can see that we have now 2 possibilities we are currently in wave [5E] (green label and that being said the last leg down seems to be subdividing and we would be in wave 3 so being in an impulsive wave down we should expect a wave 4 then wave 5 once wave 3 low is in place. The more bearish scenario would indicate that we have made [1A] [2B] (green label) then wave 3 would subdivide in 5 waves and we are now in wave 3 of (3C)? (blue label). I will have to study more my charts tonight but this is what I see for the moment.
Click image for original size
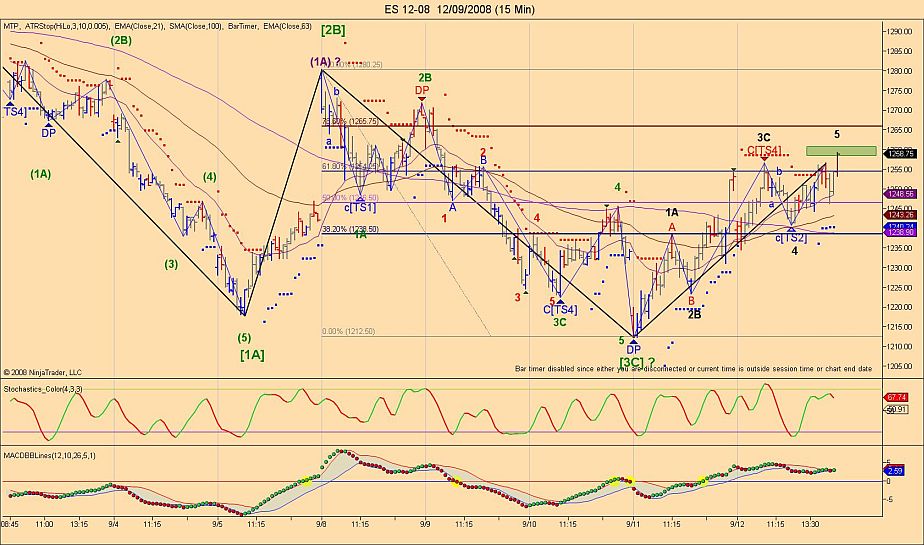
Hi just wanted to post the 15 min charts follow up on the possible wave 5 low that I posted this morning in the daytrading section. As Richard mentioned in his post, TTT was giving us 96% chances of climbing to 1195.50 during the day session if we were to gap down and given the fact that we were in a Fib cluster zone with a stochastic divergence this low was a must trade to take. If I would have only used EW I would have hesitated to take that trade but with the TTT odds this trade was now much more attractive.
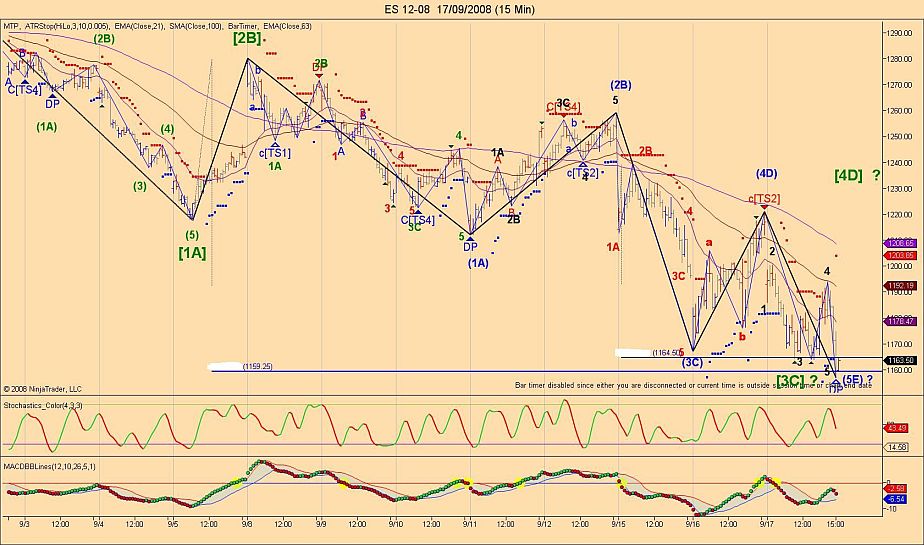
We have now 5 waves down and 3 waves up so the rally so far is corrective until we get a higher high if not we could go down further.
We have now 5 waves down and 3 waves up so the rally so far is corrective until we get a higher high if not we could go down further.
Click image for original size
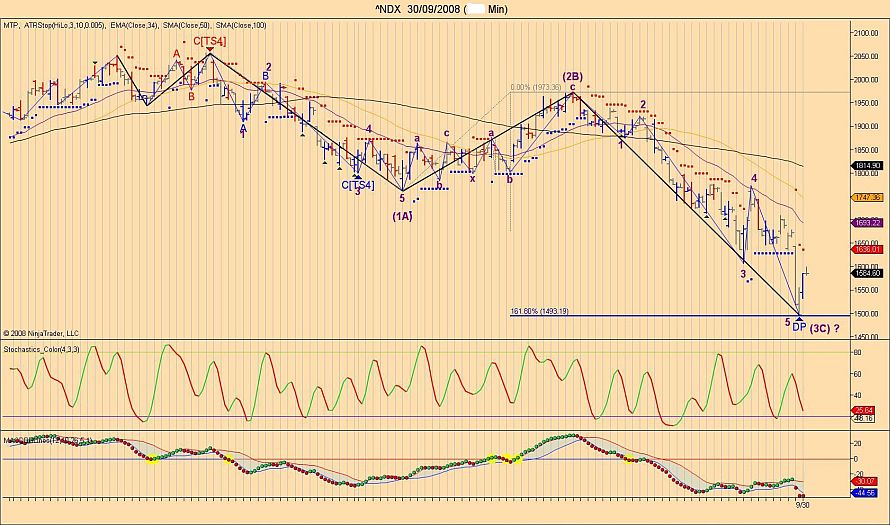
Hi everyone, I will post the big picture of the ES from a 15 min charts, we seem to have completed 3 waves down (green label) as we now have 5 waves down (blue label) in that wave [3C] of course this doesn't mean this is it but giving the fact that we now have divergence on the stochastic ans the MAC this gives us more chances of having completed or being very close to the end of wave 3.
Today was a short sell day and that is exactly what the market gave us by achieving the TTT expected low.
Laurent
Today was a short sell day and that is exactly what the market gave us by achieving the TTT expected low.
Laurent
Click image for original size
quote:
Originally posted by Larry22
giving the fact that we now have divergence on the stochastic ans the MAC this gives us more chances of having completed or being very close to the end of wave 3.
Laurent
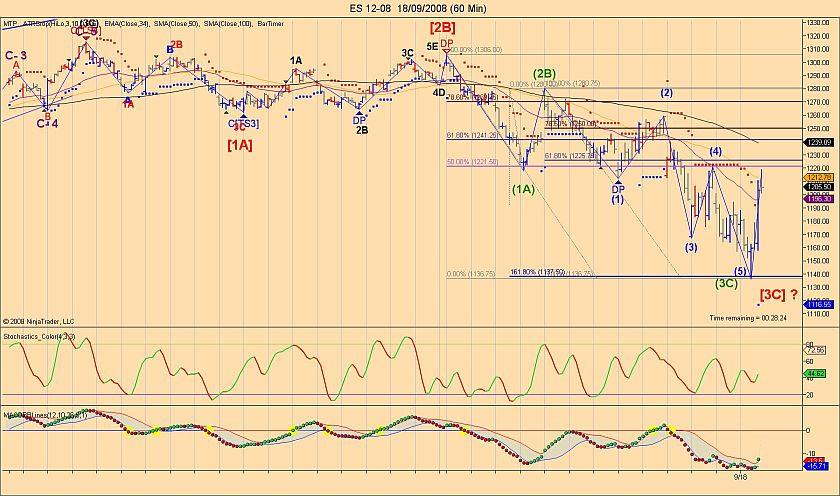
Hi everyone, having said the above yesterday and having 69% chances of testing yesterday's low or of going lower I was not surprised to see the ES go down to the TTT expected low and a bit lower to the 1.62% retracement of wave 1A and 2B (red label) on the 60 min chart. When the market held in that are it was the sign that wave 5 (blue label)was done and we would start a wave 4 of a higher degree.
The rest is history, in case you haven't noticed I posted my trade entry and my wave count while all of this was unfolding and I even had the chance to buy back later the TF but unfortunately got taken out on a profit order while I was on the phone.
Have a nice day.
Laurent
Click image for original size
Click image for original size
Considering the special circumstances happening in the market at this moment I have decided to share my longer time charts (daily and weekly) to every current subscribers of Richard's TTT book and to any new one who will subscribe in the next 7 days.
Laurent
Laurent
Hi everyone the markets had to digest all that stuff from yesterday's low and today's top so since I have worked hard on the special report I won't post any charts for this Friday. I will probably send an updated 60 min charts with possible wave counts to Richard's TTT subscribers as this will be the follow-up of what I have sent today and since you do not have this material it would not be easy to make the follow-up on that.
Have a nice weekend !
Have a nice weekend !
Hi everyone today was another good example as when we combined EW counts with Fib targets and TTT odds it's almost impossible to loose. The market had more then 90% of going up to his buy day low around 1630 so based on these odds and what I had on my chart it was easy to identify that today the market would go up most of the day and that's exactly what it did as it had to do so to complete the 3 day cycle.
So I hope you understand why I was a buyer today and even if I sold twice the TF I took very quick profits each time as I knew I was against the main trend.
P.S Don't be shy if you have any questions as I feel that either no one understand what I post or everything is too obvious for all of you and that worries me.
Click image for original size
Emini Day Trading /
Daily Notes /
Forecast /
Economic Events /
Search /
Terms and Conditions /
Disclaimer /
Books /
Online Books /
Site Map /
Contact /
Privacy Policy /
Links /
About /
Day Trading Forum /
Investment Calculators /
Pivot Point Calculator /
Market Profile Generator /
Fibonacci Calculator /
Mailing List /
Advertise Here /
Articles /
Financial Terms /
Brokers /
Software /
Holidays /
Stock Split Calendar /
Mortgage Calculator /
Donate
Copyright © 2004-2023, MyPivots. All rights reserved.
Copyright © 2004-2023, MyPivots. All rights reserved.