Market Review
Since daytrading is not easy, I allways try to make possible scenarios as to what the market has made during the day and what to possibly expect for the next day also. I mainly trade using Elliott Waves (EW) with Fib numbers from projections and retracements, recently I have added the TTT book to help me have better chances as where the market might go during the day and I try to look for possible clusters zones from my Fib numbers and the TTT numbers highs and lows.
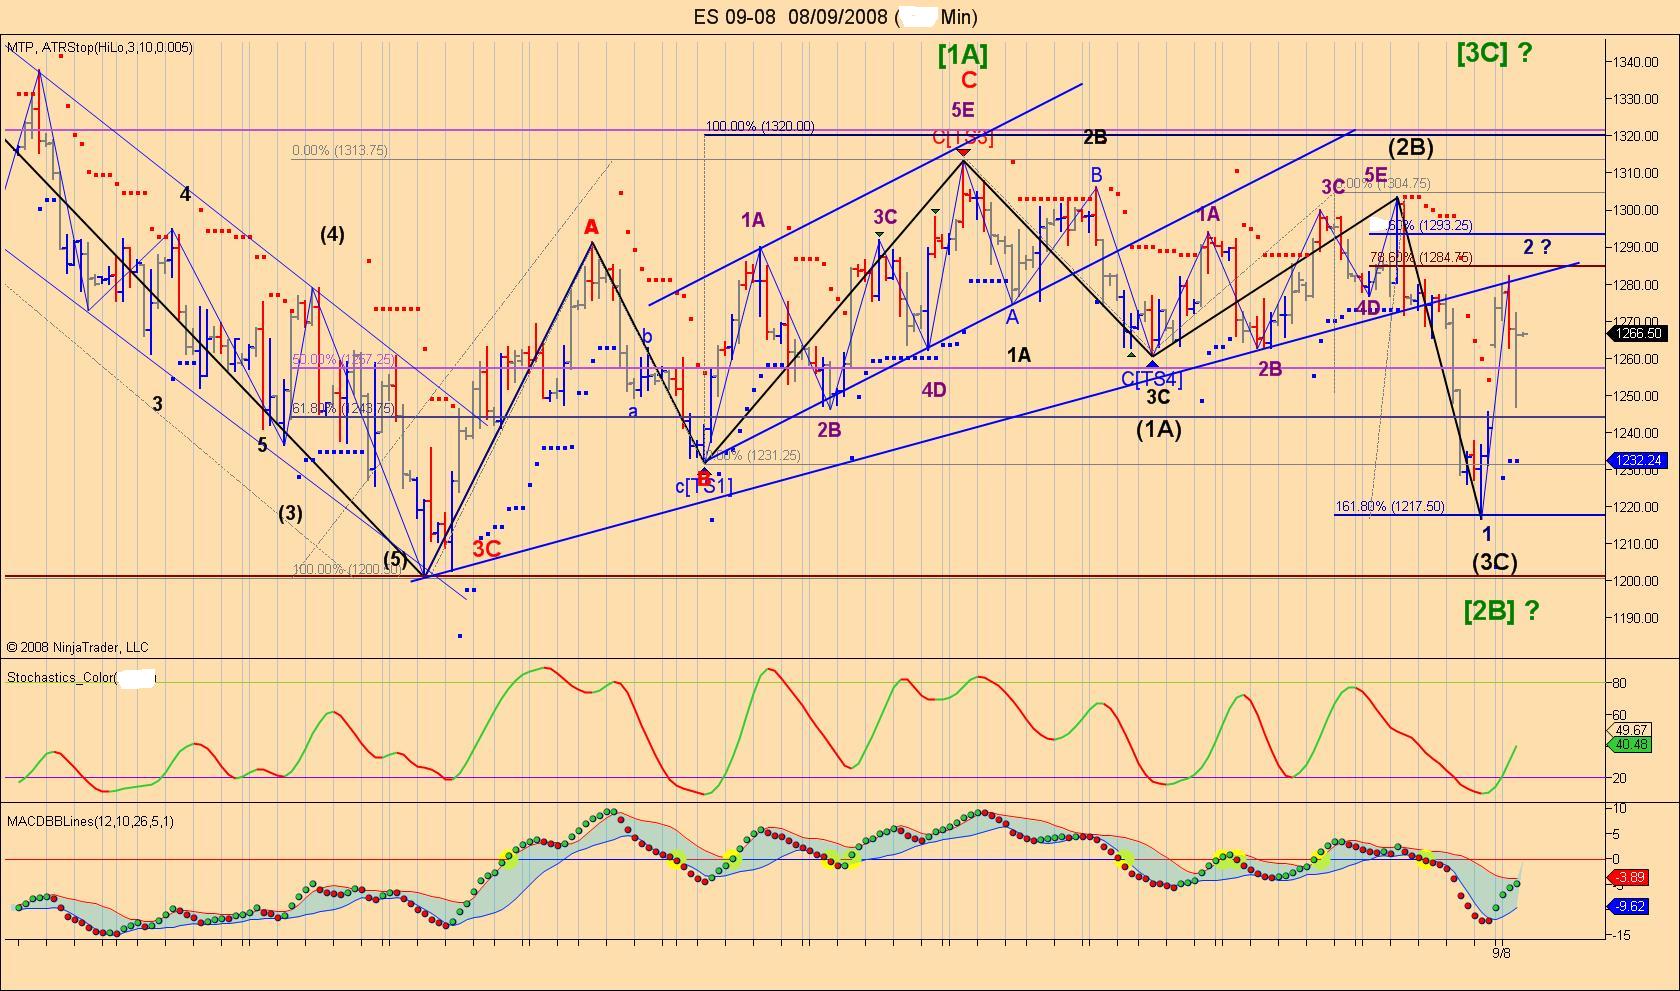
I will start today's review with 2 charts the first one is a high time frame chart based on a 24 hr basis.
We can clearly see that today's top was made at the trendline that was previously broken. We now have 2 possibilities as always up or down but at least we have the big picture as why the market went up today as Friday we had achieved the 1.62% of the wave (1A) and (2B) (black label)completing either wave (3C) or the first wave of (3C)
We can clearly see that today's top was made at the trendline that was previously broken. We now have 2 possibilities as always up or down but at least we have the big picture as why the market went up today as Friday we had achieved the 1.62% of the wave (1A) and (2B) (black label)completing either wave (3C) or the first wave of (3C)
Click image for original size
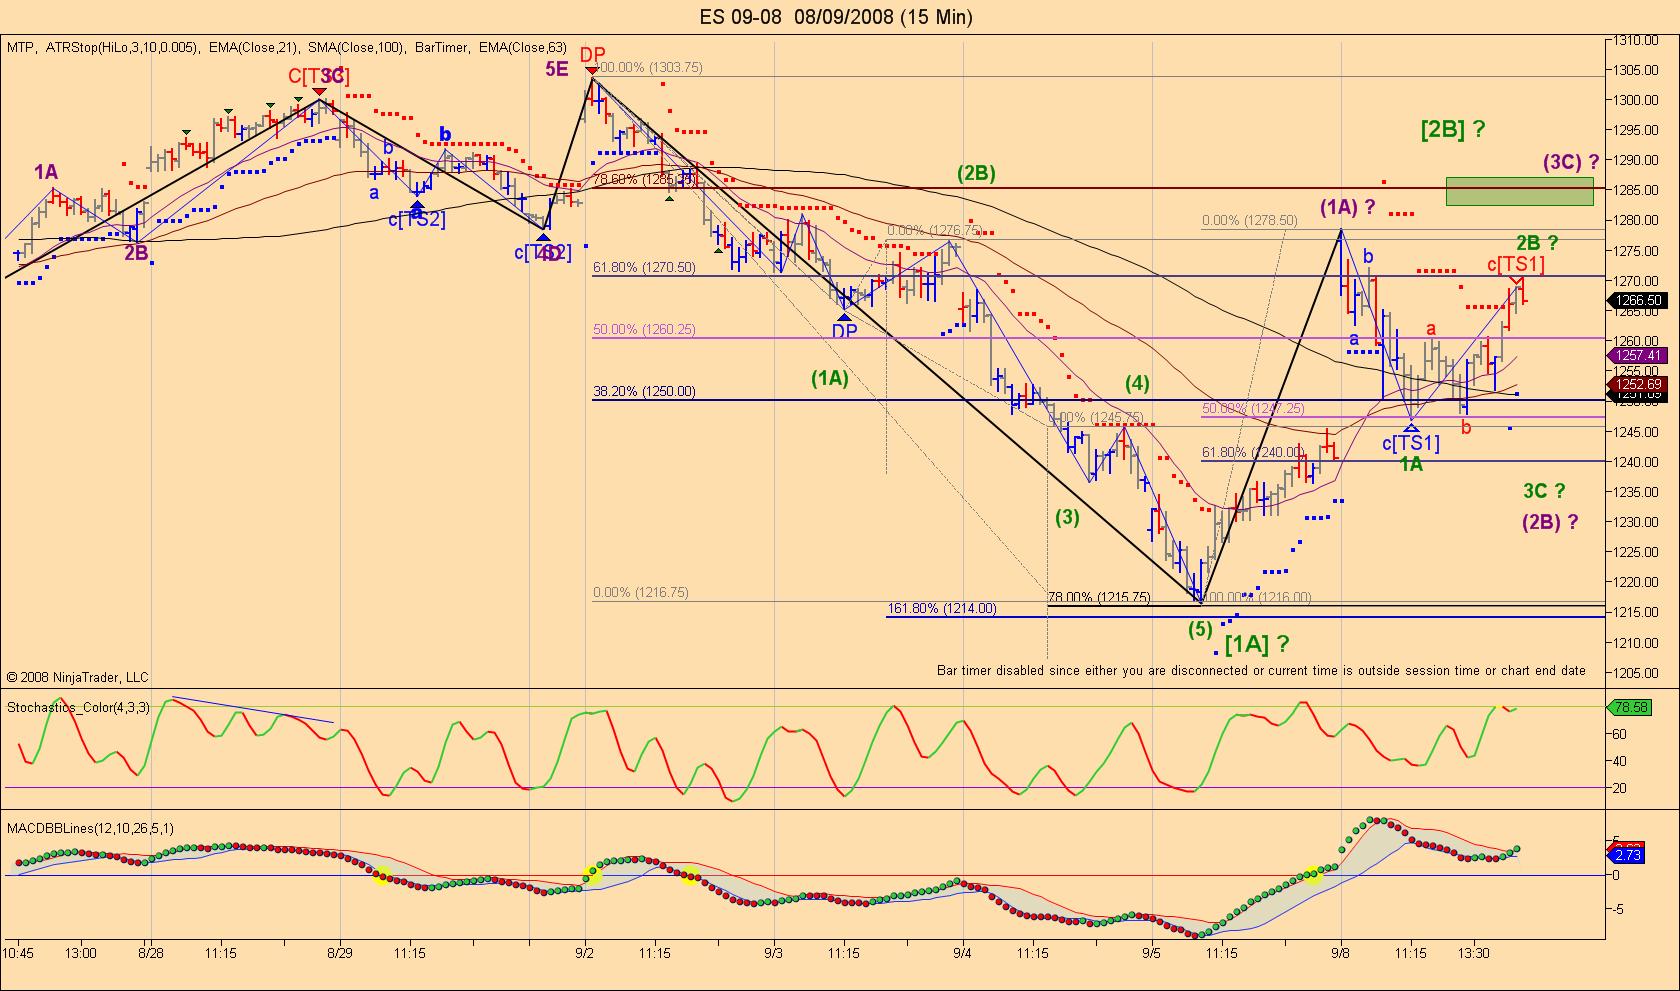
OK now on a smaller time frame, a 15 min chart. We can now see that we are in the middle of 2 possible counts and for the moment we can go both ways as we have no clear impulsive pattern.
We know that the first leg down from 1303 to 1215 can be called [1A] (green label) but this could also be the end of a big 3C leg on the higher time frame the reason why we have a question mark there. then the big leg up we had today could be wave [2B] but once again we could also make a higher high for a wave 2B that would complete a bigger ABC for that leg the opposite is also true on the way down. I will try to analyze a shorter time frame tomorrow morning and see if we can get some clues on where the market is heading.
P.S I haven't had time to look at my TTT book so this will probably help me too for tomorrow's possible direction.
Click image for original size
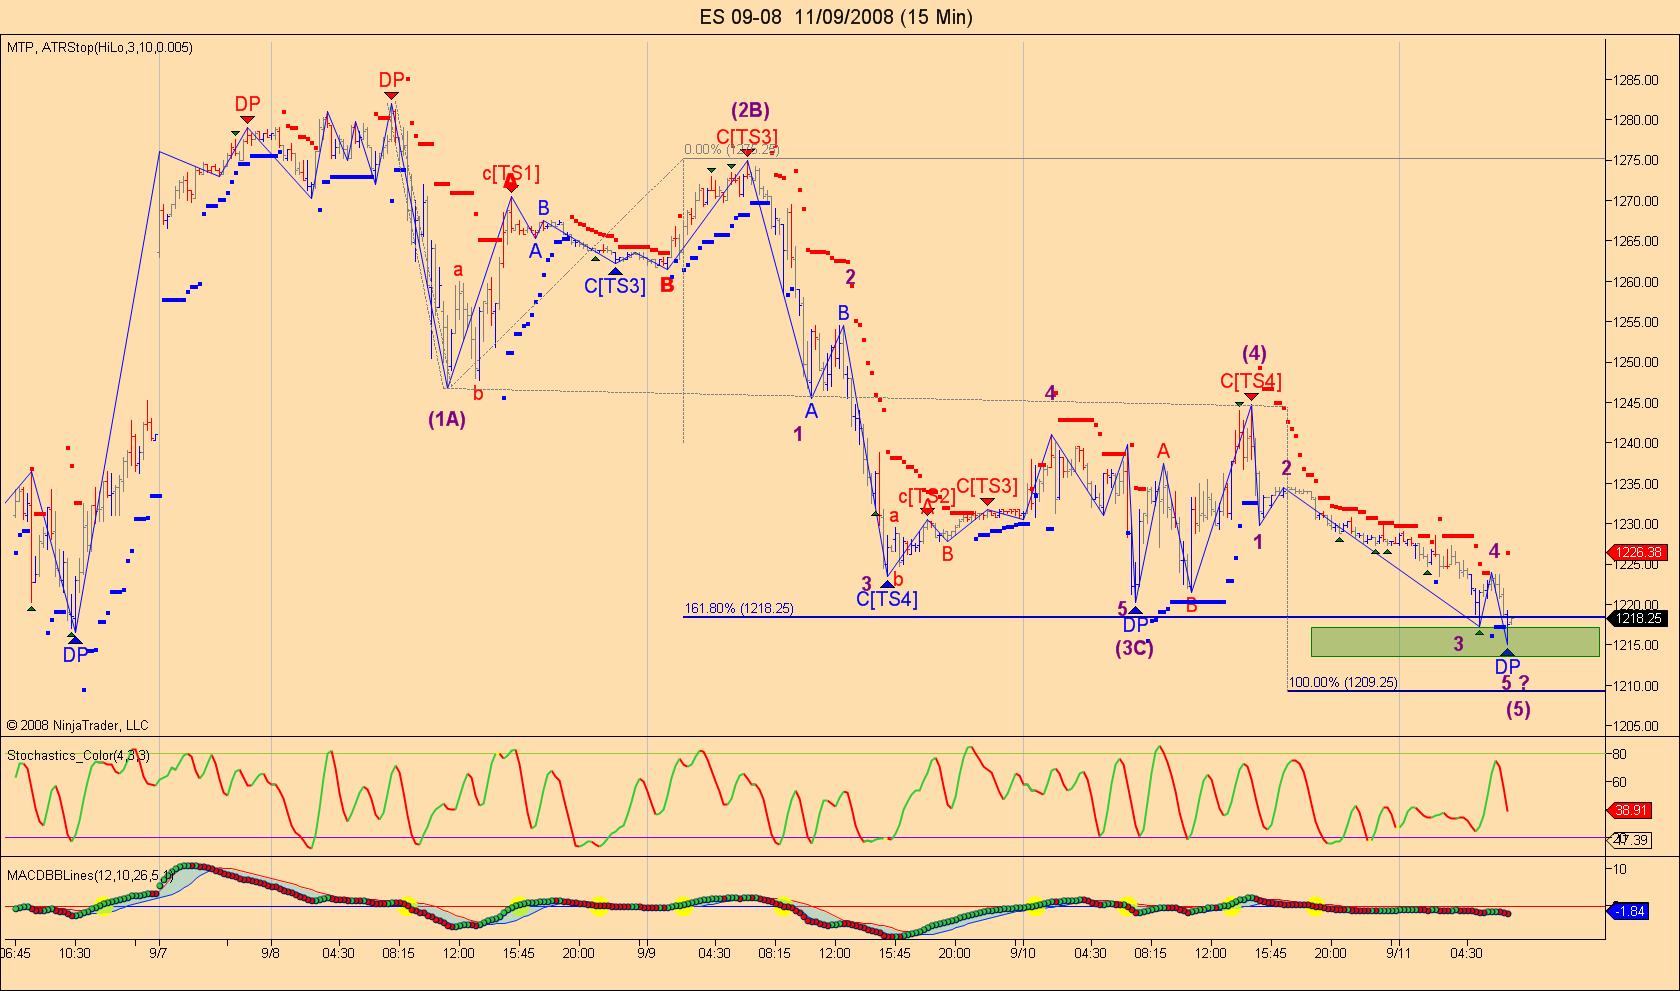
Hi today was a sell day and like Richard stated in the daytrading topic we had 57% chances of going lower. Since the market had a 100% chances of making a high up to 1272.94 and this had been achieved during the night session we needed to take that high during the day session to have any kind of chances for a rally by failing to do so the best side to go was short specially that we already had a nice ABC (red label) from yesterday that was not violated. From that wave top 2B (green label) all we had to do was to wait for the market to make a low lower then 1247. I was expecting the market to possibly hold around the 100% at 1239 as we were also close to the 62% area and the gap but the market was so weak that we barely went up 3 points then stayed there for a few minutes that was a sign of weakness specially when the gap was taken out so next stop was the TTT low and from that level we barely went up 5 points so that was another sign of weakness.
So what can we expect now for tomorrow.
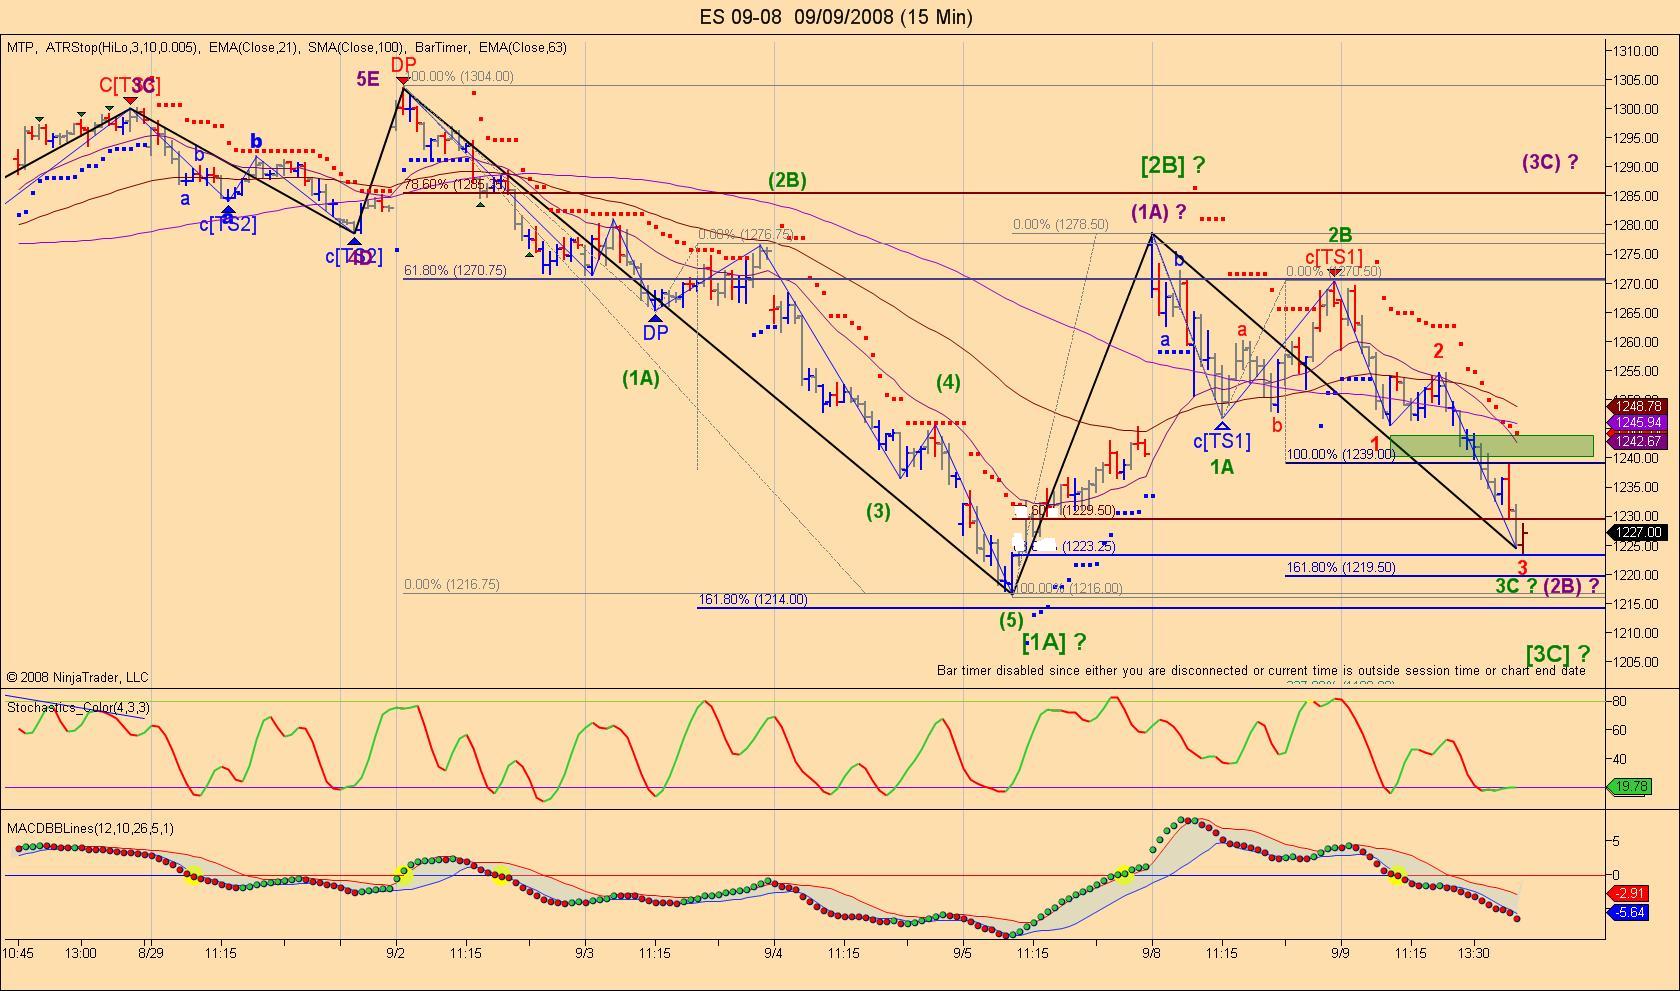
The ABC scenario (violet label) is still possible but the market seems to show us that it is preparing to make extensions in this leg down so we will have to watch that. If we only count the waves in the last leg down from 1270.50 we can clearly see 7 waves down so we could make a 9th wave to the 1.62% at 1219.50 for a possible B wave but we could also climb from that Fib level at 1223.25 also.
Well I hope I haven't put too much stuff as sometimes waves structure are not always easy to explain so let's me resume this.
As long as we do not take 1217 there will be a possibility for a wave
B and a C higher if we take the low at 1217 this will confirm that we are gonna be heading much much lower as we will be in a wave 3 of 3 down.
So what can we expect now for tomorrow.
The ABC scenario (violet label) is still possible but the market seems to show us that it is preparing to make extensions in this leg down so we will have to watch that. If we only count the waves in the last leg down from 1270.50 we can clearly see 7 waves down so we could make a 9th wave to the 1.62% at 1219.50 for a possible B wave but we could also climb from that Fib level at 1223.25 also.
Well I hope I haven't put too much stuff as sometimes waves structure are not always easy to explain so let's me resume this.
As long as we do not take 1217 there will be a possibility for a wave
B and a C higher if we take the low at 1217 this will confirm that we are gonna be heading much much lower as we will be in a wave 3 of 3 down.
Click image for original size
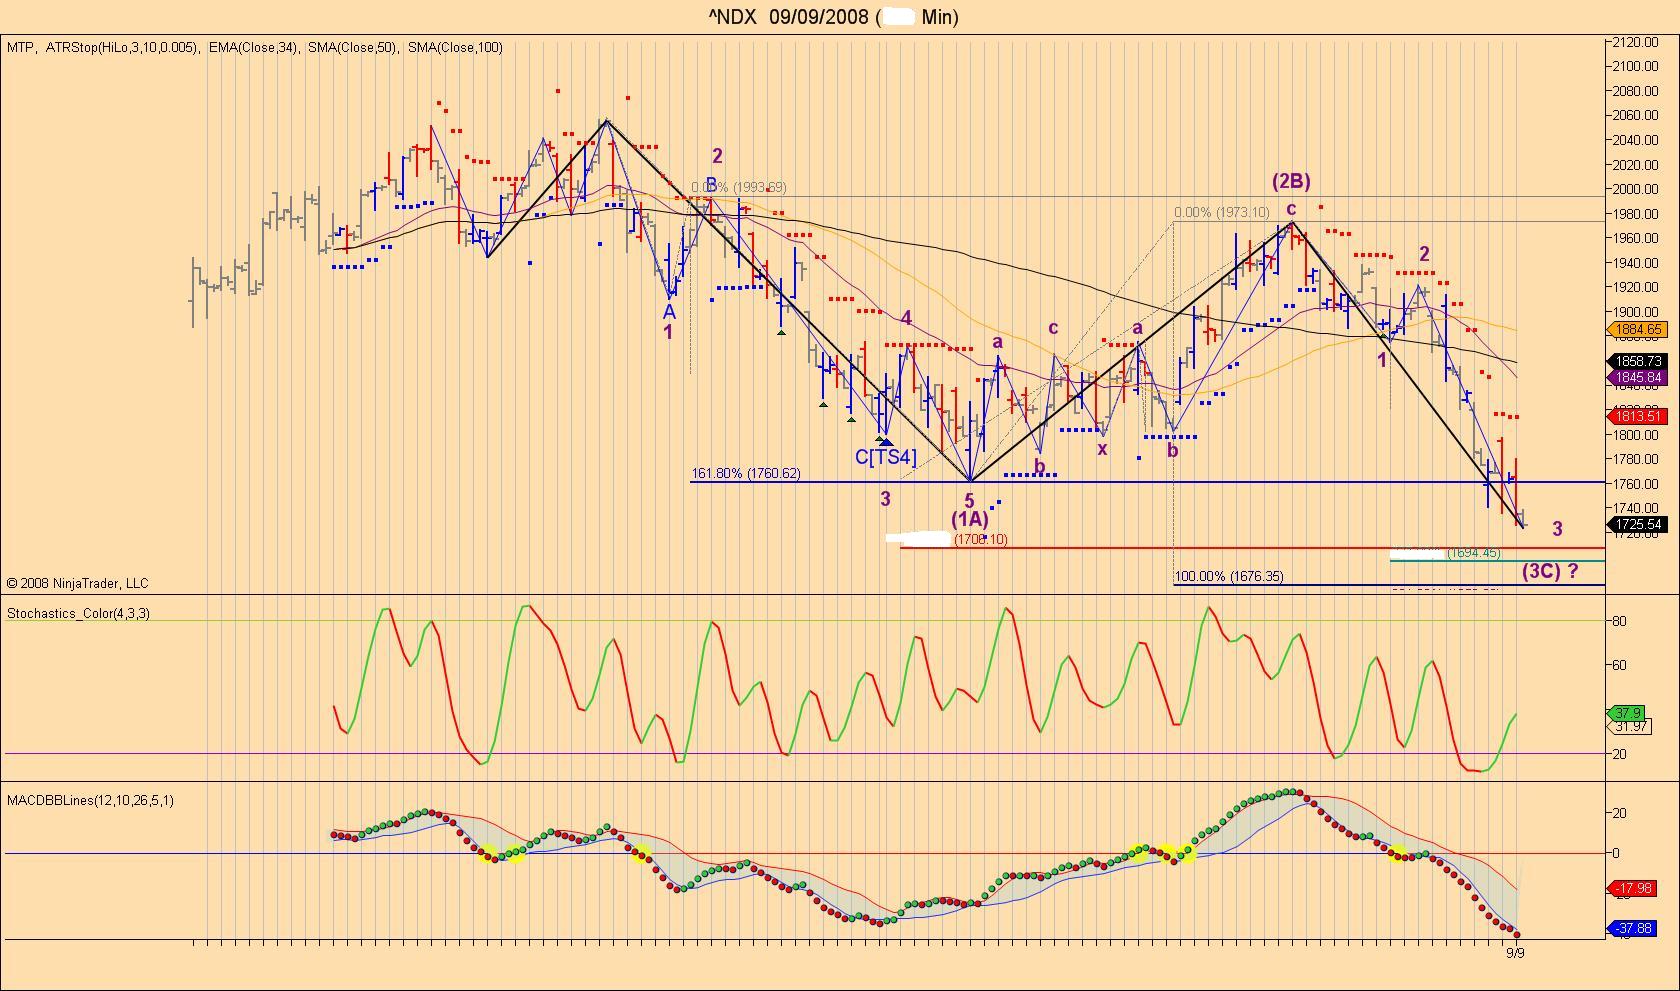
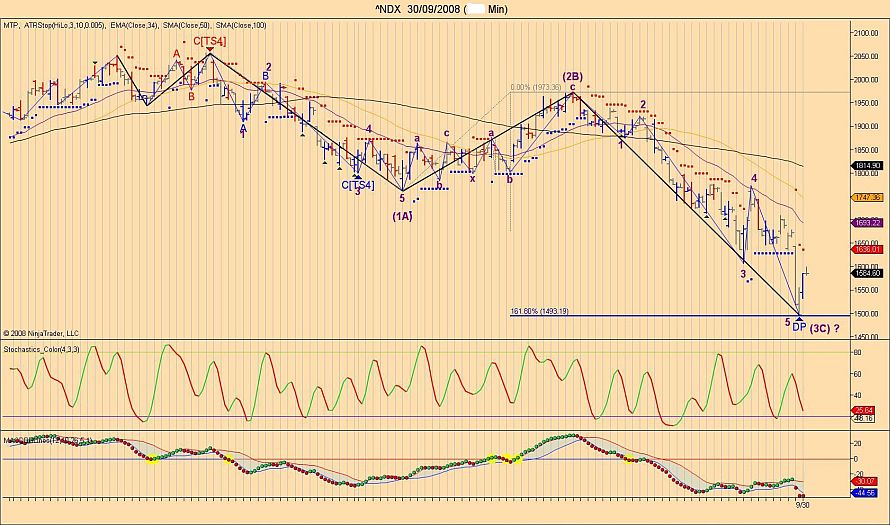
I thought I would share with you this bigger picture of the Nasdaq 100 cash index NDX.
You will see why the NQ is very weak then the others as it is in a wave 3 of (3C) I don't think I have to explain much on this one if you have any questions remarks or would like to share your thoughts you can reply in the Market Reply Comments topics as I would like to keep this thread easy to read for market review follow up.
You will see why the NQ is very weak then the others as it is in a wave 3 of (3C) I don't think I have to explain much on this one if you have any questions remarks or would like to share your thoughts you can reply in the Market Reply Comments topics as I would like to keep this thread easy to read for market review follow up.
Click image for original size
Hi folks I hope you had all a good trading day today as I posted a few trades almost live and called the ES bottom when it was unfolding if you have read the posts in the daytrading section.
I just want to let you know that I won't always be posting live wave count like today as it is very time consuming for me and my trading suffers from it as I can't have all my concentration on the market specially because I follow 3 market (ER2, NQ and ES), so I hope you all appreciate it as I know it is very easy to post a wave count an hour later and say I knew it was the top or bottom so I just wanted to show you that it is possible to do so while waves are unfolding. Another thing don't be shy to post comments in the Market Review comments sections or in the daytrading section as I felt I was alone today but I saw we had a lot of readings on the daytarding section this way we may have constructive posts and also don't be afraid to share your views of where the the market might be heading. You have a wave count and not sure about it post your chart we will discuss about it.
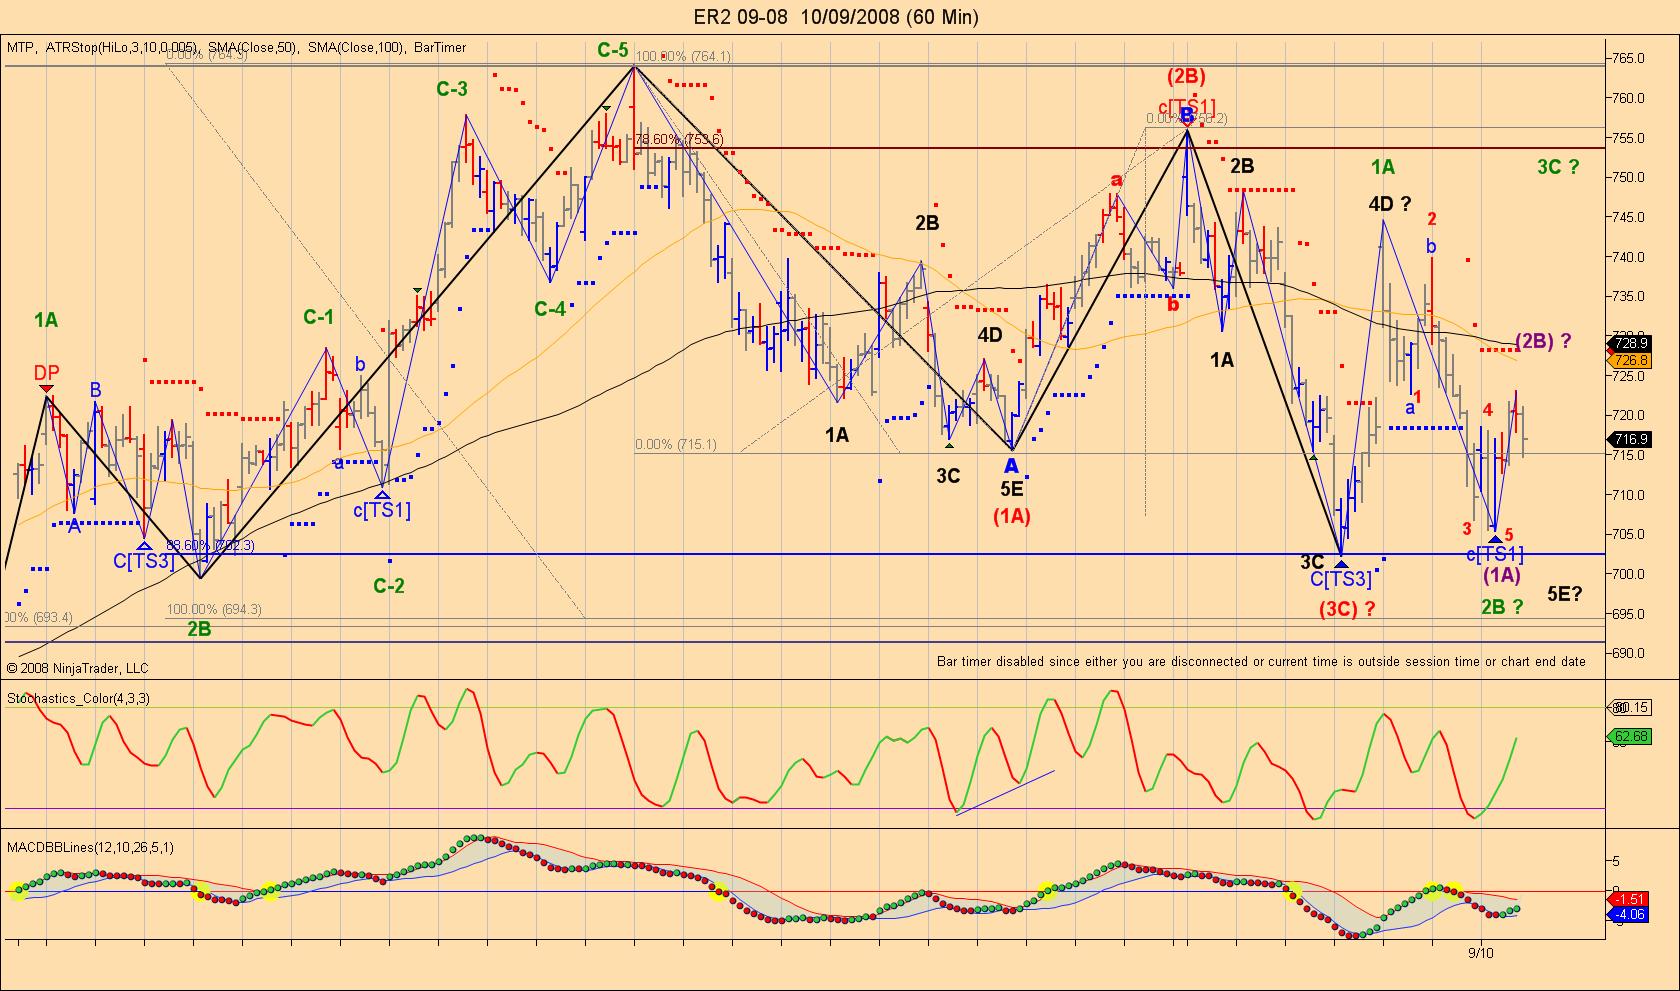
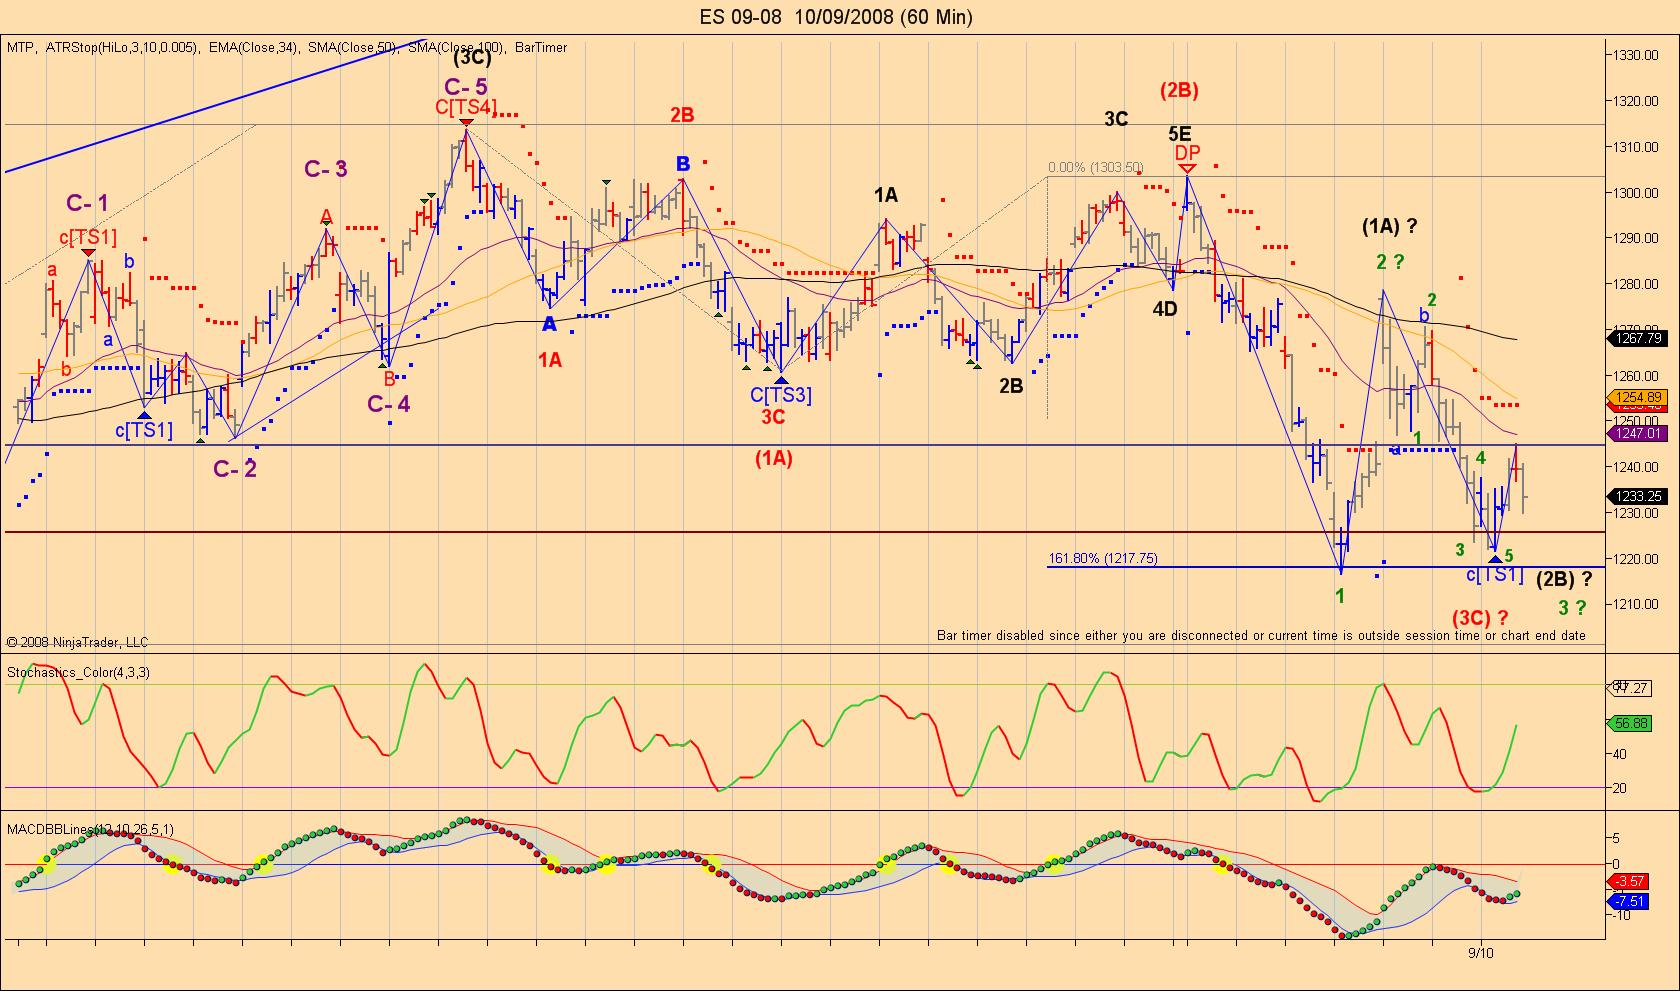
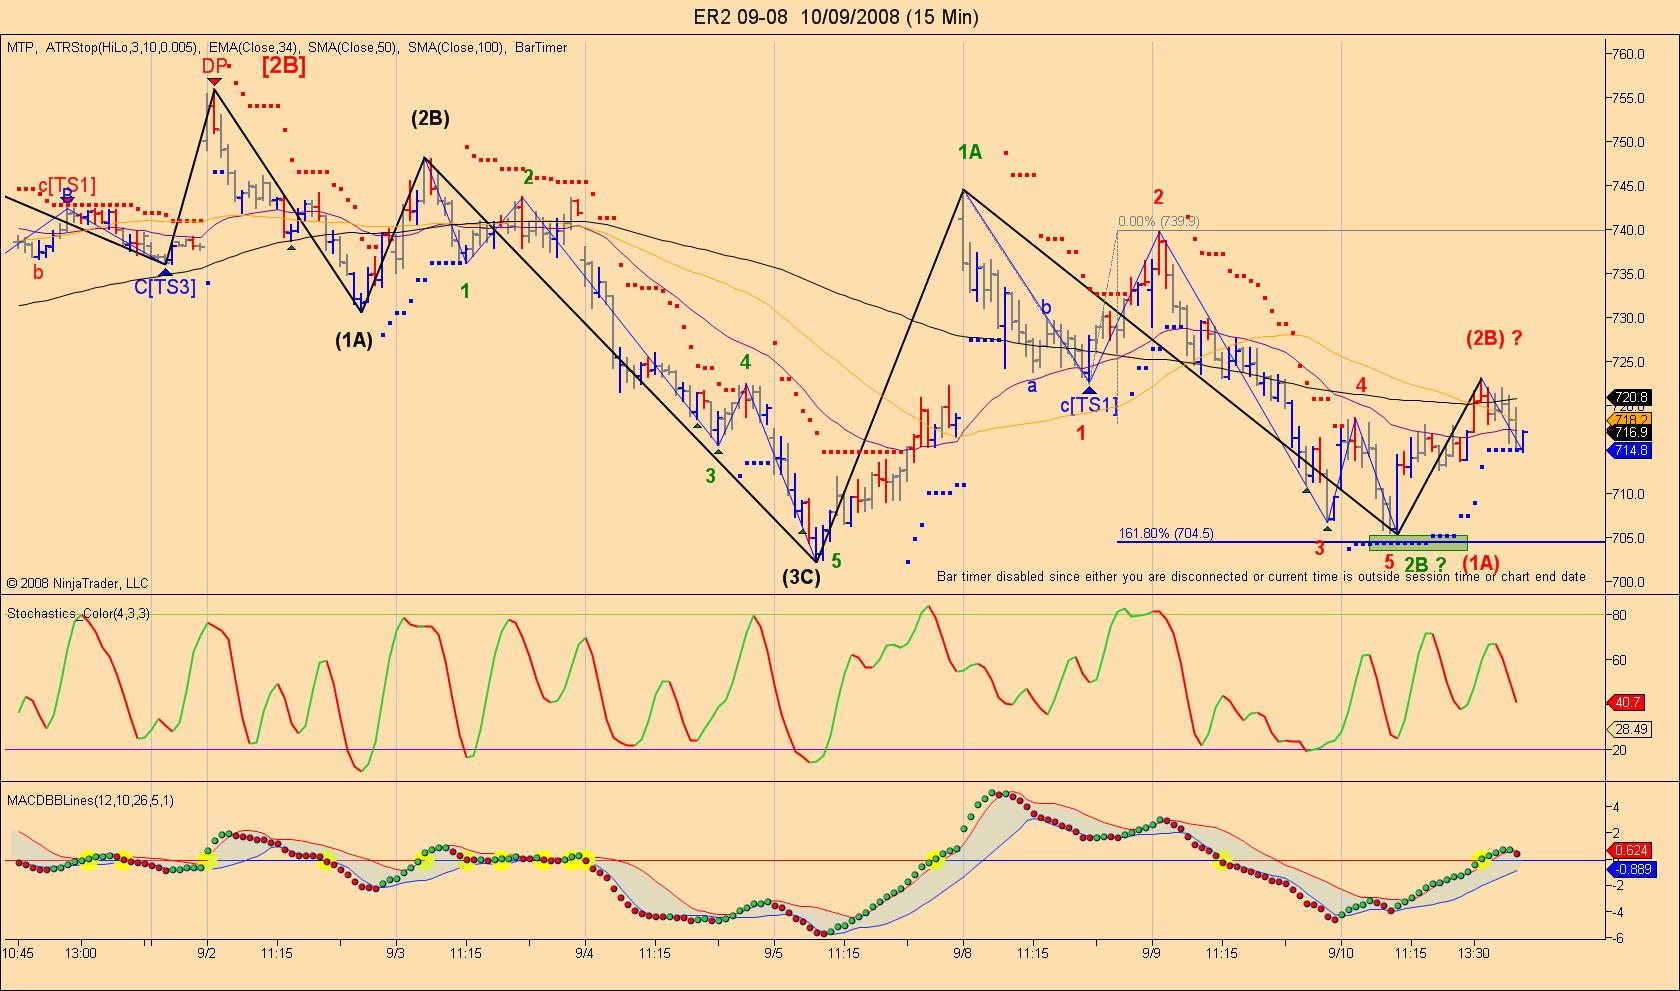
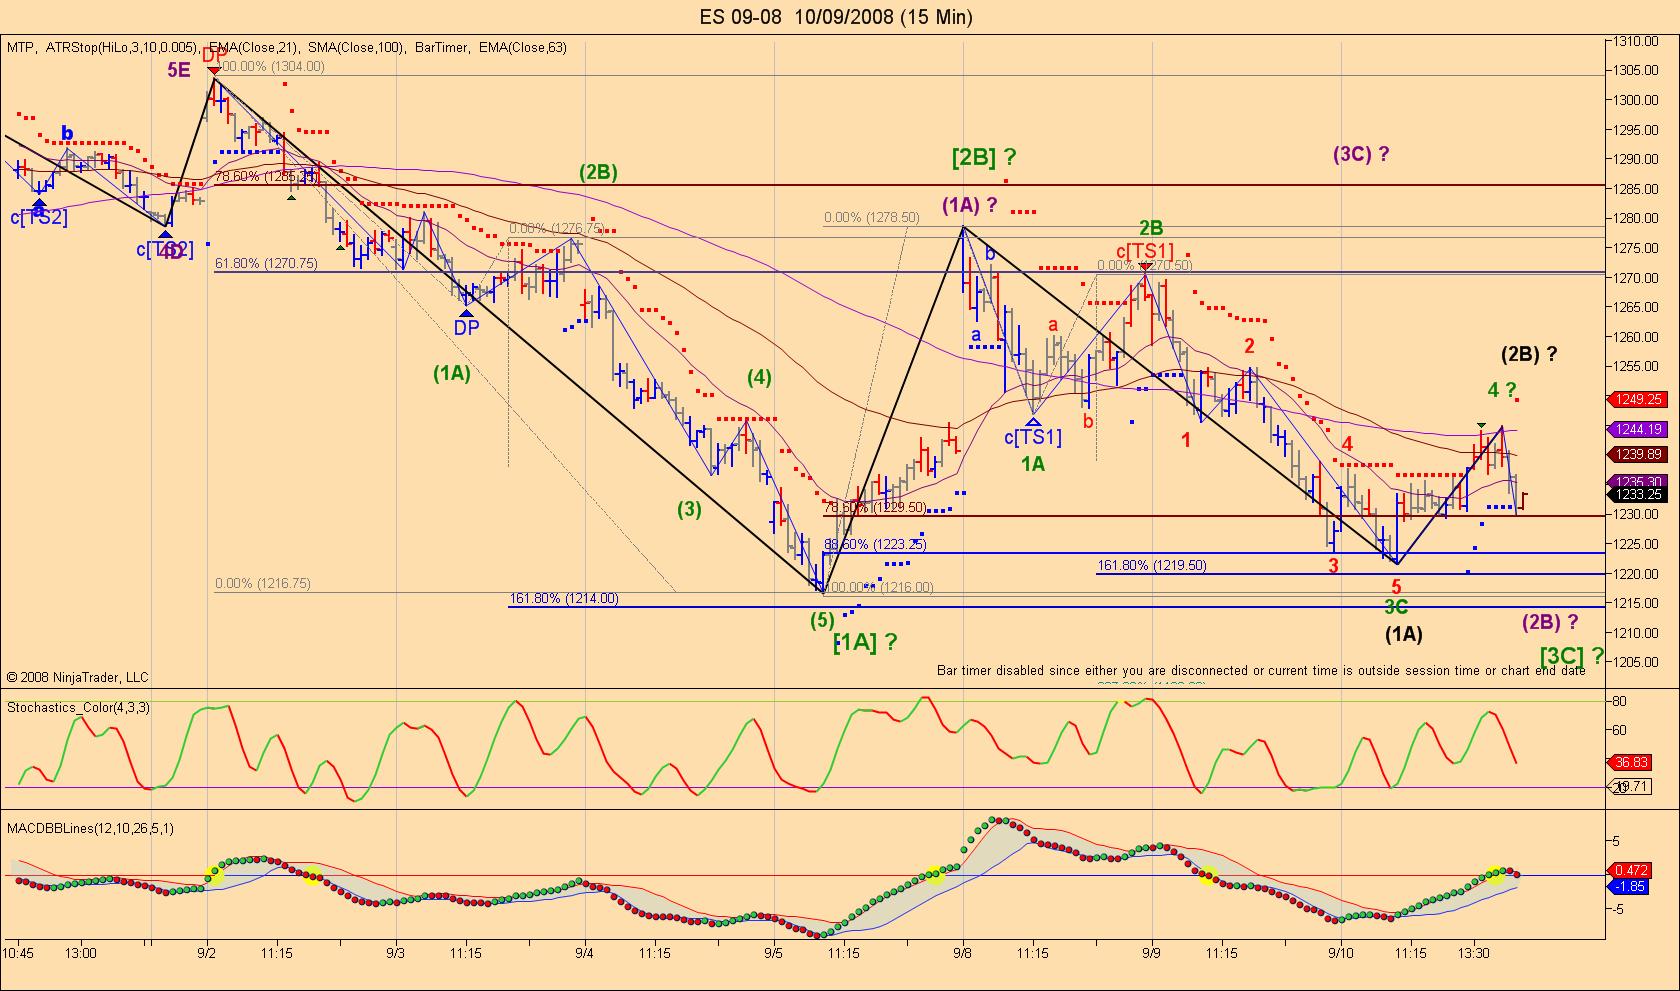
OK enough said, to help you have a better understanding of where the market could go I will show you 2 60 min charts and 2 15 min charts of 2 different index, I am sure you will wonder why the reason is very simple both counts seems to be the same on the 60 min at least for the last leg down, but when we go on the 15 min we see that ER2 had a perfect wave structure while the ES was a bit different this is one of the reason why I like to follow more then one index as the one with the most obvious wave count will be the one that I will trade as chances of succeding the trade are better.
On the 60 min charts of both indexes we can clearly see that we have now 5 waves down but if we go down on the 15 min charts the ER2 had a nice 5 leg down pattern while the ES had also 5 legs down but in the wave 3C (green label) so this was a bit confusing but we knew one thing the 5 waves pattern was a place to cover and reverse if you were short and a place to buy if you were flat. You might wonder why was it a good place both indexes went to their green boxes called (DP on this software) let's call them possible reversal area, we also had a divergence on the MACDBB and also on the stochastic on the ER2 so this was increasing the chances of seeing the market rally from this point furthermore from the TT book we had more then 80% of reaching 1246.75 on the ES so all this together was enough to take the risk of buying this low.
I think this wrap it up if you have any questions do not hesitate.
I just want to let you know that I won't always be posting live wave count like today as it is very time consuming for me and my trading suffers from it as I can't have all my concentration on the market specially because I follow 3 market (ER2, NQ and ES), so I hope you all appreciate it as I know it is very easy to post a wave count an hour later and say I knew it was the top or bottom so I just wanted to show you that it is possible to do so while waves are unfolding. Another thing don't be shy to post comments in the Market Review comments sections or in the daytrading section as I felt I was alone today but I saw we had a lot of readings on the daytarding section this way we may have constructive posts and also don't be afraid to share your views of where the the market might be heading. You have a wave count and not sure about it post your chart we will discuss about it.
OK enough said, to help you have a better understanding of where the market could go I will show you 2 60 min charts and 2 15 min charts of 2 different index, I am sure you will wonder why the reason is very simple both counts seems to be the same on the 60 min at least for the last leg down, but when we go on the 15 min we see that ER2 had a perfect wave structure while the ES was a bit different this is one of the reason why I like to follow more then one index as the one with the most obvious wave count will be the one that I will trade as chances of succeding the trade are better.
On the 60 min charts of both indexes we can clearly see that we have now 5 waves down but if we go down on the 15 min charts the ER2 had a nice 5 leg down pattern while the ES had also 5 legs down but in the wave 3C (green label) so this was a bit confusing but we knew one thing the 5 waves pattern was a place to cover and reverse if you were short and a place to buy if you were flat. You might wonder why was it a good place both indexes went to their green boxes called (DP on this software) let's call them possible reversal area, we also had a divergence on the MACDBB and also on the stochastic on the ER2 so this was increasing the chances of seeing the market rally from this point furthermore from the TT book we had more then 80% of reaching 1246.75 on the ES so all this together was enough to take the risk of buying this low.
I think this wrap it up if you have any questions do not hesitate.
Click image for original size
Click image for original size
Click image for original size
Click image for original size
I will try to post a possible wave count of where the market might be heading tomorrow morning before the market opens probably just after the Jobless claim report as I am way too tired tonight, I am exhausted and have other important things that I must do as trading isn't everything in life.
Good night
Good night
This is the count I have so far on the 15 min 24 hr basis chart.
It does not have the same then the 60 min so far but let's say that we might have some kind of rally from this pattern but there is that report at 8:30 ET. So we will see what happens after. I just thought I would post this count before the news then I will look at the bigger picture as I also need to do the rollover today.
It does not have the same then the 60 min so far but let's say that we might have some kind of rally from this pattern but there is that report at 8:30 ET. So we will see what happens after. I just thought I would post this count before the news then I will look at the bigger picture as I also need to do the rollover today.
Click image for original size
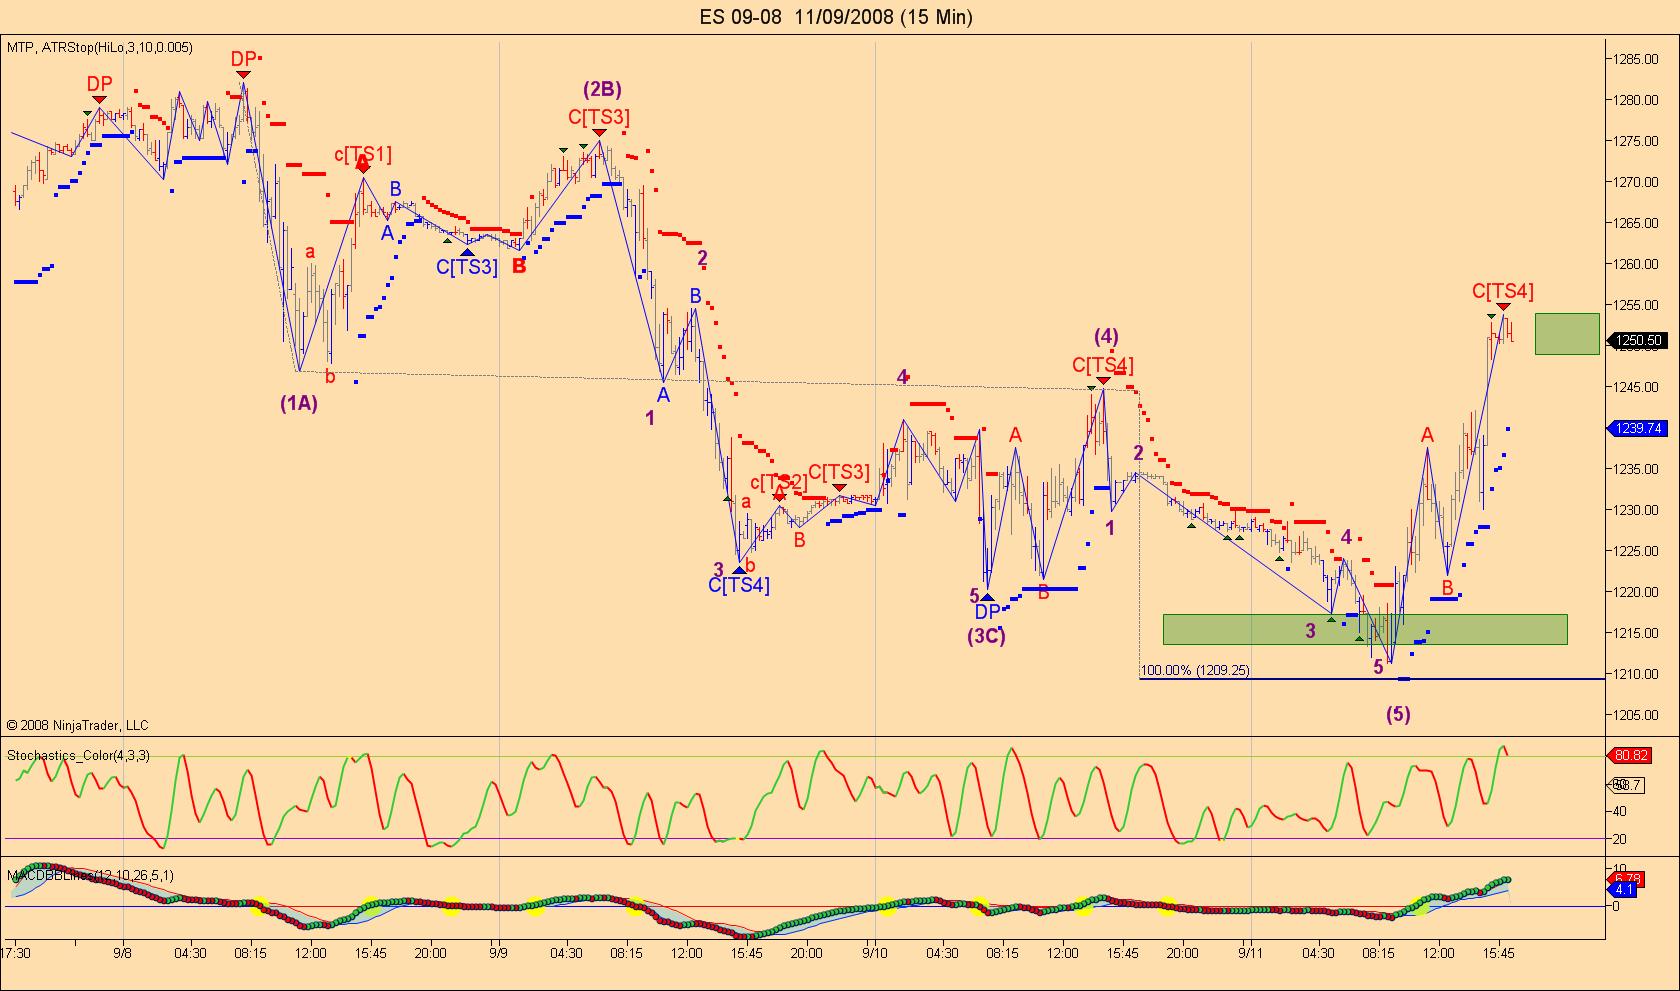
Hi all, what a day we had, first let me post the follow up on the possible big 5 waves down that I posted earlier.
You will notice once again for the second day in a row EW showed us that we were near a low and that the long side was the place to be for most of the day.
Some of you might wonder why chances were greater to go up and not down this is the part I like the most by combining EW and the TTT book I knew that the expected TTT low was near 1208 and the actual low we had was 1212 on the December contract. Knowing that I had 5 waves down in the last leg and that we had a bigger 5 waves down plus we were close to wave (1A) = wave (5) and very close to the same thing on the lower leg that was an easy decisions to take.
That is one of the reason why I like to look at the Fib's level that I have and the TTT expected highs or lows as when both matches or are very near chances of a winning trade are increased very much.
Click image for original size
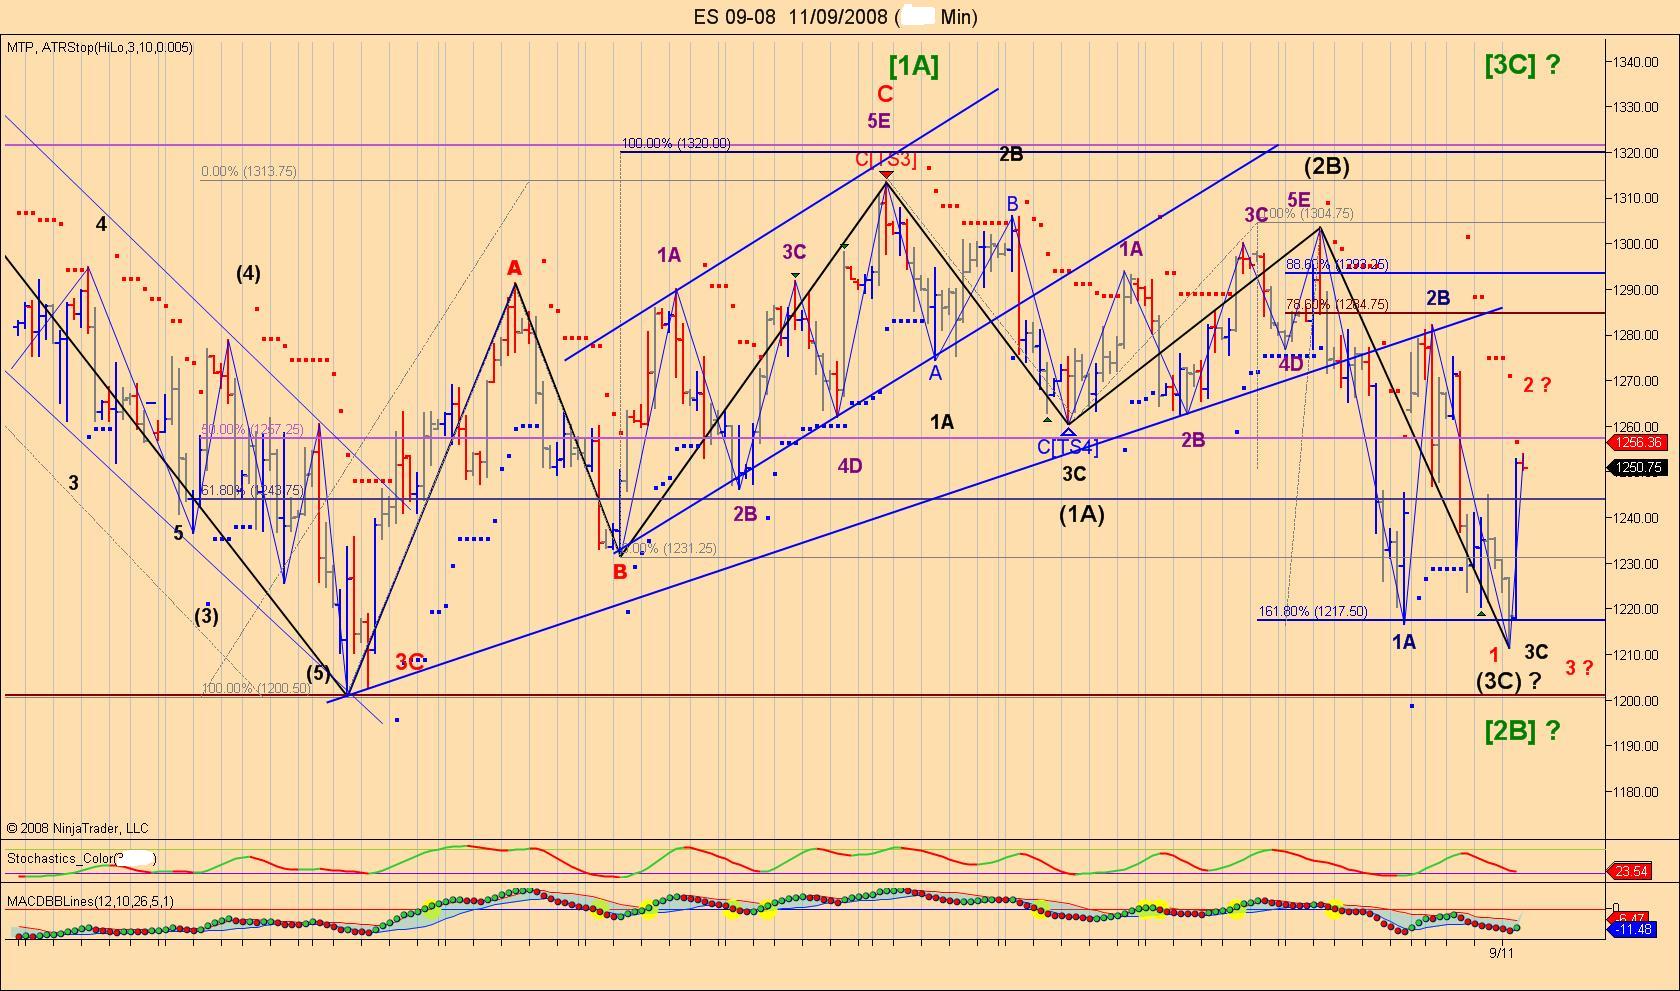
If you all remember a few days ago I posted a big time frame chart with a possible wave count showing that the market could go higher, I will now comment on this big picture once again so we can see where the market might be heading in the next few days.
As stated before I try to never have a fixed bias on where the market could go I try to look at what the market is drawing me and with he help of my wave counts and the TTT book I look for low risk area to initiate a trade.
Based on what we have so far the market has showed me that we have no impulse wave down so far in the big waves as we had 3 waves down in the (1A)wave (black label) down and 5 overlapped up waves considered an ABC as they overlapped for wave (2B) then we started what could be for me the wave (3C) and we have now 3 waves in that leg down so from this point of view we could have an ABC pattern completed as this entire correction could become a 3,3,3. We could now called this leg down wave [2B] (green label) if that's the case we could expect the market to climb higher then 1313.
Having said that I try not to have any bias and I must have an alternate wave count going down, so if the market wants to go down we could call the pattern so from wave (2B) top as 1A 2B and we would now be in wave 3C down but because we made a new low and didn't go much lower this last leg could become wave 1 of wave (3C) and we would be in wave 2 up this would mean a very vicious drop once we start wave 3 down.
I will post 1 or 2 more charts later on this evening as it is now supper time and I really need a rest as with the rollover day and the fact that I had to upgrade Ninjatrader this morning for the ER2 transition to ICE exchange that took a lot of my time and resources plus the posting of live charts.
I do hope you enjoy and learn from what I post and like I said earlier it is possible to buy close to the bottoms or sell near the tops as I have showed you for the last 2 days.
Have a great day.
Laurent
Click image for original size
We had a few requests asking us to reduce the size of the charts so people on smaller size monitors or Laptop can read the threads without having to scroll their monitors.
I can understand that as having smaller monitors before and when I used to work I had a Laptop and I was finding big screen post very unpleasant to read and follow.
So as soon as we will be on the second page of this thread my charts will be reduced to about half the size they were so everyone will be able to follow my posts without having to scroll the page.
I am sorry for any inconvenience that this may have caused.
Hi everyone today was another good example as when we combined EW counts with Fib targets and TTT odds it's almost impossible to loose. The market had more then 90% of going up to his buy day low around 1630 so based on these odds and what I had on my chart it was easy to identify that today the market would go up most of the day and that's exactly what it did as it had to do so to complete the 3 day cycle.
So I hope you understand why I was a buyer today and even if I sold twice the TF I took very quick profits each time as I knew I was against the main trend.
P.S Don't be shy if you have any questions as I feel that either no one understand what I post or everything is too obvious for all of you and that worries me.
Click image for original size
Emini Day Trading /
Daily Notes /
Forecast /
Economic Events /
Search /
Terms and Conditions /
Disclaimer /
Books /
Online Books /
Site Map /
Contact /
Privacy Policy /
Links /
About /
Day Trading Forum /
Investment Calculators /
Pivot Point Calculator /
Market Profile Generator /
Fibonacci Calculator /
Mailing List /
Advertise Here /
Articles /
Financial Terms /
Brokers /
Software /
Holidays /
Stock Split Calendar /
Mortgage Calculator /
Donate
Copyright © 2004-2023, MyPivots. All rights reserved.
Copyright © 2004-2023, MyPivots. All rights reserved.