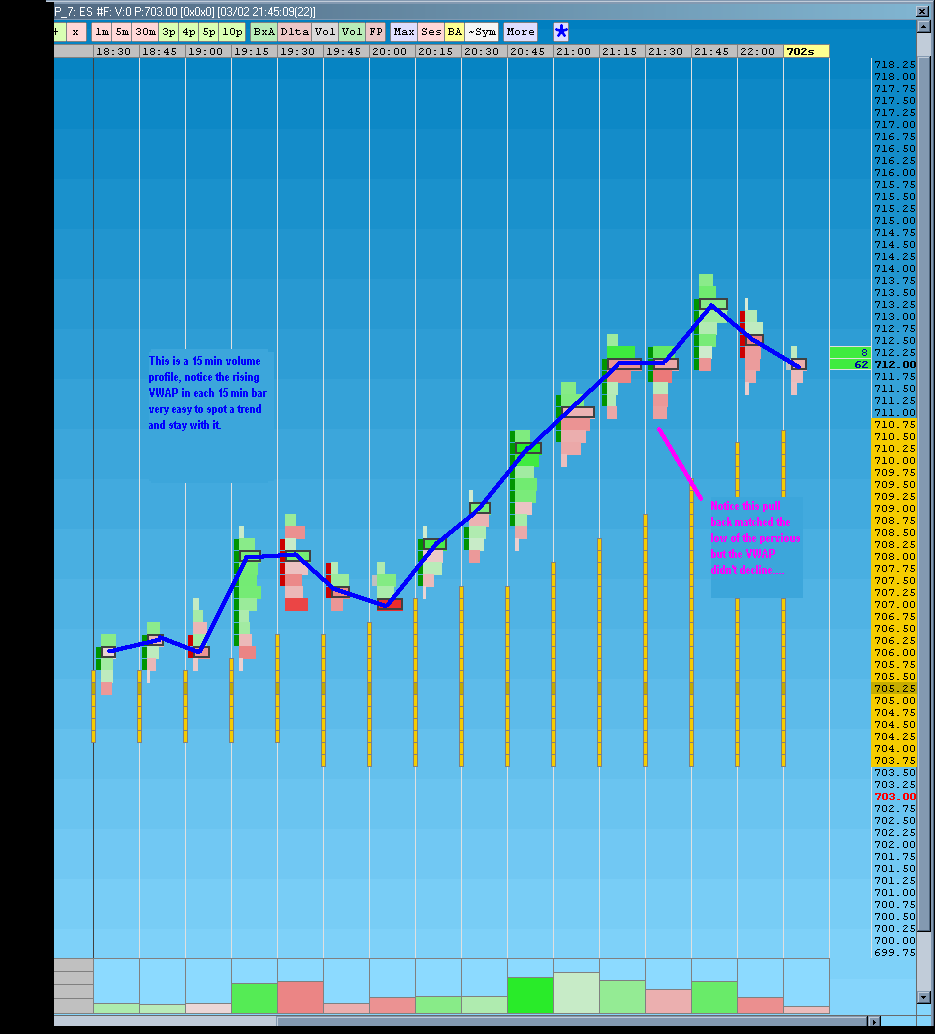
intra-day V.W.A.P. (VWAP)
Click image for original size
Thanks..I'd appreciate it...HEY JOE ...did you find something for VWAP bands in Esignal? I looked but nothing came up on my search that held some promise....
quote:
Originally posted by That One Guy
I'll try to get a few decent charts up this weekend.
No I didn't find anything. I have V.W.A.P. but not the standard deviations in the form of lines but rather on a histogram.
try here and look at post 74...it may be what you need...not sure....let me know and I'll continue the hunt for you if that fails
http://www.traderslaboratory.com/forums/46/vwap-indicator-with-1sd-and-2sd-2175-8.html
http://www.traderslaboratory.com/forums/46/vwap-indicator-with-1sd-and-2sd-2175-8.html
did you get the bands to work yet Joe?
bruce - this fellow has a efs for esignal you might want to try
http://www.tradingsimulation.com/resources/esignal_vwap.html
http://www.tradingsimulation.com/resources/esignal_vwap.html
sorry for the double post
thanks Gio..I use Investor r/t so I am set up ok.....I'm not sure if Joe is still with esignal...I assume so...thanks for the help
Thanks bruce, gio
I have been busy I am working on it today. And I am still using esignal. I thought they were bad because of some delays I was getting but I tried several and esignal is the best in my book.
I have been busy I am working on it today. And I am still using esignal. I thought they were bad because of some delays I was getting but I tried several and esignal is the best in my book.
Just following up to see if your still here T. O. G. I've been messing with it a bit in my free/down time but haven't had any great insights.......I'd like to work on a breakout strategy with it...I think it could help with the Mini I.B thread with some stops and reverse......
My Vwap is now green for the up moves and changes to red on a cross so it May be fairly helpful especially if we can define some breakout conditions or high opening volume........my ultimate goal would be to catch the 8 - 10 point moves off the open print with S/R's until it hits...
My Vwap is now green for the up moves and changes to red on a cross so it May be fairly helpful especially if we can define some breakout conditions or high opening volume........my ultimate goal would be to catch the 8 - 10 point moves off the open print with S/R's until it hits...
quote:
Originally posted by That One Guy
I use VWAP in my trading, but I plot them from significant swing highs and lows. A point where sentiment changes, like a swing high is created and then the market turns down and makes lower lows. I, follow the 1st SD's to gauge value of that particular swing. This can be done on many swings (small, medium Big). I also take note in things like rotation from 1st to 2nd SD, which would be repricing of value. This gives me a heads up on countering that particular swing. I will also plot vwaps from failure spots (a place where a low or high fails and new higher/lower value is established) and watch how the market returns to that vwap. To me it is a spot where the guys on the wrong side of the trade may get out at much less of a loss. I am still trying to work out a complete trading plan with all this information, but following the market this way has made much more sense to me.
I have the script, I haven't done this in a while, would someone who uses esignal direct me on how to get it into the chart please.
I've just seen that the latest (just released) version of eSignal (10.4) includes VWAP. Have any of you tried it? From eSignal's product news page:
quote:
VWAP Calculator
Under the Tools menu is a new calculator that allows you to get a VWAP value when certain dates / times are specified. You can also apply size filters to include or exclude trades of a given size to estimate where certain trading groups are putting their money into the market. That is to say, you can determine what the VWAP would be if large block trades are removed or if only large block trades are used.
Alternatively, the Weekly VWAP could be generated with this tool, which is a nice way to see what the average price was for the week.
Emini Day Trading /
Daily Notes /
Forecast /
Economic Events /
Search /
Terms and Conditions /
Disclaimer /
Books /
Online Books /
Site Map /
Contact /
Privacy Policy /
Links /
About /
Day Trading Forum /
Investment Calculators /
Pivot Point Calculator /
Market Profile Generator /
Fibonacci Calculator /
Mailing List /
Advertise Here /
Articles /
Financial Terms /
Brokers /
Software /
Holidays /
Stock Split Calendar /
Mortgage Calculator /
Donate
Copyright © 2004-2023, MyPivots. All rights reserved.
Copyright © 2004-2023, MyPivots. All rights reserved.