intra-day V.W.A.P. (VWAP)
Click image for original size
so glad you started this Joe...here is what I was watching today....
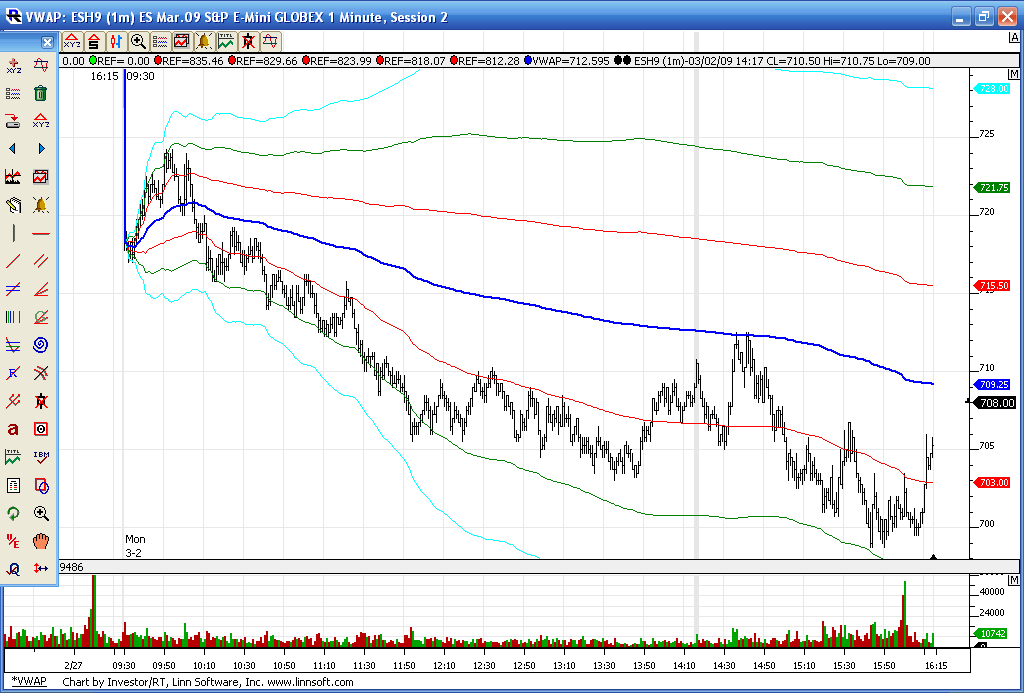
It's the dynamic Vwap as the Blue Line....then the Red lines are + - one standard deviation, green are + - 2 sd's and the light blue are 3 sd's out.....I have to give credit to Jperl over at Traders labaratory for the inspiration on this....
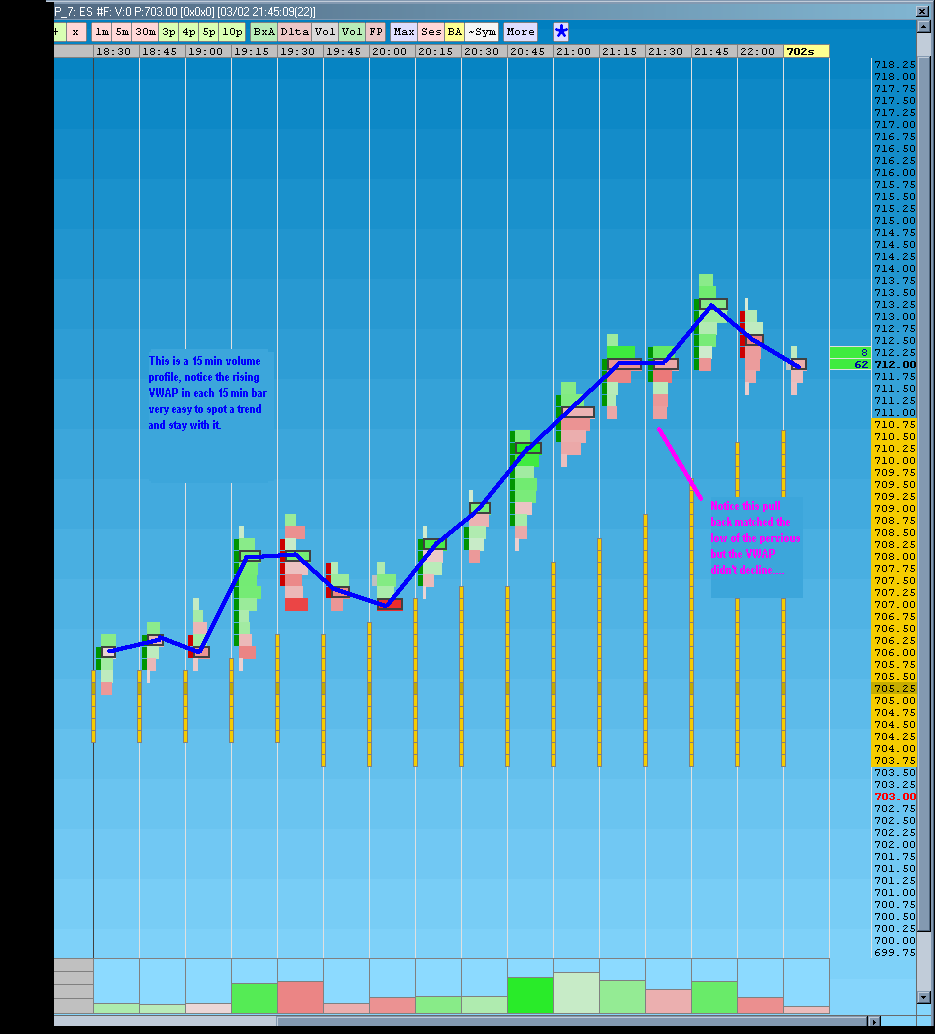
This is what I used in the merged profiles thread when I said we gotta watch that 712.50 area as the Vwap and single prints where there...lots to do with this...sure wish I had more time to play with it.......the lines will carry over into tomorrow and overnight....so first SD band is at 715.50...2nd at 21.75 etc....I assume this almost mimics a Volume profile but I'm no math expert on this.....better brains can set me straight
It's the dynamic Vwap as the Blue Line....then the Red lines are + - one standard deviation, green are + - 2 sd's and the light blue are 3 sd's out.....I have to give credit to Jperl over at Traders labaratory for the inspiration on this....
This is what I used in the merged profiles thread when I said we gotta watch that 712.50 area as the Vwap and single prints where there...lots to do with this...sure wish I had more time to play with it.......the lines will carry over into tomorrow and overnight....so first SD band is at 715.50...2nd at 21.75 etc....I assume this almost mimics a Volume profile but I'm no math expert on this.....better brains can set me straight
Click image for original size
Click image for original size
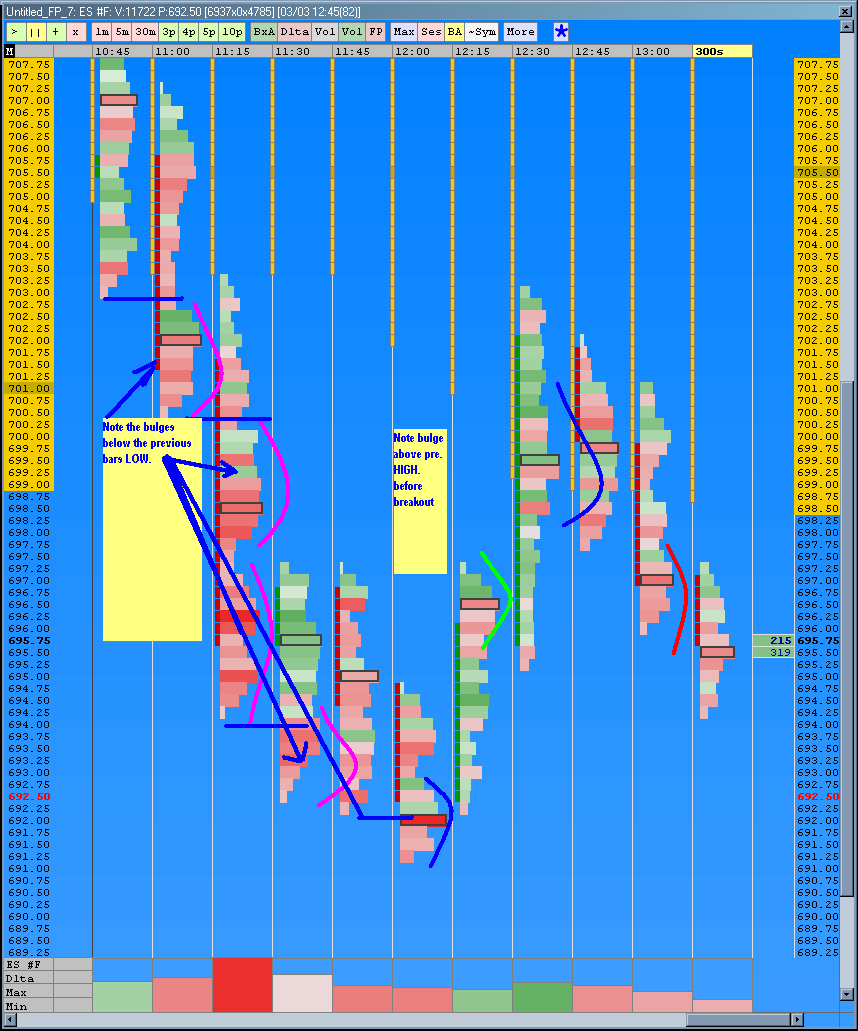
I should explain the chart above better...its a simple concept wait for the new probe (break out) to accept the new price, and that is done through bulges or lots of volume, or spending an extended time at the new prices. If the breakout is rejected there will be no bulge. This concept works well with market profile.
here is how my Vwap ended today...horizontal solid green , red and Cyan are yesterdays SD levels...solid horizontal blue line is yesterdays Vwap....but this method lets me see how far extended we are above or below value without having to keep my MP charts up......this is my Future....lol....Mp charts will probably be only used to see single prints down the road for me..
Now I can use price action entries without flipping charts around..
It should be noted that the overnight high was 715 which was right on one of yesterdays Vwap lines....
Now I can use price action entries without flipping charts around..
It should be noted that the overnight high was 715 which was right on one of yesterdays Vwap lines....
Click image for original size
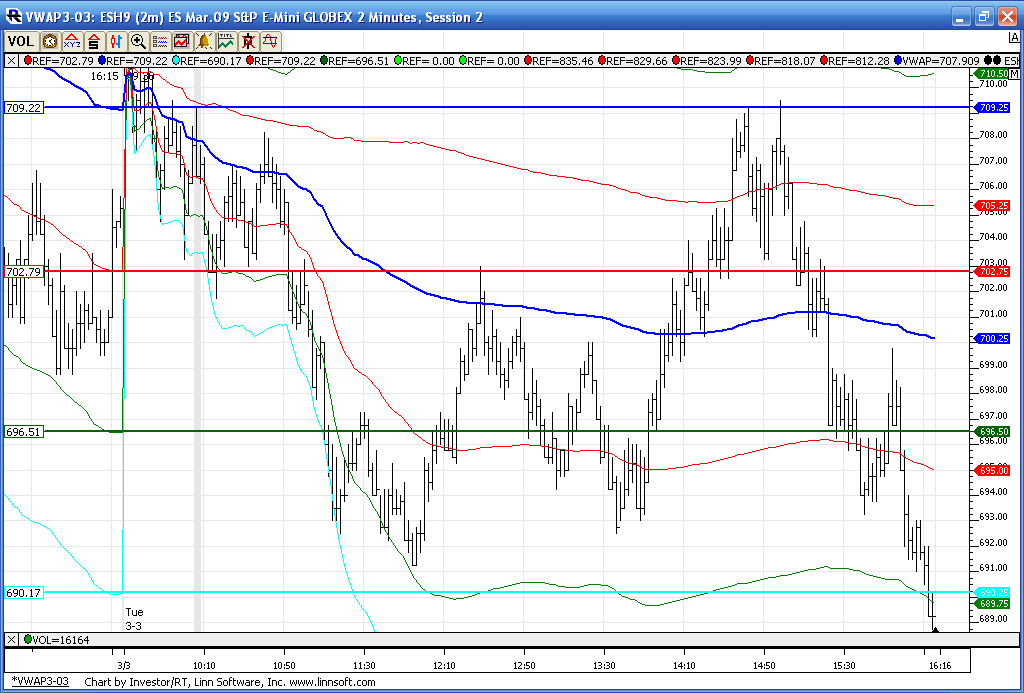
The vwap lines to watch in the overnight are 689.75, 695, 700.25, 705.25, 710.50 and two that I couldn't fit on that screen capture above 684.50 and 715.75..we'll watch going forward how these lines work...or don't.....
Bruce,
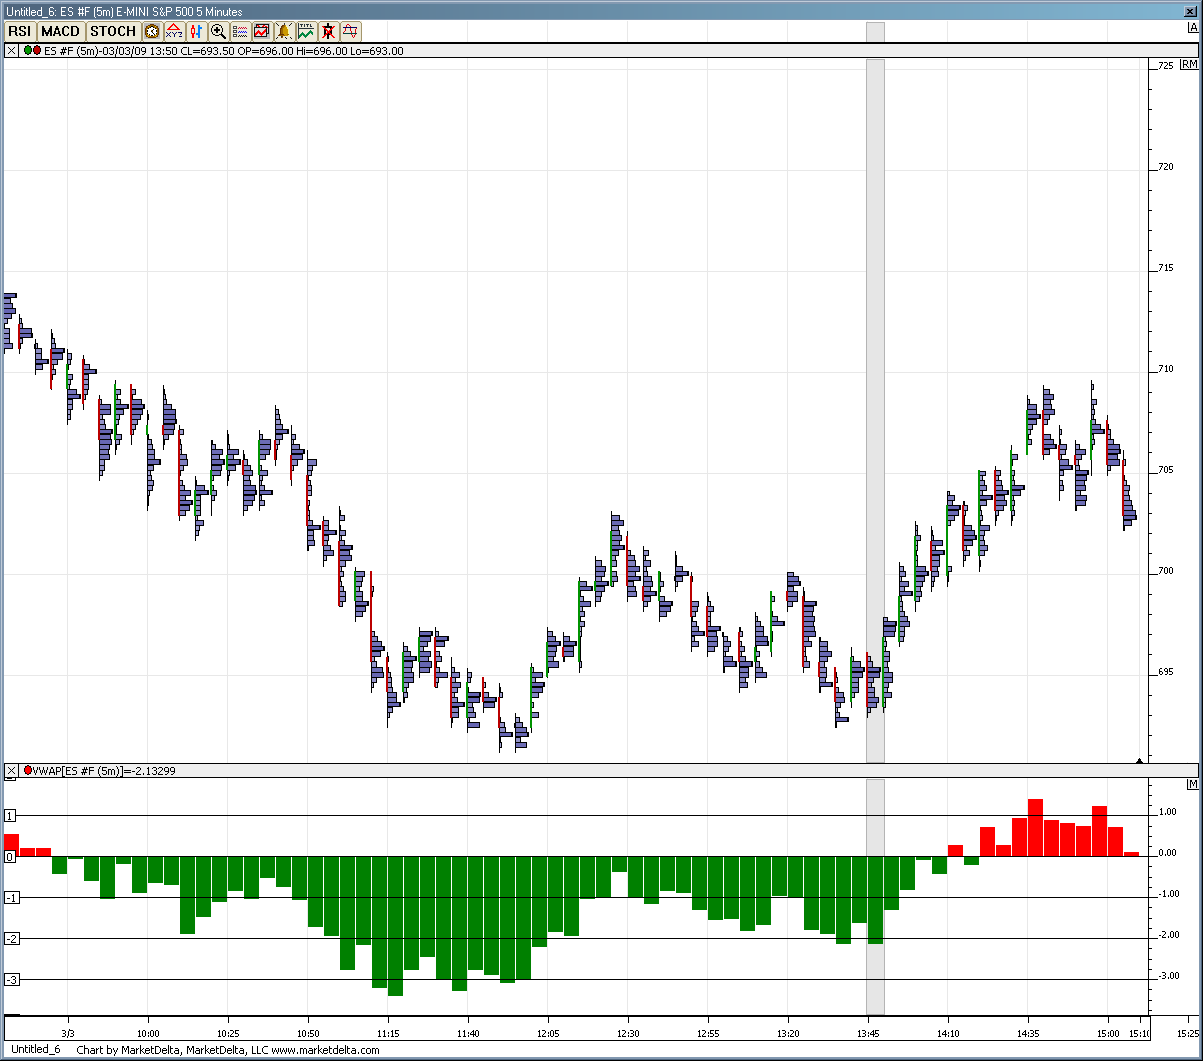
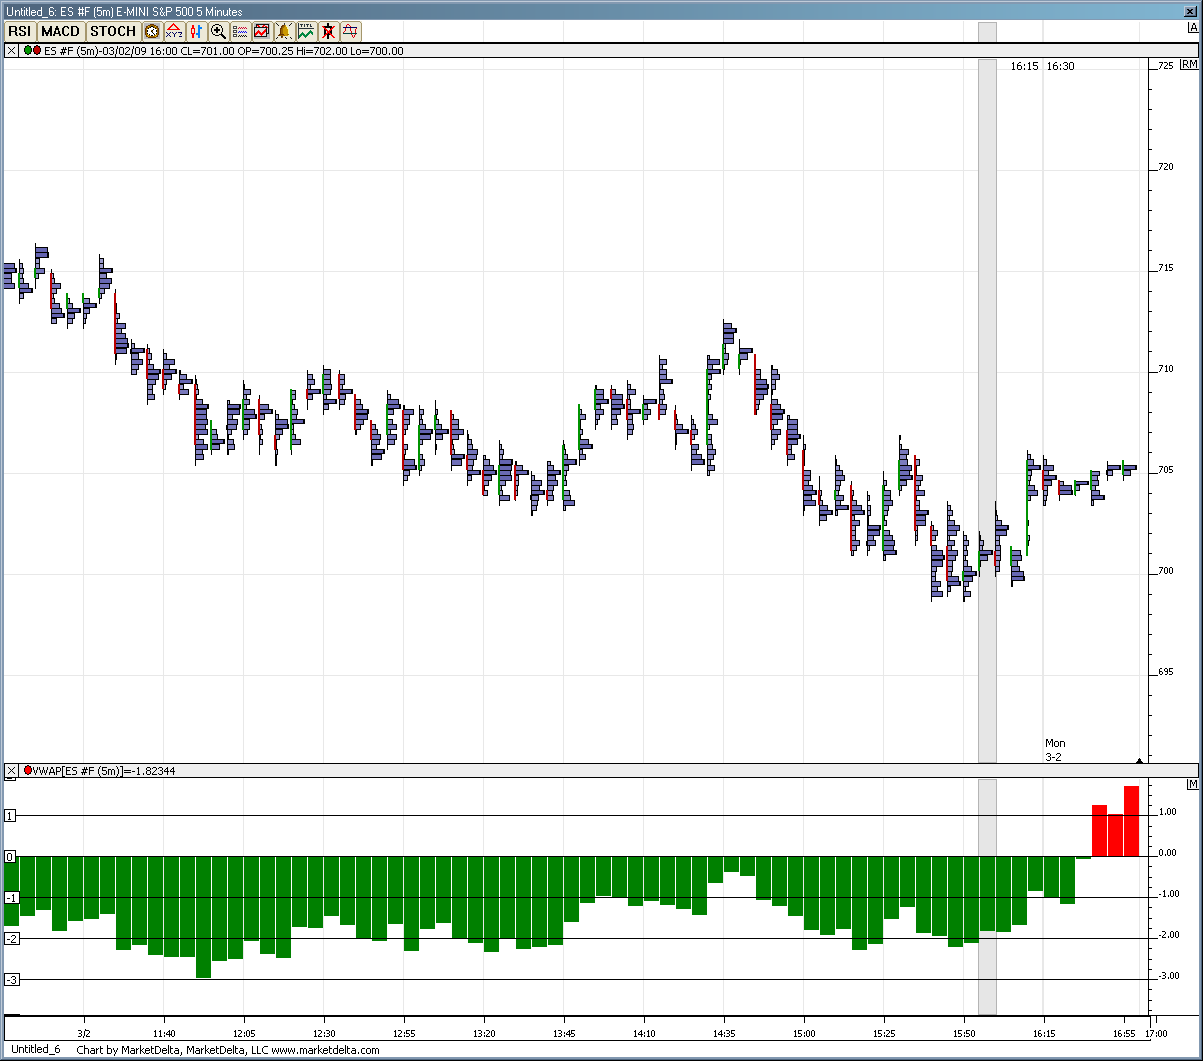
I found a VWAP oscillator std dev above/below vwap, check these out I am going to keep an eye on these and see how they do tommorrow
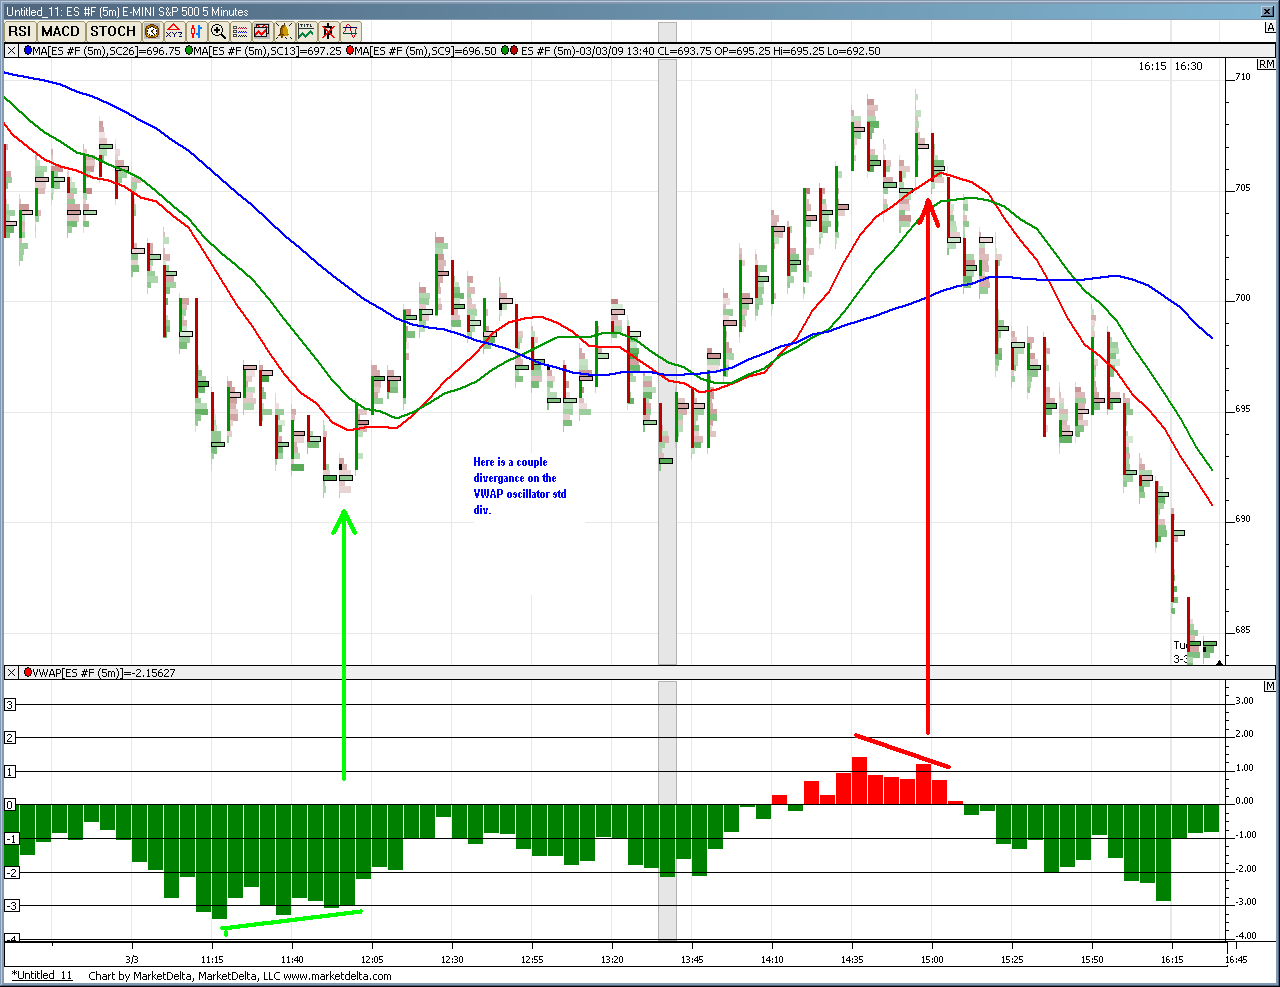
These are the last 2 days notice what happens when the oscillator makes a low or high then the next bar crosses that bar, results in a trend change.....
I found a VWAP oscillator std dev above/below vwap, check these out I am going to keep an eye on these and see how they do tommorrow
Click image for original size
Click image for original size
These are the last 2 days notice what happens when the oscillator makes a low or high then the next bar crosses that bar, results in a trend change.....
Click image for original size
btw Bruce,
I found that the V.W.A.P. seems to work a lot better in the globex overnight trading. I'll post some charts later.
I found that the V.W.A.P. seems to work a lot better in the globex overnight trading. I'll post some charts later.
I'm not showing divergences on my bands...are u keeping it at 24 hr sessions? or is the histogram doing something different?
So far I like to track a new vwap for each day with yesterdays levels "snapped" on the current days chart
So far I like to track a new vwap for each day with yesterdays levels "snapped" on the current days chart
Bruce;
How long do you keep the prior levels snapped on your chart. It seems the
market never forgets a price?
How long do you keep the prior levels snapped on your chart. It seems the
market never forgets a price?
I've just seen that the latest (just released) version of eSignal (10.4) includes VWAP. Have any of you tried it? From eSignal's product news page:
quote:
VWAP Calculator
Under the Tools menu is a new calculator that allows you to get a VWAP value when certain dates / times are specified. You can also apply size filters to include or exclude trades of a given size to estimate where certain trading groups are putting their money into the market. That is to say, you can determine what the VWAP would be if large block trades are removed or if only large block trades are used.
Alternatively, the Weekly VWAP could be generated with this tool, which is a nice way to see what the average price was for the week.
Emini Day Trading /
Daily Notes /
Forecast /
Economic Events /
Search /
Terms and Conditions /
Disclaimer /
Books /
Online Books /
Site Map /
Contact /
Privacy Policy /
Links /
About /
Day Trading Forum /
Investment Calculators /
Pivot Point Calculator /
Market Profile Generator /
Fibonacci Calculator /
Mailing List /
Advertise Here /
Articles /
Financial Terms /
Brokers /
Software /
Holidays /
Stock Split Calendar /
Mortgage Calculator /
Donate
Copyright © 2004-2023, MyPivots. All rights reserved.
Copyright © 2004-2023, MyPivots. All rights reserved.