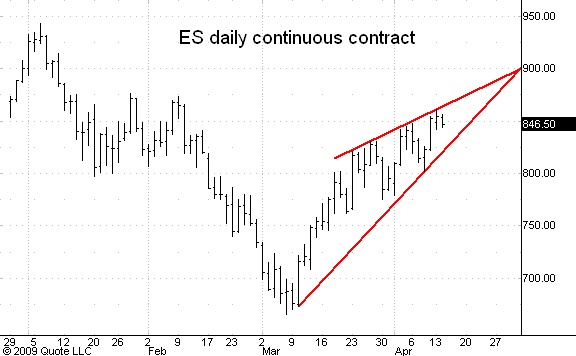
ES rising wedge
Here is something I'm keeping a close eye on, especially as this rises right into some of my key areas. Please refer to my April '09 commentary on my website, which shows the overhead areas I am watching. There is also a minor area that was hit at today's (4/13/09) high.
This is a rising wedge, and is very bearish, and quite ominous looking. You can draw the lines a bit different if you want, perhaps not starting at the low, but starting at the 3/30 or 4/1 low, but the pattern is the same. Having this pattern form right into key areas makes it all the more ominous. Just something I am watching, as always, price action is key.
Chart created with QCharts, courtesy eSignal
Click image for original size
This is a rising wedge, and is very bearish, and quite ominous looking. You can draw the lines a bit different if you want, perhaps not starting at the low, but starting at the 3/30 or 4/1 low, but the pattern is the same. Having this pattern form right into key areas makes it all the more ominous. Just something I am watching, as always, price action is key.
Chart created with QCharts, courtesy eSignal
jim thx fpr chart can i just ask is 900 significant because of the round number plus these linss or something else the most significant level I have found is 942.5 whixh has multiple numbes and paterns coming in there I actully found 876 to be more in terms of numbers significant than 900 but have to admit wasnt watching this wedge so thku for pointing it out.
Thx, Jim, i read it as an ending diagonal, and have been watching it for about a week now also. daily projection at 862.50 appears to have been met.
Click image for original size
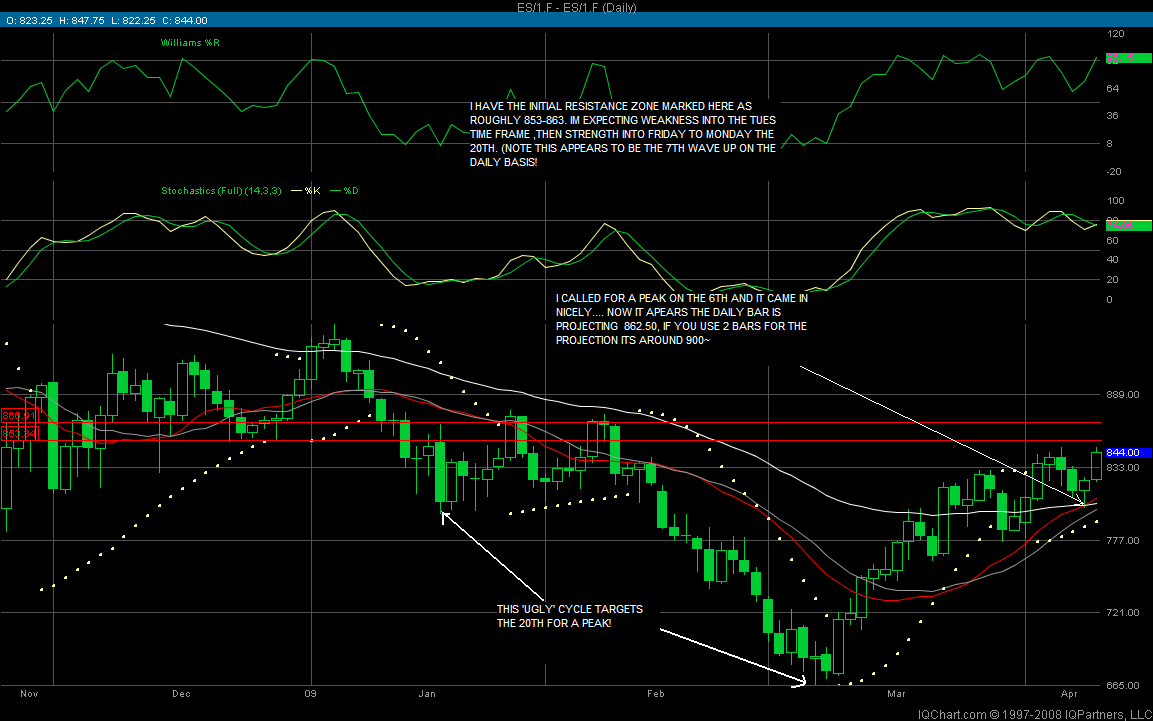
this was posted in my room on the 9th
thx Koolblue appreciate you sharing this
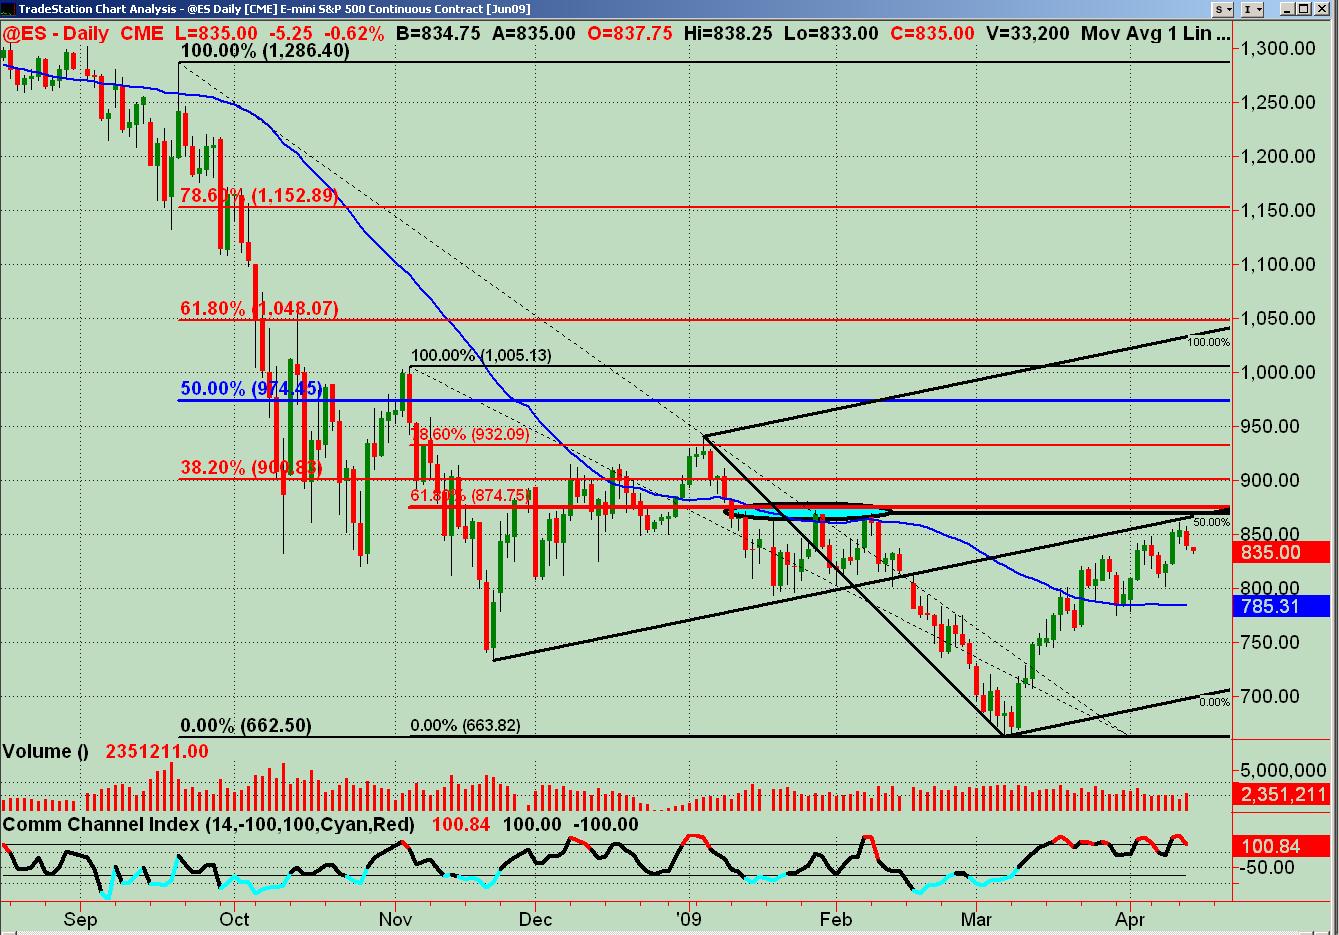
Here's what I've been looking at with the ES daily for the past week ... fib rtc level and significant price resistance as well as an old Andrew's Pitchfork tossed on top (sounds like a food recipe) ... looking at a reaction back down off of this area now. Just my plugged nickel.
Click image for original size
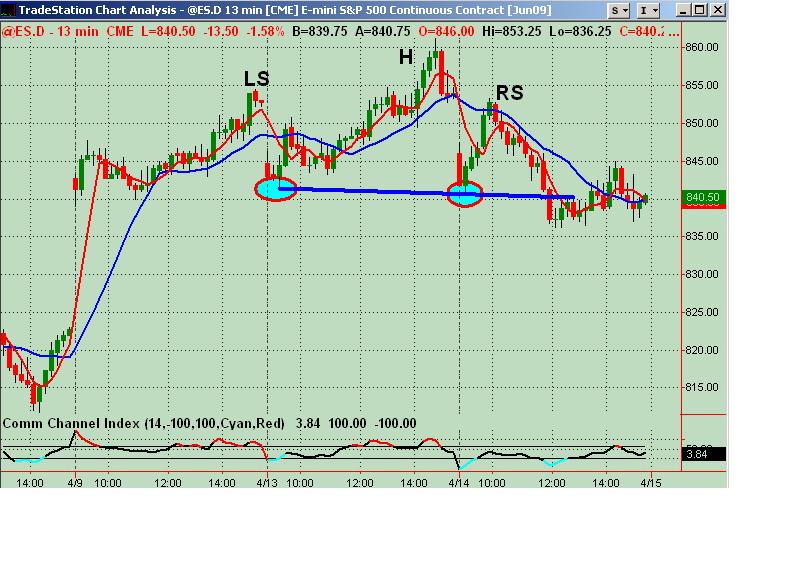
Here's drilling down on a 13 minute chart that's showing a Head and Shoulders "look" of a potential topping pattern for the short term combined with my prior post of the daily ES chart. Sorry for any chart sizing miscues until I get the hang of this. Open for any feedback!
Click image for original size
quote:
Originally posted by jimkane
Here is something I'm keeping a close eye on, especially as this rises right into some of my key areas. Please refer to my April '09 commentary on my website, which shows the overhead areas I am watching. There is also a minor area that was hit at today's (4/13/09) high.
Click image for original size
This is a rising wedge, and is very bearish, and quite ominous looking. You can draw the lines a bit different if you want, perhaps not starting at the low, but starting at the 3/30 or 4/1 low, but the pattern is the same. Having this pattern form right into key areas makes it all the more ominous. Just something I am watching, as always, price action is key.
Chart created with QCharts, courtesy eSignal
on a daily chart that would be an EDT - an EDT wave D cannot exceed the top channel line - bulls need to clear 850
quote:Nick, that key 883 area I am watching also has a key .300 at 898, and the main lines are in the area, so 900 could be considered within this same zone. Once I get to a general area it is all about the price action, and for a daily/weekly area, the width of the area is quite a bit wider than what we see as daytraders, of course. So, 900 is within the range I am looking at. Please see the detailed charts in the commentary for the main levels and areas I am watching.
Originally posted by nick taylor-stoddard
jim thx fpr chart can i just ask is 900 significant because of the round number plus these linss or something else the most significant level I have found is 942.5 whixh has multiple numbes and paterns coming in there I actully found 876 to be more in terms of numbers significant than 900 but have to admit wasnt watching this wedge so thku for pointing it out.
quote:Kool! Thanks for stopping in, I hope you do it more often. Yes, I have also been watching this same area as you have (we do a lot of the same Fib calculations, so that shouldn't surprise either of us), and although higher is surely possible, I am ready for more downside, as this is really showing a lot of short-term topping signs.
Originally posted by koolblue
Thx, Jim, i read it as an ending diagonal, and have been watching it for about a week now also. daily projection at 862.50 appears to have been met.
As a side note, just so everyone understands my terms as I use them, the 3-drives tends to be 'symmetrical' in that it usually follows a parallel channel, with each pullback somewhat uniform, whereas the rising wedge forms a triangle if you will, where each pullback is getting smaller and smaller, tightening the coil, as we have here.
just my 2.5 cents :)
Emini Day Trading /
Daily Notes /
Forecast /
Economic Events /
Search /
Terms and Conditions /
Disclaimer /
Books /
Online Books /
Site Map /
Contact /
Privacy Policy /
Links /
About /
Day Trading Forum /
Investment Calculators /
Pivot Point Calculator /
Market Profile Generator /
Fibonacci Calculator /
Mailing List /
Advertise Here /
Articles /
Financial Terms /
Brokers /
Software /
Holidays /
Stock Split Calendar /
Mortgage Calculator /
Donate
Copyright © 2004-2023, MyPivots. All rights reserved.
Copyright © 2004-2023, MyPivots. All rights reserved.