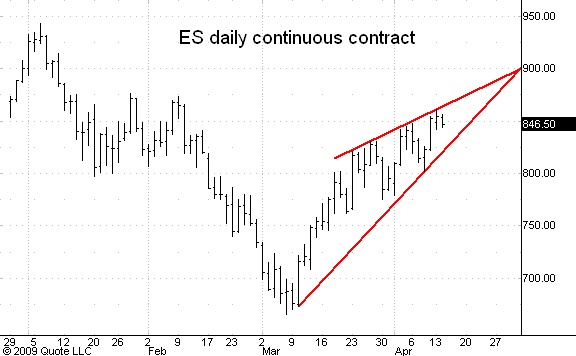
ES rising wedge
Here is something I'm keeping a close eye on, especially as this rises right into some of my key areas. Please refer to my April '09 commentary on my website, which shows the overhead areas I am watching. There is also a minor area that was hit at today's (4/13/09) high.
This is a rising wedge, and is very bearish, and quite ominous looking. You can draw the lines a bit different if you want, perhaps not starting at the low, but starting at the 3/30 or 4/1 low, but the pattern is the same. Having this pattern form right into key areas makes it all the more ominous. Just something I am watching, as always, price action is key.
Chart created with QCharts, courtesy eSignal
Click image for original size
This is a rising wedge, and is very bearish, and quite ominous looking. You can draw the lines a bit different if you want, perhaps not starting at the low, but starting at the 3/30 or 4/1 low, but the pattern is the same. Having this pattern form right into key areas makes it all the more ominous. Just something I am watching, as always, price action is key.
Chart created with QCharts, courtesy eSignal
Thanks for the feedback Jim. The market has shaken off bad news and negative economic reports. It's pushed through several technically significant levels of price resistance (ex. 800 ES). And now there's another significant resistance level noted on the prior chart's I've posted among other folk's postings ... including this rising wedge. This bear market bounce/rally (bottom??) has unfolded as a smooth trend up for roughly 6 weeks now. It's a large percentage move which one would think "overbought" perhaps. But the daily pullbacks have been small, lasting only 2 to 3 days so far. This persistent buying strength has me wondering if the current highs here are a turning point or not. So, I'm hesitant to trade short except for intraday scalps, not expecting a plunge down. At this point I'm biased to long trades but will wait to see what price action occurs at this 860-875 level (ES) for more aggresive trading and position size.
Just going off the technicals here ... bot some puts on the SPY ... May 84 strike. It's a small position (20 contracts) and based upon the resistance on the charts I'd posted earlier. Will likely trade around the position with ES contracts here and there for better or worse ... but playing it for a pullback/selloff during the next 5 to 10 days. At least with the small option position I can take a swing at what I'd usually do outright with shorting ES contracts ... but can hold these which allows me to trade it as I should and with a decent risk/reward position. Just throwing out what I'm doing based on my (and others) chart analysis here. Am open to any feedback. Hope my prior missives have offered decent enough specifics for why I had to go short (effectively).
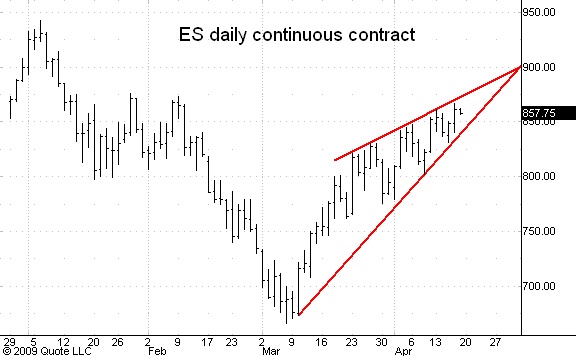
Here's an update on that chart.
I think it invalidated the 'ending diagonal' as most were counting it. The 'rising wedge', which is basically the same thing but without Elliott wave 5 context or a 5 count in the wegde, is still valid, as it is more general and has no count to it. But, with a little slight of hand, as Elliotticians are so good at, we can just change the count and magically it is still valid. You simply change where you start wave 5.
This came very close (close enough for me) to the bottom of my first primary area since the 666 bottom on my daily/weekly charts, and started to sell. With GOOG taking 30 off its aftermarket high, one could make the case we may be started here. I do have a few issues, though. Every last trader I know has positioned with puts super-duper heavy. Now, most of these are good traders, not the 'dumb money', but still, that worries me a bit. Next, GOOG has this magical habit of selling off hard like this, then I get up in the morning and lo and behold, it's ready for a monster gap up. You wonder who came in, and why they didn't want anything to do with it off 30 from the highs. But since they love to do things like this, until I see what they do with it tomorrow morning, I'm not thinking anything is happening anywhere yet. And with C and GE on deck tomorrow, anything is possible.
Chart created with QCharts, courtesy eSignal
Click image for original size
I think it invalidated the 'ending diagonal' as most were counting it. The 'rising wedge', which is basically the same thing but without Elliott wave 5 context or a 5 count in the wegde, is still valid, as it is more general and has no count to it. But, with a little slight of hand, as Elliotticians are so good at, we can just change the count and magically it is still valid. You simply change where you start wave 5.
This came very close (close enough for me) to the bottom of my first primary area since the 666 bottom on my daily/weekly charts, and started to sell. With GOOG taking 30 off its aftermarket high, one could make the case we may be started here. I do have a few issues, though. Every last trader I know has positioned with puts super-duper heavy. Now, most of these are good traders, not the 'dumb money', but still, that worries me a bit. Next, GOOG has this magical habit of selling off hard like this, then I get up in the morning and lo and behold, it's ready for a monster gap up. You wonder who came in, and why they didn't want anything to do with it off 30 from the highs. But since they love to do things like this, until I see what they do with it tomorrow morning, I'm not thinking anything is happening anywhere yet. And with C and GE on deck tomorrow, anything is possible.
Chart created with QCharts, courtesy eSignal
this ending diagonal was addressed on elliot wave and the technician said everyone who wrote and said the 861.5 high was the top were in his opinion wrong he said it counted better wth higher prices and based on yesterdays price action he turned out to be right
Further observation: With fib rtc cluster here on daily chart combined with several swing high price areas in the ES 870-880 ... along with the rising wedge (among other things) it seems the market is still controlled by buyers. This morning opened virtually even with yesterday's close, and yesterday had a late day run up into the finish. So called "negative" earnings news among other info should've had the market gap down decently (or open and sell off) IMO. Instead, it opened and held up in a tight range for roughly an hour. Covered puts at roughly BE, and just sat back to watch. Will revert back to seeing what price does in the 870-880 resistance area. The way the market is acting, it seems to me that if it pushes through that price area, it could see 900. Would like to see a parabolic move (call it a micro "blow off") and then reassess on the charts and how the market is doing at shirking off bad news. Will just focus on intraday scalping for the rest of the day and revisit more analysis this weekend and coming into next week.
thx mm I agree mind you thought earning were mixed they like citi didnt like google and ge was mixed beat on earning missed on revenue but to be fair they are a lottery because unless you know the wisper numbers analyst forecasts are crap anyway which is why you let the price action guide you as I try to do and less focused on news events especially earnings because I dnt trust any of them they are in the business of talking things up hv ou levels marked on my charts so at least I am in the right camp for a change.
Considering the rising wedge and also earlier posts of Jim and also a couple of charts posted earlier in this thread ... there was a reaction off of what appeared to be a significant resistance ES level on the daily chart. To follow up, the selloff/pullback(?) on Monday worked out decently. But considering the intermediate uptrend, I've taken the same chart and added a regression trendline based upon closing prices from the low 6 weeks back. I then created a parallel line to that trendline and aligned it with the low from 6 weeks back. Did this over the weekend for a possible pullback area for a bounce or resumption of intermediate uptrend. The 2 thick blue lines were what I drew with the lower one of the 2 being potential "support." Maybe this speaks to continued strength overall ... or at least short profit taking area and/or a price level to initiate a long, especially considering the recent and strong uptrend.
Click image for original size
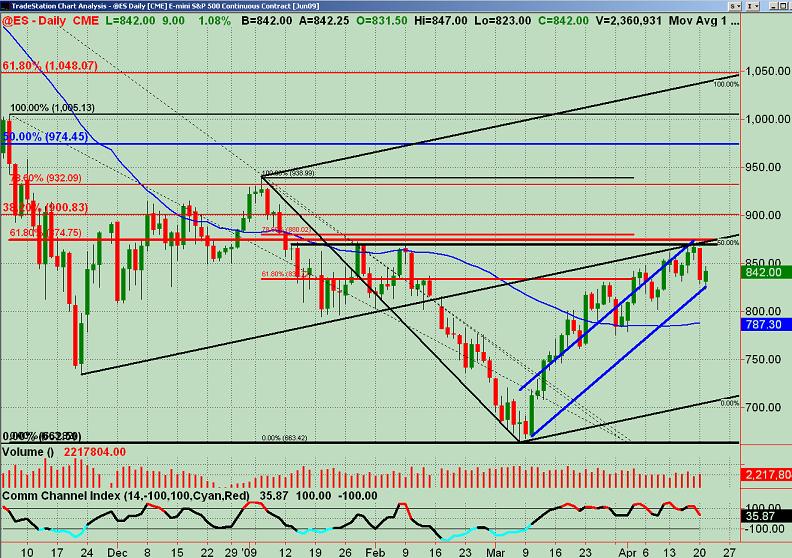
Addendum: Forgot to mention that there was an ES daily gap back down to the high of 4/8/09 at ES 85.25 which also was today's daily R1 floor pivot (calculated on RTH), both at virtually the same price level which coincided with the trendline I just posted above. Open to any additional comments here for drilling down into potential places to consider a trade (long or short).
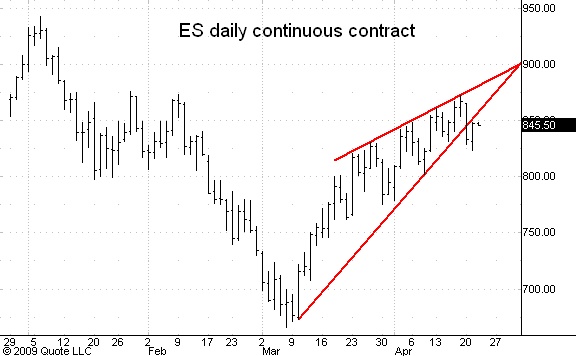
Here's an update of the daily chart.
I have now seen this rising wedge/ending diagonal on about every forum, website, and newsletter that there is. That makes me think it simply can not do what is expected. It moved to the first area everyone watches, the previous swing low, and has bounced up to 'test' the line from below. It would be a classic outcome for it to roll down from here and hit the next area most expect for such a pattern, the next swing low, which is the one the count for an ending diagonal shows as the start of the pattern. Regardless of which swing you want to see as the next area to watch, it's lower. This may all come to pass as expected, in classic form. But with every last trader on the planet watching this and giving it the full court press, I think it will trap everyone who attemts to trade around this in any fashion.
I think a sharp spike well above the upper line is probable. Perhaps it rolls down a bit first to trap some more shorts, although I think a gap up is more likely. I saw a lot of people shorting this thing on the rise today. Lots of put buyers on strength. So, maybe they have enough people trapped already. I have no idea what they'll do, I don't make predictions (and don't need to in order to find trade setups), but I do think we are going to see some fantastic traps sprung in here. My next key area above the high is around 883-885, maybe 898 (see my website for charts), but that wouldn't break that top line by very much. On the way there I'm watching around 857, which is a better test of that lower line from below, and I have some other lines and Fibs and such in there.
Today's high was a key area, too, so it wouldn't surprise me if it rolled over in here, from a technical standpoint. From a sentiment standpoint, I think they want to run to the 942 area, then the 1012-18 area, then the 1070-77 area, and then... as outlined on my website. I also have a nice time factor for that 942 area by the end of Friday or early Monday, and that would spike it over that upper line. Just some things I am watching, I always follow whatever the price action and intraday setups tell me.
Chart created on QCharts, courtesy eSignal
Click image for original size
I have now seen this rising wedge/ending diagonal on about every forum, website, and newsletter that there is. That makes me think it simply can not do what is expected. It moved to the first area everyone watches, the previous swing low, and has bounced up to 'test' the line from below. It would be a classic outcome for it to roll down from here and hit the next area most expect for such a pattern, the next swing low, which is the one the count for an ending diagonal shows as the start of the pattern. Regardless of which swing you want to see as the next area to watch, it's lower. This may all come to pass as expected, in classic form. But with every last trader on the planet watching this and giving it the full court press, I think it will trap everyone who attemts to trade around this in any fashion.
I think a sharp spike well above the upper line is probable. Perhaps it rolls down a bit first to trap some more shorts, although I think a gap up is more likely. I saw a lot of people shorting this thing on the rise today. Lots of put buyers on strength. So, maybe they have enough people trapped already. I have no idea what they'll do, I don't make predictions (and don't need to in order to find trade setups), but I do think we are going to see some fantastic traps sprung in here. My next key area above the high is around 883-885, maybe 898 (see my website for charts), but that wouldn't break that top line by very much. On the way there I'm watching around 857, which is a better test of that lower line from below, and I have some other lines and Fibs and such in there.
Today's high was a key area, too, so it wouldn't surprise me if it rolled over in here, from a technical standpoint. From a sentiment standpoint, I think they want to run to the 942 area, then the 1012-18 area, then the 1070-77 area, and then... as outlined on my website. I also have a nice time factor for that 942 area by the end of Friday or early Monday, and that would spike it over that upper line. Just some things I am watching, I always follow whatever the price action and intraday setups tell me.
Chart created on QCharts, courtesy eSignal
just my 2.5 cents :)
Emini Day Trading /
Daily Notes /
Forecast /
Economic Events /
Search /
Terms and Conditions /
Disclaimer /
Books /
Online Books /
Site Map /
Contact /
Privacy Policy /
Links /
About /
Day Trading Forum /
Investment Calculators /
Pivot Point Calculator /
Market Profile Generator /
Fibonacci Calculator /
Mailing List /
Advertise Here /
Articles /
Financial Terms /
Brokers /
Software /
Holidays /
Stock Split Calendar /
Mortgage Calculator /
Donate
Copyright © 2004-2023, MyPivots. All rights reserved.
Copyright © 2004-2023, MyPivots. All rights reserved.