One mans guess
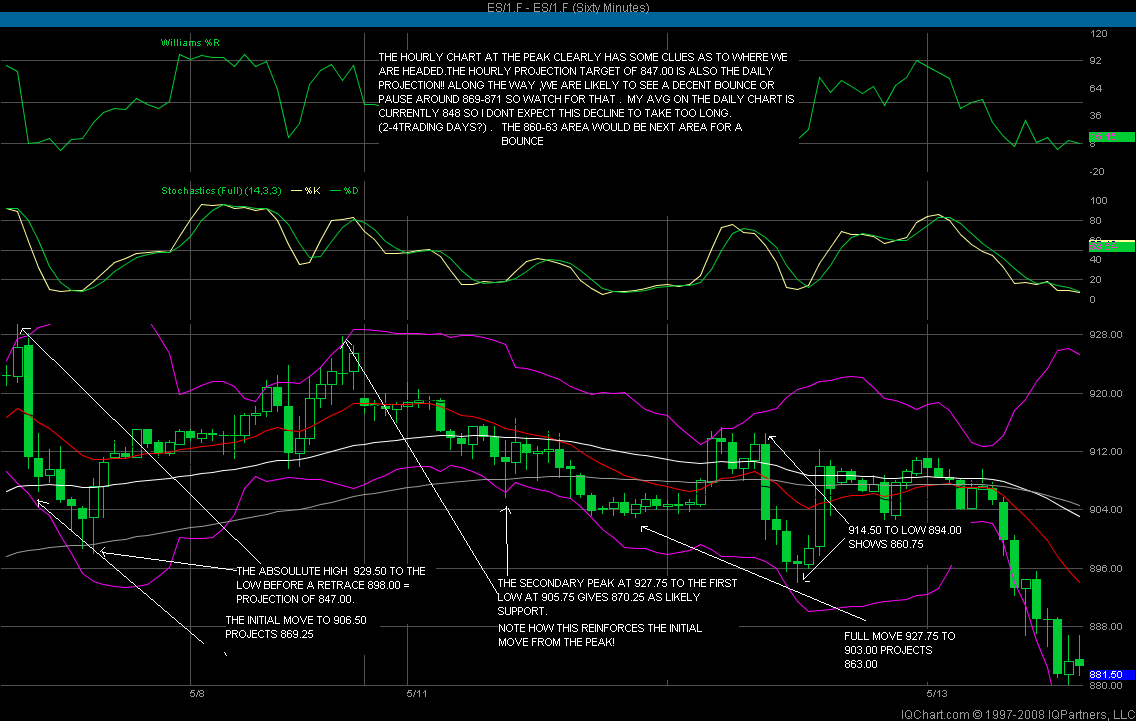
Well, the picture is becoming clearer, a decent decline here, and then higher....much higher into july! heres what Kools Tools are saying F.W.I.W.!
Click image for original size
Click image for original size
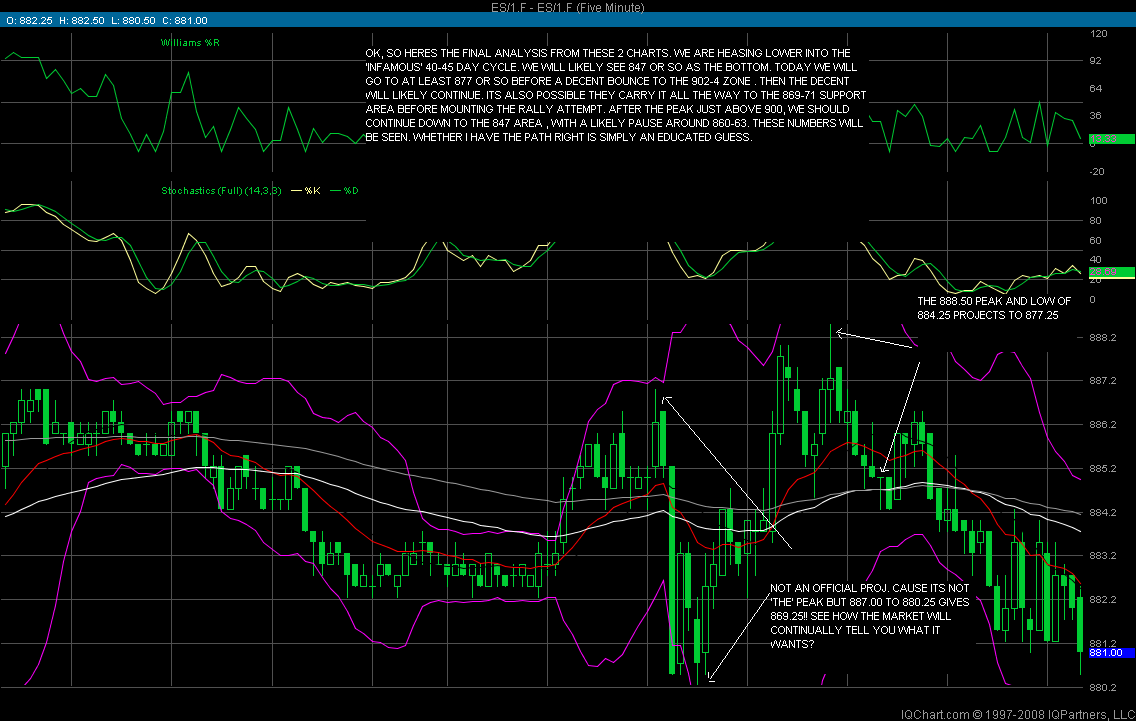
well, so far so good... was actually looking for 877.25 and it only got to 878.75, missed by 6 ticks! Now we'll see if they can get to 898-9 or even the 902-4 zone by tomorrow morning! time will tell!
Interesting "count" I saw on the 5min chart looking at a couple of swing lows (if I counted right based on your cycle ideas ... used time to make it easier) ... high swing bar showed up on schedule (topping at 896.75 and pulled back a bit so far), assuming my kindergarten teacher didn't lead me astray in the math arena. Nice!
Still biased long in the bigger picture ... this could've been useful for waiting and positioning long intraday (or even on a bigger time frame) here on a pullback entry ... or even a short ... thinking in terms of decent scalping opportunities.
Also, the cycle/time approached within a point or so of a price projection you mentioned in the above charts/comments. Just wondering if the cycle swings for timing must be from the original swing lo/hi that the price projection is taken for time/price coinciding ... or if other swings can be used for price projection and vice versa?
Your thoughts?
Actually, I may have goofed up the cycle count??? As opposed to counting bars I simply used "time" and maybe had a brain fart ... dunno!
unfortunally, the cycle started by the swing low is rarly going to forcast 'the' top but simply a top. think of it like calling for the wave 3 top not the wave 5 one (at least in elliot terms). none the less i made money today as usual , and surprisingly was fairly accurate on my 'map' of the action! missed by 6 ticks on the downside and 5 on the upside.
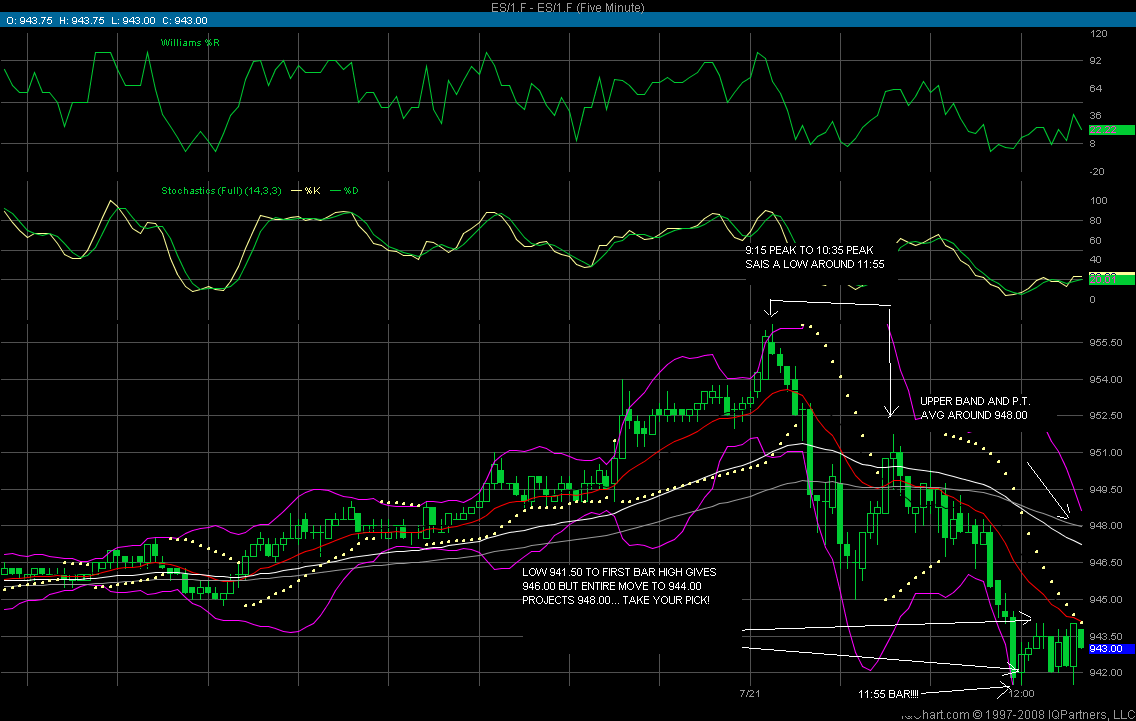
Click image for original size
...
by the way, longer term i remain bullish also!! as my previous charts have tried to explain
ok ... see what you're looking at here. I'd worked off the bar 1 bar 19 to project ... and had the bar 38 (though I'd initially mistakenly arrived at the bar 16 peak because I was using my mouse and just adding the time to a potential peak and did my mental time math incorrectly). I felt that the roundness and (for lack of a better word) symmetry between the bar 1 and 19 would be most valid and effective. There's obviously a little bit of art in this which is why I've asked some questions here and there in other posts. Thanks for a great chart of explanation Koolio!!!
Now, the million $ question is which low (or lows) did you use to project the potential price level on the above chart. That would bring it all together for me, at least for now with the basics?
kool, there's a separate thread that has been opened here, in search of you...
http://www.mypivots.com/forum/topic.asp?TOPIC_ID=4789
http://www.mypivots.com/forum/topic.asp?TOPIC_ID=4789
Emini Day Trading /
Daily Notes /
Forecast /
Economic Events /
Search /
Terms and Conditions /
Disclaimer /
Books /
Online Books /
Site Map /
Contact /
Privacy Policy /
Links /
About /
Day Trading Forum /
Investment Calculators /
Pivot Point Calculator /
Market Profile Generator /
Fibonacci Calculator /
Mailing List /
Advertise Here /
Articles /
Financial Terms /
Brokers /
Software /
Holidays /
Stock Split Calendar /
Mortgage Calculator /
Donate
Copyright © 2004-2023, MyPivots. All rights reserved.
Copyright © 2004-2023, MyPivots. All rights reserved.