Trend Change or retracement?
I have a question I am looking for help on.
Has someone found a reliable indicator, or combination of indicators, or some other way, that from their personal trading experience can tell if an intra day direction change is a trend change as opposed to a retracement?
To explain my question further, some days the first leg is down, it retraces, and then the second leg is down, that is Leg2 is in the same direction as Leg1. On other days, the first leg is down and then it reverses trend and the remainder of the day is an uptrend.
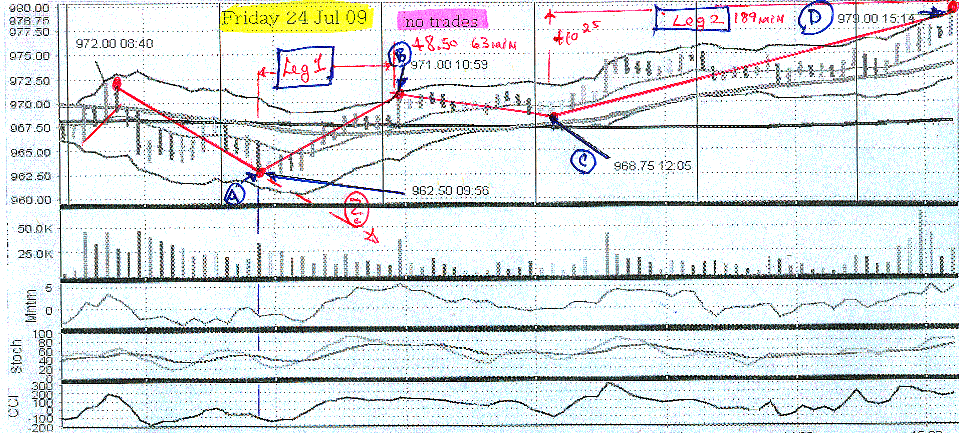
I have included a 5 min chart of Friday 24 July 2009 for the ESU9 (S&P emini Sep 09) contract, as an example (all times are CT).
From 972 at 8:40am it fell to 962.50 at 9:56 (marked point A). From A it rose to 971 at 10:59 or +8.5 pts in 63 min (point B). A to B I am calling Leg1.
Next it retrace to 968.75 at 12:05 or –2.25 pts in 66 mins (point C). Then it rises to 979 @ 15:14 or +10.25 in 189 mins (point D). From C to D I am calling Leg2.
In this example point A marks a Trend Change with the balance of the day now upward.
So in reference to this graph, my question is:
“At point A is there a way to tell that the balance of the day will be up?”
In other words:
“Is there a way to tell if point A will be marking the beginning of a retracement, that the next leg after the retracement will be down, that is in the same direction as 972 to 962.50, or is it a intra day trend change?”
I would note that one book waits until it has risen from A and it continues to rise beyond 61.8% or 968.25 and if it does then a trend change has taken place and the rise is not a retracement. (972-962.5 = 9.5*.618 = 5.75+962.5 =>968.25 = 61.8%.) I am looking for an answer at point A so this “if it retraces more than 61.8% it is a trend change” is not the answer I am looking for.
Thank-you to all.
Has someone found a reliable indicator, or combination of indicators, or some other way, that from their personal trading experience can tell if an intra day direction change is a trend change as opposed to a retracement?
To explain my question further, some days the first leg is down, it retraces, and then the second leg is down, that is Leg2 is in the same direction as Leg1. On other days, the first leg is down and then it reverses trend and the remainder of the day is an uptrend.
I have included a 5 min chart of Friday 24 July 2009 for the ESU9 (S&P emini Sep 09) contract, as an example (all times are CT).
From 972 at 8:40am it fell to 962.50 at 9:56 (marked point A). From A it rose to 971 at 10:59 or +8.5 pts in 63 min (point B). A to B I am calling Leg1.
Next it retrace to 968.75 at 12:05 or –2.25 pts in 66 mins (point C). Then it rises to 979 @ 15:14 or +10.25 in 189 mins (point D). From C to D I am calling Leg2.
In this example point A marks a Trend Change with the balance of the day now upward.
So in reference to this graph, my question is:
“At point A is there a way to tell that the balance of the day will be up?”
In other words:
“Is there a way to tell if point A will be marking the beginning of a retracement, that the next leg after the retracement will be down, that is in the same direction as 972 to 962.50, or is it a intra day trend change?”
I would note that one book waits until it has risen from A and it continues to rise beyond 61.8% or 968.25 and if it does then a trend change has taken place and the rise is not a retracement. (972-962.5 = 9.5*.618 = 5.75+962.5 =>968.25 = 61.8%.) I am looking for an answer at point A so this “if it retraces more than 61.8% it is a trend change” is not the answer I am looking for.
Thank-you to all.
Click image for original size
It was probably one of these two book both by Steve Nison: Japanese Candlestick Charting Techniques or Beyond Candlesticks
quote:
Originally posted by day trading
It was probably one of these two book both by Steve Nison: Japanese Candlestick Charting Techniques or Beyond Candlesticks
Thanks Daytrading!
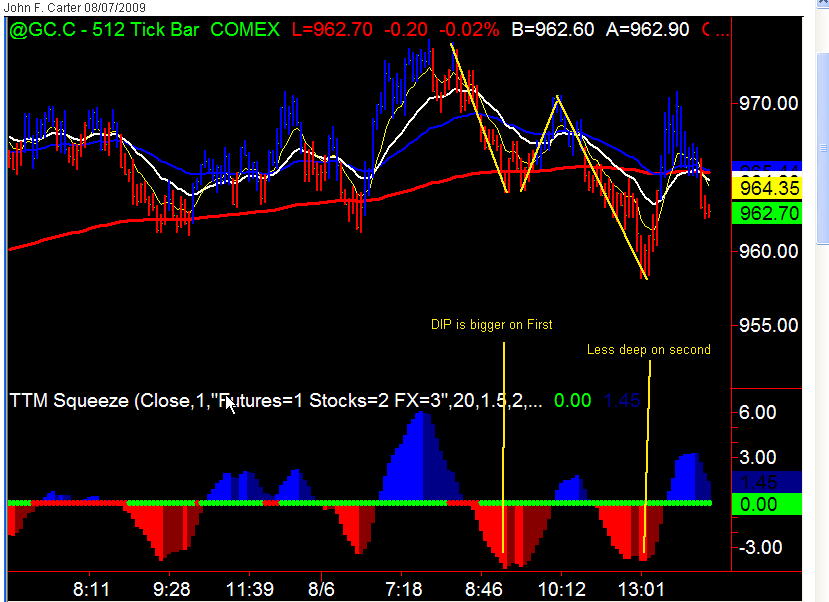
From the free video of trade the markets
http://www.tradethemarkets.com/public/3706.cfm
In this screensnap of GC I noticed that at the retracement bottom his TTM squeeze indicator was deeper than on the reverse trend bottom (the second V bottom)
Any guesses on what his "squeeze indicator" is?
http://www.tradethemarkets.com/public/3706.cfm
In this screensnap of GC I noticed that at the retracement bottom his TTM squeeze indicator was deeper than on the reverse trend bottom (the second V bottom)
Any guesses on what his "squeeze indicator" is?
Click image for original size
On traders lab one person offered
The price exhaustion is the formation of Shooting star or hammer.. No volume what so ever...
Most algo codes look for two consecutive exhaustions with a period of not more than 60 min to open a position .. This is the most reliable signal as far as TA is concerend... Using Exhaustion theories you can also calculate the risk of trade easily ... you find two exhaustion levels ( historically) as a bench mark and your risk will be the price differencial between the bench mark and the current price... you can also compare the risk to VWAP level to adjust yous pos size"
Perhaps you could tell me if this fits with your experience rexspeed?
blue;
On intra day I use volume with 5min. candles to confirm an area I belive is s/r.
For me volume is important in all time frames. I don't use ma's, vwap, macd ect.
so volume is my indicator.
On intra day I use volume with 5min. candles to confirm an area I belive is s/r.
For me volume is important in all time frames. I don't use ma's, vwap, macd ect.
so volume is my indicator.
Any guesses on what his "squeeze indicator" is?
As I know its a MidRange Indkator with 5 Bars .....and the Average is also 5 or something like that
quote:
Originally posted by zodei1
Any guesses on what his "squeeze indicator" is?
As I know its a MidRange Indkator with 5 Bars .....and the Average is also 5 or something like that
Thanks Zodei1,
I'm not clear on your reply.
What do you mean by a midrange indicator?
Emini Day Trading /
Daily Notes /
Forecast /
Economic Events /
Search /
Terms and Conditions /
Disclaimer /
Books /
Online Books /
Site Map /
Contact /
Privacy Policy /
Links /
About /
Day Trading Forum /
Investment Calculators /
Pivot Point Calculator /
Market Profile Generator /
Fibonacci Calculator /
Mailing List /
Advertise Here /
Articles /
Financial Terms /
Brokers /
Software /
Holidays /
Stock Split Calendar /
Mortgage Calculator /
Donate
Copyright © 2004-2023, MyPivots. All rights reserved.
Copyright © 2004-2023, MyPivots. All rights reserved.