Study says pivots don't work?
This simple study says that pivot points don't work; they author tested 10 major currency pairs for 2006 to the present and found that the price was no more likely to revert back to the pivot point than any other number [url]http://www.myforexdot.org.uk/PivotPointAnalysis.html[/url].
If pivots work, can someone suggest something that can be back tested to show that they have some statistical significance?
If pivots work, can someone suggest something that can be back tested to show that they have some statistical significance?
03-Dec-09
Key Price Levels
1114.00 07:32
1109.50 07:58
1117.00 08:47
1105.25 09:14
1110.75 12:41
1097.50 15:15
Daily Classic Pivot Points (ETH basis)
- PP --- * Price-* Dif
PP 1109.25 1110.75 -1.50
S2 1098.00 1097.50 0.50
Notes: S2 good for low of the day
Weekly Classic Pivot Points
- PP --- * Price-* Dif
R1 1111.75 1110.75 1.00
Notes: R1 close
Source of PP for ETH basis
http://www.mypivots.com/dn/?symbol=224
Daily Classic Pivot Points (RTH basis)
- PP --- * Price-* Dif
PP 1109.25 1110.75 -1.50
Notes: PP to midday
[U Fibonacci Retracements and Extensions /u]
-- PP --- * Price-* Dif
50% 1110.00 1110.75 -0.75
LOW 1104.25 1105.25 -1.00
-62% 1097.25 1097.50 -0.25
Notes: 50% to low
Hope it helps!
04-Dec-09
Key Price Levels
1098.75 07:24
1114.00 07:40
1119.00 08:49
1095.50 10:47
1105.75 12:05
1097.50 13:26
Daily Classic Pivot Points (ETH basis)
- PP --- * Price-* Dif
PP 1104.25 1105.75 -1.50
Notes: PP to mid-day high.
Source of PP for ETH basis
http://www.mypivots.com/dn/?symbol=224
Daily Classic Pivot Points (RTH basis)
- PP --- * Price-* Dif
R2 1122.00 1119.00 3.00
Notes: R2 rough match to high
[U Fibonacci Retracements and Extensions /u]
-- PP --- * Price-* Dif
HIGH 1117.00 1119.00 -2.00
38% 1105.00 1105.75 -0.75
LOW 1097.50 1097.50 0.00
Notes: High match to day's high.
Hope it helps!
I wonder if there is information in the matching of the different PP and the Fib retracements and extensions that might tell which levels are going to be the best fit for the next trading day?
Ok so I've sort them and there is a big hole between 1119 and 1110.
The low match is in the 1093-5 area.
I have low stop-run 1091
BTW "Open estimate" is my name for one of my high -low estimation formulae. In using Friday's close (1108.75) as a proxy for Monday's open for this formula. So the 1115 is the estimate of the day's high on Monday.
ES RTH
The low match is in the 1093-5 area.
I have low stop-run 1091
BTW "Open estimate" is my name for one of my high -low estimation formulae. In using Friday's close (1108.75) as a proxy for Monday's open for this formula. So the 1115 is the estimate of the day's high on Monday.
ES RTH
Click image for original size

07-Dec-09
Key Price Levels
1098.75 03:02
1106.50 04:39
1105.50 11:22
1110.25 12:23
1100.00 13:46
1104.75 14:45
Daily Classic Pivot Points (ETH basis)
- PP --- * Price-* Dif
PP 1107.50 1105.50 2.00
Notes: PP to miday low
Weekly Classic Pivot Points
Notes: nothing
Source of PP for ETH basis
http://www.mypivots.com/dn/?symbol=224
Daily Classic Pivot Points (RTH basis)
- PP --- * Price-* Dif
PP 1107.75 1106.50 1.25
Notes: PP to preopen
[U Fibonacci Retracements and Extensions /u]
-- PP --- * Price-* Dif
62% 1110.00 1110.25 -0.25
50% 1107.25 1106.50
Notes: 62% to high
Hope it helps!
I can't find where I sorted them so this looks different
I've bolded the PP numbers that might be a match.
So 1089 to 1092.50 if the range is about 15.25
Perhaps 1104.75 for the high end.
I've bolded the PP numbers that might be a match.
So 1089 to 1092.50 if the range is about 15.25
Perhaps 1104.75 for the high end.
Click image for original size
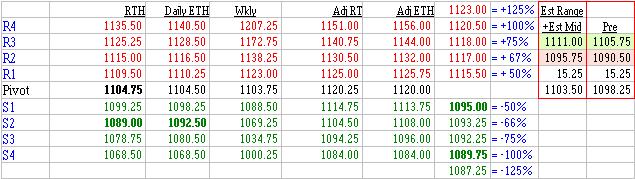
The actual low of 1087.75 was fairly close to bolded 1089 S2 and 1089.25 of -100%. Even better was 1087.25 of -125%
08-Dec-09
Key Price Levels
1098.75 03:02
1106.50 04:39
1105.50 11:22
1110.25 12:23
1100.00 13:46
1104.75 14:45
Daily Classic Pivot Points (ETH basis)
- PP --- * Price-* Dif
R1 1110.00 1110.25 -0.25
PP 1104.50 1104.75 -0.25
S1 1098.00 1100.00 -2.00
Notes: PP to midday low
Weekly Classic Pivot Points
- PP --- * Price-* Dif
PP 1103.75 1104.75 -1.00
Notes: PP to afternoon high
Source of PP for ETH basis
http://www.mypivots.com/dn/?symbol=224
Daily Classic Pivot Points (RTH basis)
- PP --- * Price-* Dif
PP 1107.75 1106.50 1.25
Notes: PP to preopen
[U Fibonacci Retracements and Extensions /u]
-- PP --- * Price-* Dif
HIGH 1110.75 1110.25 0.50
62% 1106.25 1106.50 -0.25
LOW 1098.75 1100.00 -1.25
Notes: High to high and LOW to low
Hope it helps!
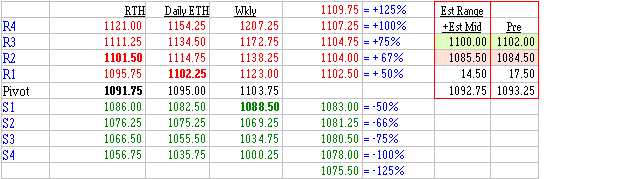
For Wednesday 9 Dec 2009
We have a 1100 to 1102 high area
and 1091 or 1088.50 low area.
We have a 1100 to 1102 high area
and 1091 or 1088.50 low area.
Click image for original size
Do pivots work?
I've seen price stall or reverse at yesterday's pivots as often as the current ones. And when price stalls or reverses at pivots, it is usually at a support or resistance level already established.
I've also seen price stall or reverse at mid pivots, and even at mid mid pivots when the pivots are wide apart.
There are so many pivot variations on so many session times that if you applied all of them, there'd be a line at nearly every tick.
So here's my take: Pivots are merely clever mathematical solutions to finding the existing support and resistance.
Do I use pivots? Yes, I do. I like clever mathematical solutions.
Study wasn't usin' them right. Nuff' said.
Emini Day Trading /
Daily Notes /
Forecast /
Economic Events /
Search /
Terms and Conditions /
Disclaimer /
Books /
Online Books /
Site Map /
Contact /
Privacy Policy /
Links /
About /
Day Trading Forum /
Investment Calculators /
Pivot Point Calculator /
Market Profile Generator /
Fibonacci Calculator /
Mailing List /
Advertise Here /
Articles /
Financial Terms /
Brokers /
Software /
Holidays /
Stock Split Calendar /
Mortgage Calculator /
Donate
Copyright © 2004-2023, MyPivots. All rights reserved.
Copyright © 2004-2023, MyPivots. All rights reserved.