Center of Gravity bands
This is a 30min chart of the S&P 500. The thicker bands are longer term and the smaller bands are shorter term bands. Hurst made these bands popular and he had a 400 hour home course on how to do them by hand. I used to do them by hand on the 30min and they worked great as you can see. The only problem was that it took a great amount of time to figure the bands by hand and only daily and weekly work because I need to concentrate on the markets and not charts.
When the bands are trending up use the set of green parallel lines on the RSI as overbought/oversold lines. When the Market is trending down use the red as overbought/oversold.
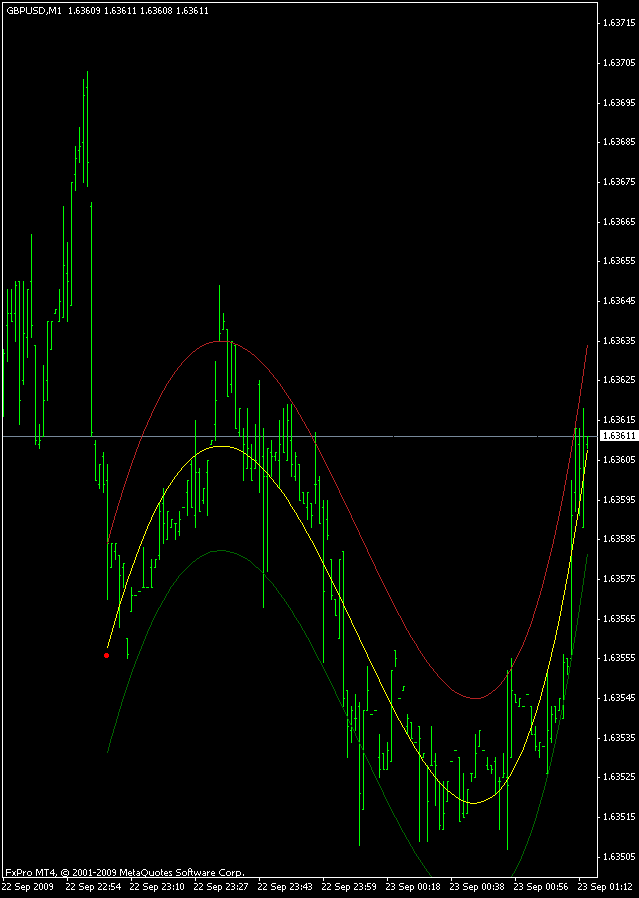
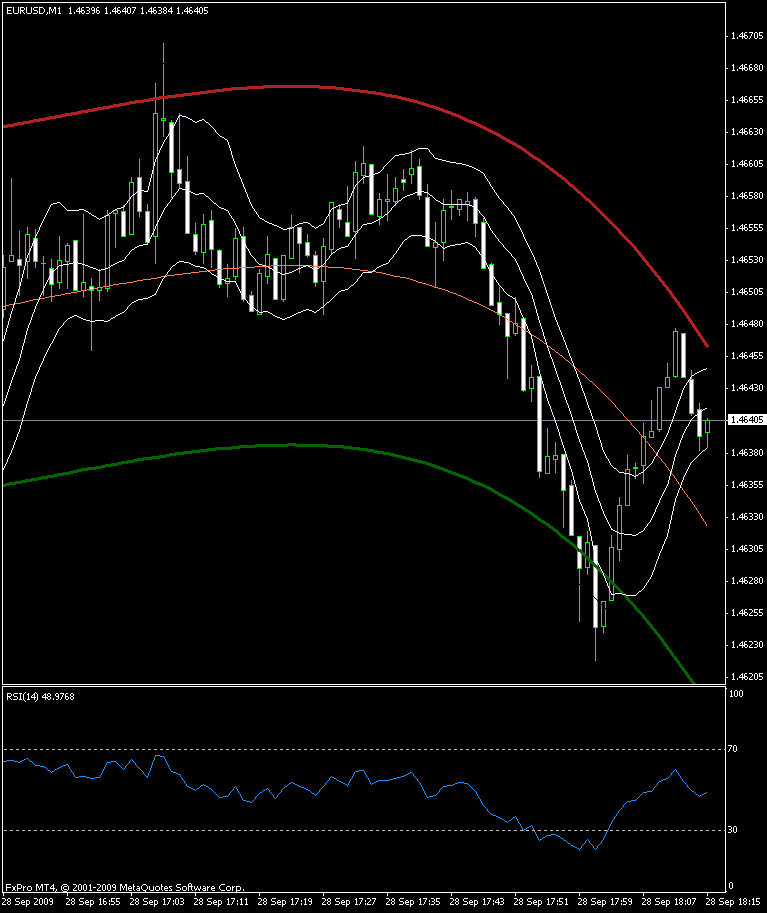
These bands are awesome in the Forex markets All you do is line up fast and slow on the 1 min, 5, 15 or any combo of 3 TF's.
GBP/USD 1 min
EUR/USD 1 min
The only problem this is coded in only metatrader at the moment who is a FX broker. And I don't think I'll ever go back to scalping the ES, NQ I have been bitten bad by the COGFX bug.
quote:
Originally posted by unicorn
quote:
Originally posted by CharterJoe
Sorry I don't have keltner channels on either forex platform.
easy to find;
there you go
//+------------------------------------------------------------------+
//| Keltner Channels.mq4 |
//| Coded by Gilani |
//| Copyright © 2005, MetaQuotes Software Corp. |
//| http://www.metaquotes.net |
//+------------------------------------------------------------------+
#property copyright "Copyright © 2005, MetaQuotes Software Corp."
#property link "http://www.metaquotes.net"
//+------------------------------------------------------------------+
//| Custom indicator initialization function |
//+------------------------------------------------------------------+
#property indicator_chart_window
#property indicator_buffers 3
#property indicator_color1 White
#property indicator_color2 White
#property indicator_color3 White
double upper[], middle[], lower[];
extern int period = 10;
int init()
{
SetIndexStyle(0,DRAW_LINE);
SetIndexShift(0,0);
SetIndexDrawBegin(0,0);
SetIndexBuffer(0,upper);
SetIndexStyle(1,DRAW_LINE);
SetIndexShift(1,0);
SetIndexDrawBegin(1,0);
SetIndexBuffer(1,middle);
SetIndexStyle(2,DRAW_LINE);
SetIndexShift(2,0);
SetIndexDrawBegin(2,0);
SetIndexBuffer(2,lower);
return(0);
}
int deinit(){return(0);}
int start() {
int limit;
int counted_bars=IndicatorCounted();
if(counted_bars<0) return(-1);
if(counted_bars>0) counted_bars--;
limit=Bars-counted_bars;
double avg;
for(int x=0; x<limit; x++) {
middle[x] = iMA(NULL, 0, period, 0, MODE_SMA, PRICE_CLOSE, x);
avg = findAvg(period, x);
upper[x] = middle[x] + avg;
lower[x] = middle[x] - avg;
}
return(0);
}
//+------------------------------------------------------------------+
double findAvg(int period, int shift) {
double sum=0;
for (int x=shift;x<(shift+period);x++) {
sum += High[x]-Low[x];
}
sum = sum/period;
return (sum);
}
cheers...
Here is a one min chart with keltner and COG. I'll post some more later.
The problem I am seeing this morning with ketner is that it does not keep up with fast moves as the COG, which is why it shifts from bar to bar....I think that anyone interested should watch this for a week, paper trade it what ever I think its a good tool.
anybody still using COG?
Emini Day Trading /
Daily Notes /
Forecast /
Economic Events /
Search /
Terms and Conditions /
Disclaimer /
Books /
Online Books /
Site Map /
Contact /
Privacy Policy /
Links /
About /
Day Trading Forum /
Investment Calculators /
Pivot Point Calculator /
Market Profile Generator /
Fibonacci Calculator /
Mailing List /
Advertise Here /
Articles /
Financial Terms /
Brokers /
Software /
Holidays /
Stock Split Calendar /
Mortgage Calculator /
Donate
Copyright © 2004-2023, MyPivots. All rights reserved.
Copyright © 2004-2023, MyPivots. All rights reserved.


