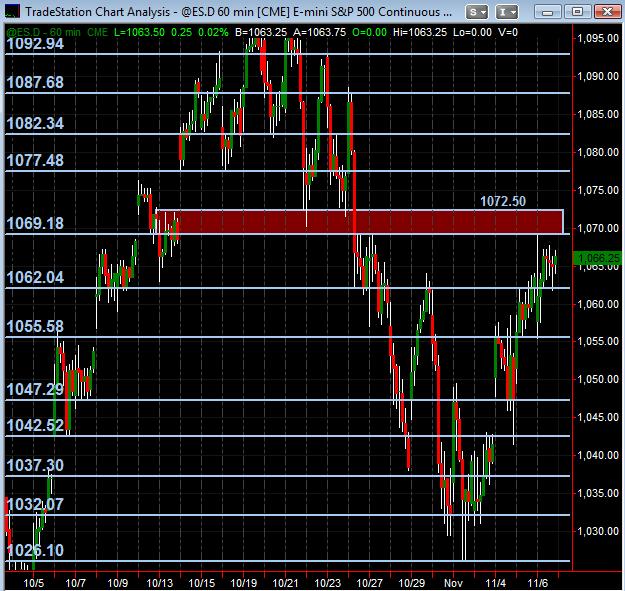
ES S/R Map for 11-9-09
Here's what I've got for price action S/R levels coming into Monday. Viewed multiple time-frame charts but have this drawn on the 60 minute. As always, each price is a "zone" with a few ticks above and below as the "area." Have an actual "zone" drawn in that is WIDE from the 1069-1072 area where both individual prices are pretty solid but feel this will function as a zone. Obviously I prefer something no more than a couple ticks or so to each side of the line/price I've drawn in. But in this case (and based on others analysis) I think it appropriate to present it that way on the chart fwiw.
As always, encourage all to post any feedback and analysis!
Click image for original size
As always, encourage all to post any feedback and analysis!
so far today no 30 minute bar has traded below the low of any other bar..haven't seen that in a while
Emini Day Trading /
Daily Notes /
Forecast /
Economic Events /
Search /
Terms and Conditions /
Disclaimer /
Books /
Online Books /
Site Map /
Contact /
Privacy Policy /
Links /
About /
Day Trading Forum /
Investment Calculators /
Pivot Point Calculator /
Market Profile Generator /
Fibonacci Calculator /
Mailing List /
Advertise Here /
Articles /
Financial Terms /
Brokers /
Software /
Holidays /
Stock Split Calendar /
Mortgage Calculator /
Donate
Copyright © 2004-2023, MyPivots. All rights reserved.
Copyright © 2004-2023, MyPivots. All rights reserved.