ES S/R Map for 11-11-2009
Click image for original size
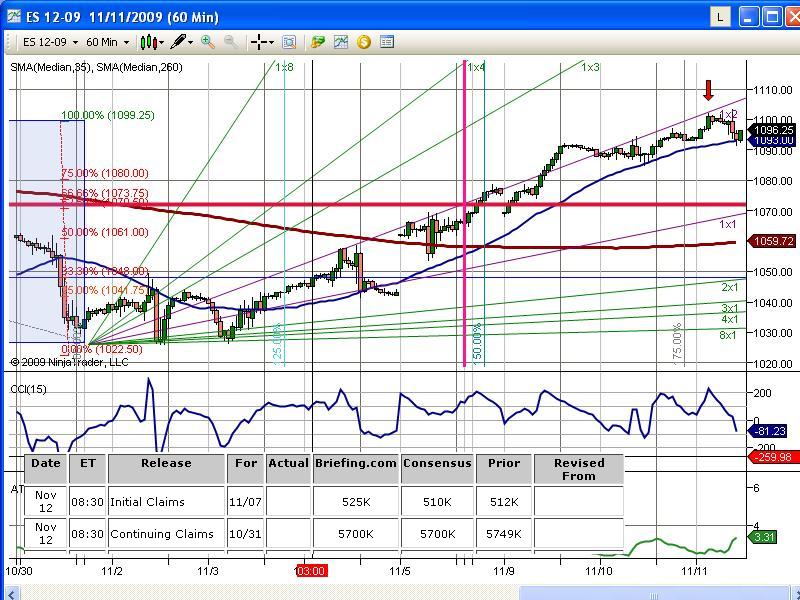
R: 1101, 1106, 1123, 1132
S: 1089, 1081, 1073
So far this week what I see is an uptrend day on Monday, then narrow range consolidation day (building Value Area) Tuesday. Today we should see the market break free of the value area. Expectation for today is range expansion, and I will be watching for either a trend day (gap out of value and trend) or a quick stop run above value devolving into an engulfing red candle (price rejection). Market internals ($TRIN, $ADD, Volume analysis) should give us a clue as to the strength or weakness (acceptance / rejection) as price moves out of value.
quote:
Originally posted by blue
Click image for original size
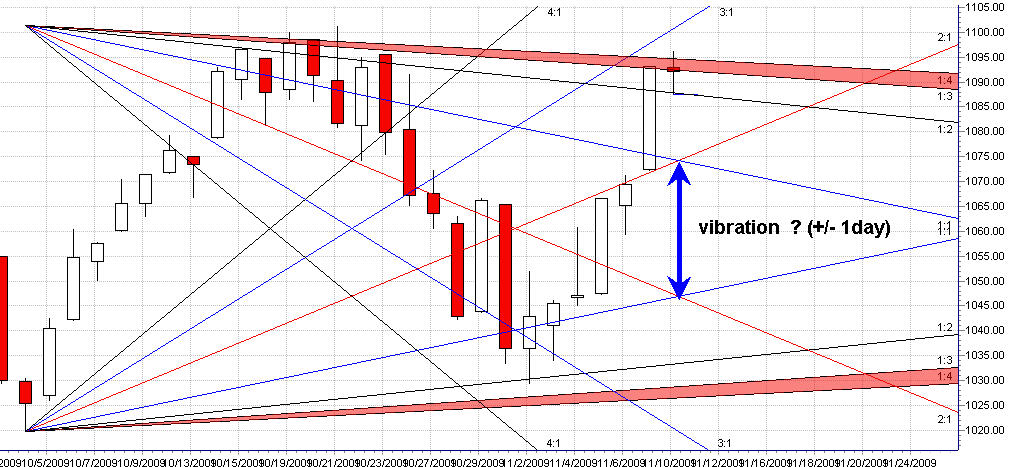
what are you using for points per bar on the gann
thx
The problem with using gann speed lines on some platforms ninja, esignal ect is they are useless as the chart changes scale constantly as the underlined moves. This would look vastly different If you were to look at a hand plotted chart with consistent spacing. Only platform I've found were the user can set the spacing is wave59....
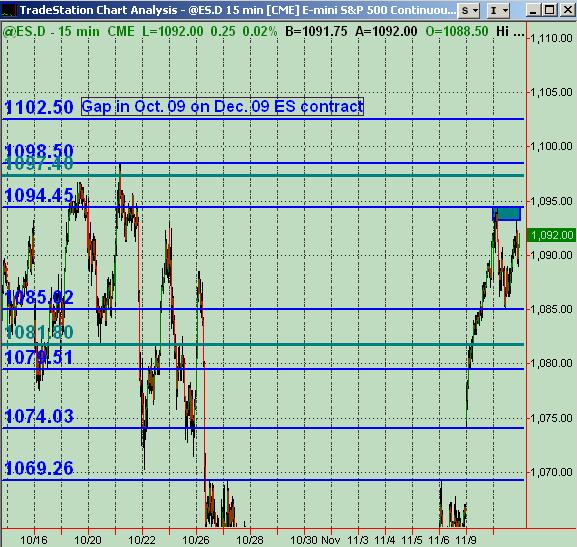
Here's what I've got for price action S/R levels which are the blue lines ... greenish lines are Wkly R1 and R2. Of special note is the 1102.50 which would be the closing of a daily chart gap from Oct 08 using the front month contract at the time of Dec 08 (continuous contract would have price at a different level). Looks like price got within a tick or 2 of there last night, wish I'd not waited till this morning to post what I had. Wasn't awake to consider a short there either.
Click image for original size
this gann may or may not help for the spx daily - reaching gann max resist now
Click image for original size
We're starting out the session with Dow, SP and Naz (among some other major indices) at 52-week highs again.
Chopped myself up a bit during the first 30 minutes trying to position myself for a move. Market finally retested the overnight highs and the gap close in the 1102.50 area topping out at 1103.25 and falling off pretty quickly ... currently trading at 97.00. My sense is that if RTH lows are taken out after that push up and rejection this morning, there may be some decent room further down FWIW ... espec. considering how overbot mkt is on the very short term (even tho is still a bull mkt ... and strong since March).
note to self: when ES retested 1102.50 area reaching 03.25, NQ was concurrently testing Wkly R2 Pvt of 1793 ... with slight $TICK divergence on ES before breaking down ... subsequently traded down to 92.00 area to fill in gap from yday's close
quote:
Originally posted by gio5959
what are you using for points per bar on the gann
thx
Hi Gio,
An excellent question! I am very encouraged someone asked it!
I have struggled with that very important question for quite some time.
I do not yet have an answer for you. This shows how I have wasted my time fooling around with fine-tuning and forgetting to spend my time on big picture analysis first.
I have made the on Saturday past, decision to step back and make sure I have a picture of the forest before looking at the twigs.
In any case, I do not have the answer for you other than to say that I have concluded:
1. you must do your chart by hand,
2. you must use intuitive guidance and trial and error to determine the ratio.
So at this point you're on your own my friend - PM me if you get an answer!
Your question highlights the weakness of what I have posted. It is a mechanical out-of-the-box, fool-around new to ninja, chart.
In the same vein, to be taken with a grain of salt, I attach another...
Click image for original size
Now that is weird.
I posted a new chart (same name) and it replaced the chart in the first post.
I guess I better change names next time!
I posted a new chart (same name) and it replaced the chart in the first post.
I guess I better change names next time!
here you go MM..they work better when they form within the days range and will obviously fail on trend days............if we open in range tomorrow I think we need to be real agressive to get the breakout form todays low or high....here is the triples link...
http://www.mypivots.com/forum/topic.asp?TOPIC_ID=2163&SearchTerms=running,the,triples
http://www.mypivots.com/forum/topic.asp?TOPIC_ID=2163&SearchTerms=running,the,triples
quote:
Originally posted by MonkeyMeat
Question Bruce ... when you reference triples as in the prior post "...triples sit at the days highs and lows so I am powerless..." I'm clueless as to what that's describing ... blame it on my own ignorosity ... but would be nice for someone to learn me on that.
Emini Day Trading /
Daily Notes /
Forecast /
Economic Events /
Search /
Terms and Conditions /
Disclaimer /
Books /
Online Books /
Site Map /
Contact /
Privacy Policy /
Links /
About /
Day Trading Forum /
Investment Calculators /
Pivot Point Calculator /
Market Profile Generator /
Fibonacci Calculator /
Mailing List /
Advertise Here /
Articles /
Financial Terms /
Brokers /
Software /
Holidays /
Stock Split Calendar /
Mortgage Calculator /
Donate
Copyright © 2004-2023, MyPivots. All rights reserved.
Copyright © 2004-2023, MyPivots. All rights reserved.