JA
jarek
Rep: 94
Posts: 3,474
WOW - what a busy Saturday in the forum! Haven't seen anything like this in quite a while ... Better times for the forum coming? :-)
JA
jarek
Rep: 94
Posts: 3,474
Originally posted by jimkane
...But this is a monster strong close, and this one meets my criteria for holding some into GLOBEX....
Couldn't it be a climax move into the area suggesting possible reversal here?
JI
jimkane
Rep: 3,058
Posts: 33,089
ADBE earnings are out, and it's up big. Wow, what a surprise. We are in big-time melt-up phase.
This thing may see that 1,400 within the short time factor the area implies in my chart of the month (some time in April). I'm not calling for it, only saying, wow, would that be something. And yes, I am being sarcastic here, in that if it did happen, up another 225 points in 3-5 weeks, it would be about the most assinine thing I will have ever seen. But, if Greece does go into default, and that triggers an EU banking crisis, and the Fed then increases their balance sheet some additional tens of trillions, and then another half-dozen other things get triggered, well, then for sure the market will be up at least that much...
This thing may see that 1,400 within the short time factor the area implies in my chart of the month (some time in April). I'm not calling for it, only saying, wow, would that be something. And yes, I am being sarcastic here, in that if it did happen, up another 225 points in 3-5 weeks, it would be about the most assinine thing I will have ever seen. But, if Greece does go into default, and that triggers an EU banking crisis, and the Fed then increases their balance sheet some additional tens of trillions, and then another half-dozen other things get triggered, well, then for sure the market will be up at least that much...
JI
jimkane
Rep: 3,058
Posts: 33,089
Originally posted by jarekIt could, but two things play into this as far as I'm concerned. It may be a climax, but it has to prove that to me. I want to be giving back when I get out, or else it hasn't proven anything to me. I have a 'give back' style. Otherwise, I'm target trading, not trend following. So, I would want to follow into GLOBEX and see what it does. Remember, an explosive move into resistance that looks like a climax but isn't could be the start to a bigger explosion. Next, that 1,200 is like a self-fulfilling prophecy, with every blog and forum on the entire earth talking about just about nothing but that level. I don't think that means it won't get there, I think it means it will most likely smoke that level to trap all those that surely are going to short it there en masse, without even waiting for it to start to roll. Just a thought.
Originally posted by jimkane
...But this is a monster strong close, and this one meets my criteria for holding some into GLOBEX....
Couldn't it be a climax move into the area suggesting possible reversal here?
TO
TonyC
Rep: 99
Posts: 471
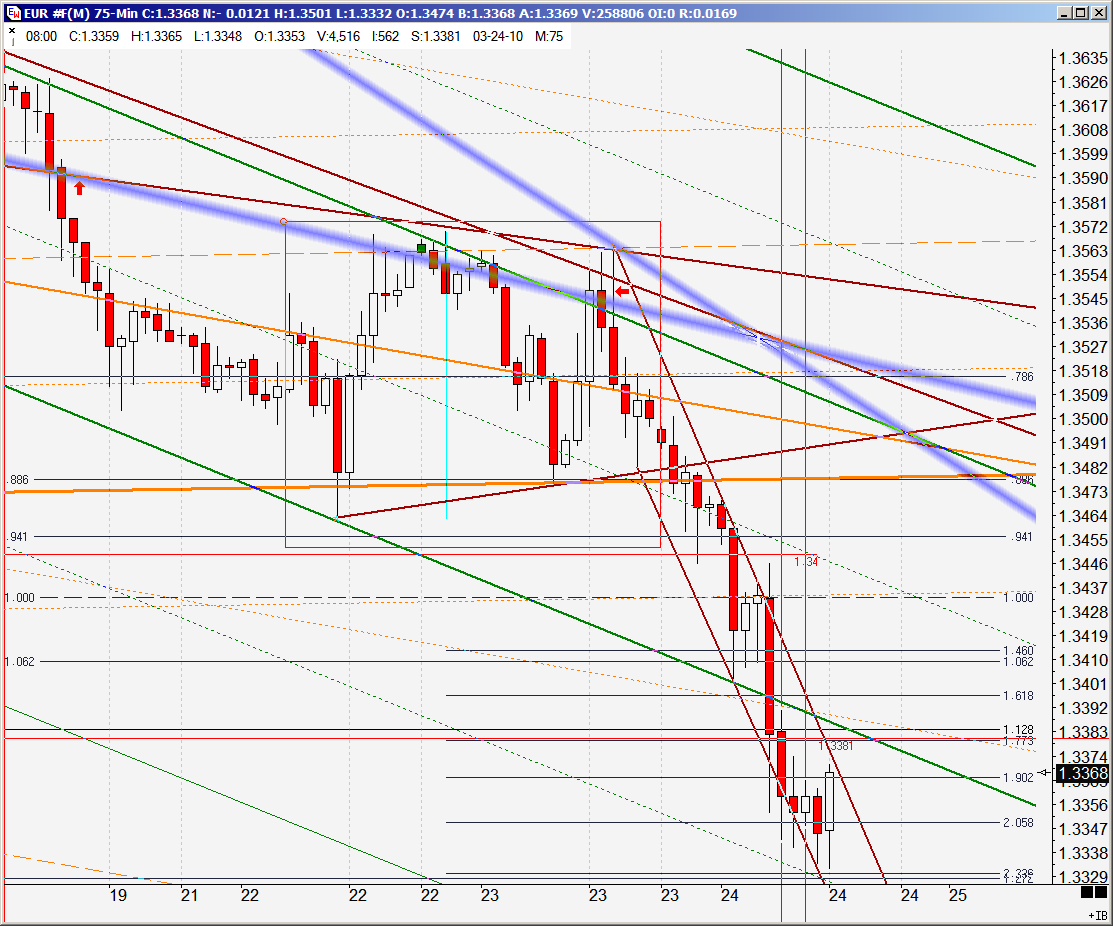
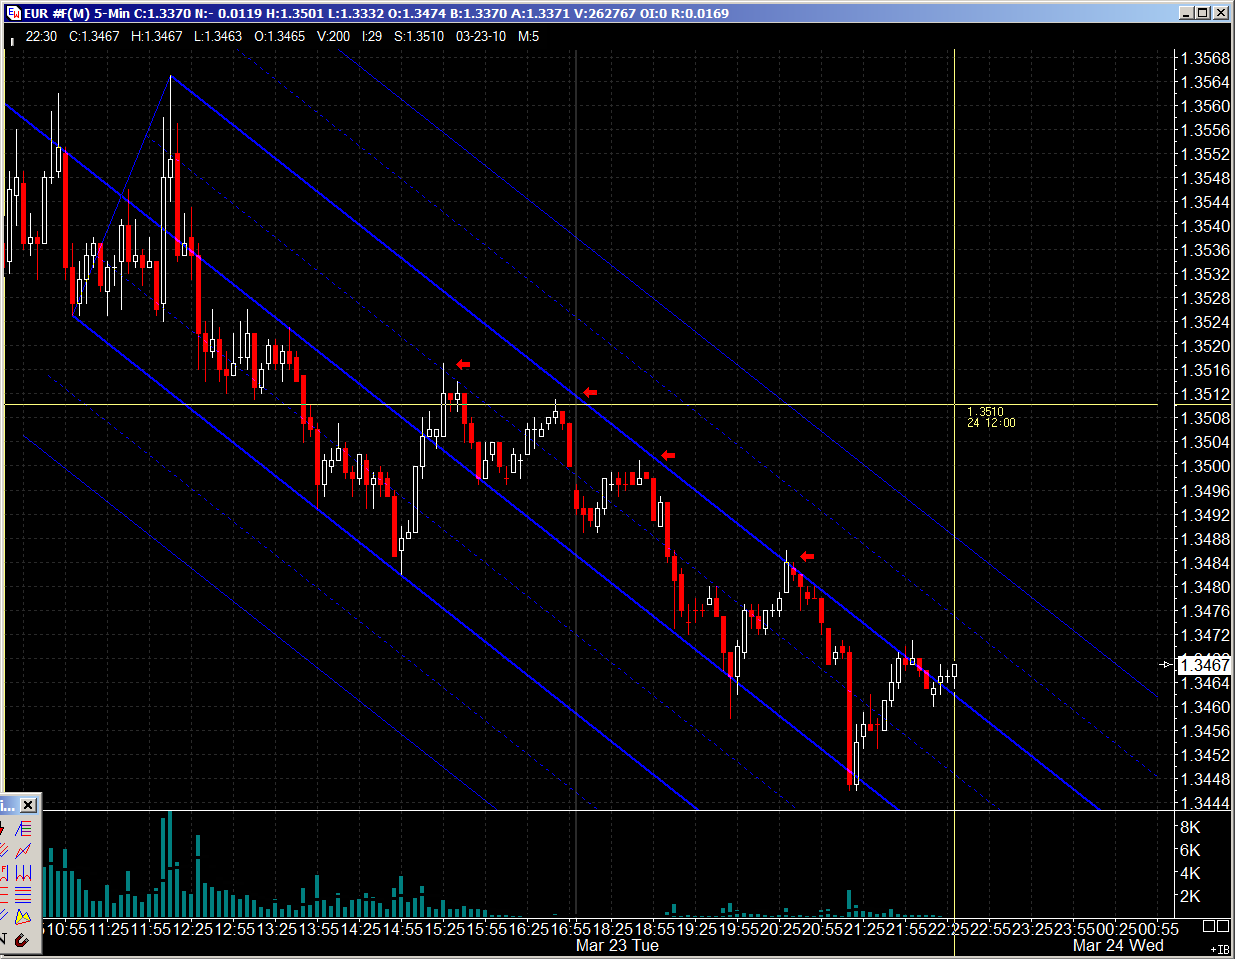
well on the Euro front, it went boinker last night breaking down out of the daily/weekly congestion...it went boinker and still going. I had a nice pattern setup on the 75min chart to launch the breakdown pop and it started yesterday afternoon. There were also a multitude of smaller time frame patterns and geometric setups within the move downward to profit from or re-entries etc... I'm exhausted and need to catchup on my sleep now so i won't post detailed chartwork.
Click image for original size
Click image for original size
JA
jarek
Rep: 94
Posts: 3,474
Originally posted by jarek
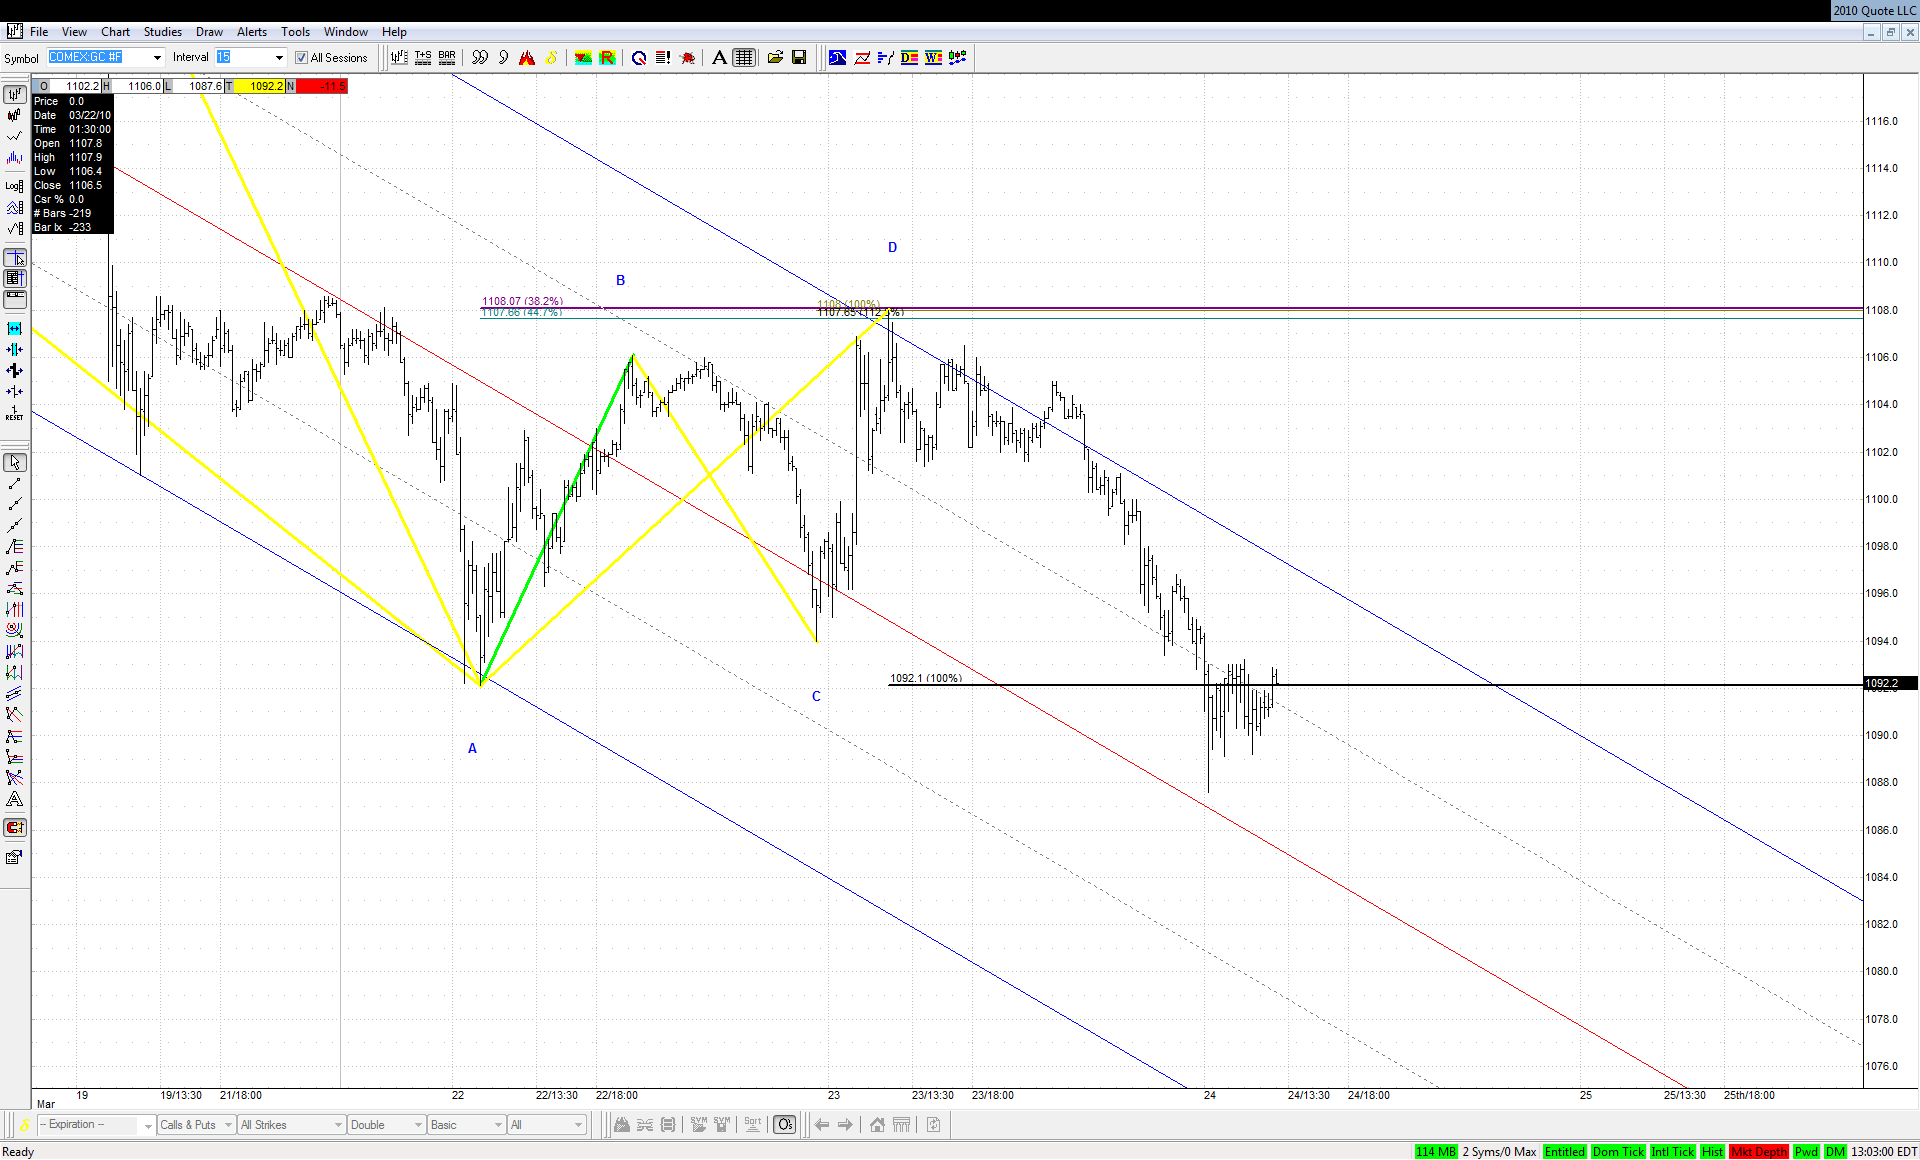
Nice 1.000 ABCD at .382 in Gold giving an 87% chance of breaking yesterday's bottom:
The low was taken out as expected:
Click image for original size
JA
jarek
Rep: 94
Posts: 3,474
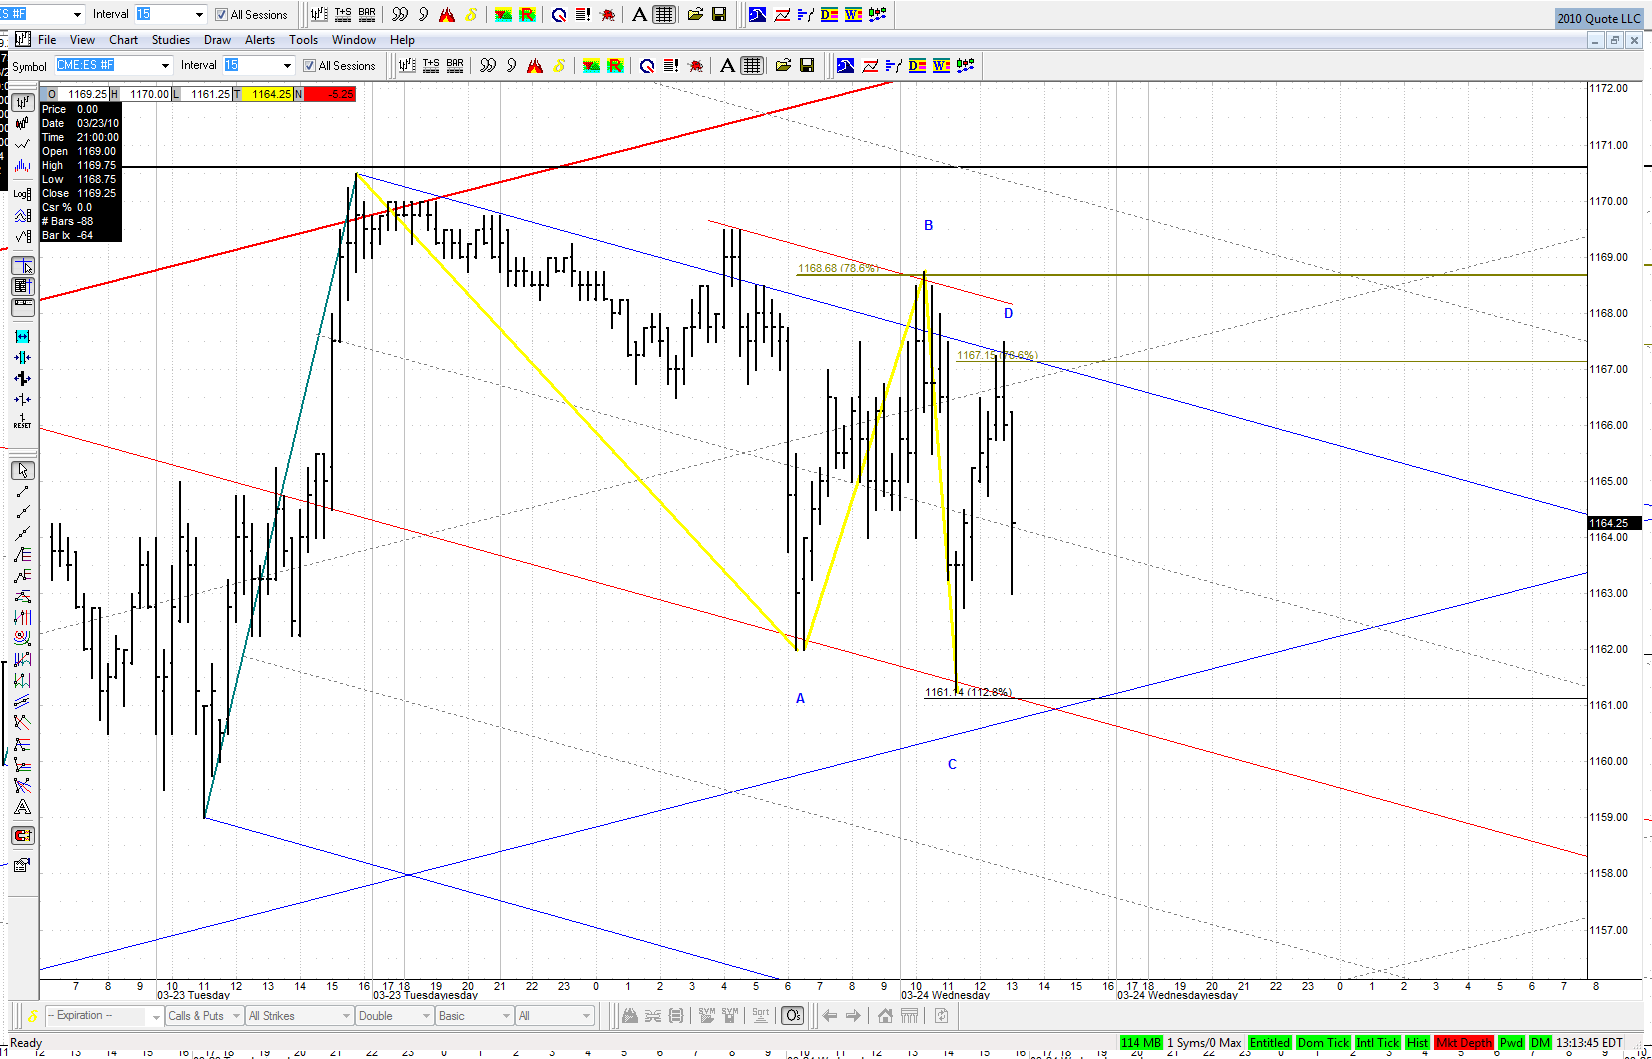
Today's action confirms at least short term reversal at Jim's area from yesterday which was hit TO THE TICK - chapeau bas!
We now have this nice TD ABCD suggesting more downside to come:
We now have this nice TD ABCD suggesting more downside to come:
Click image for original size
JI
jimkane
Rep: 3,058
Posts: 33,089
Great work, guys. KT methodology at its finest in those issues, huh?
Yeah, pretty cool it saw my reversal area to the tick in the ES. Like I said, I wanted it to prove it to me in GLOBEX, which it did as it slowly rolled over. Then it threw a nice ABCD just after 4 AM. It doesn't get any better than that if one is looking to get short.
Yeah, pretty cool it saw my reversal area to the tick in the ES. Like I said, I wanted it to prove it to me in GLOBEX, which it did as it slowly rolled over. Then it threw a nice ABCD just after 4 AM. It doesn't get any better than that if one is looking to get short.
JI
jimkane
Rep: 3,058
Posts: 33,089
Anyone see that spike line at the LOD? Use GLOBEX data on say a 15-minute.
JA
jarek
Rep: 94
Posts: 3,474
The low so far was not only on spike line but also right at X marks the spot:
We will have a nice clue if it fails to hold.
Click image for original size
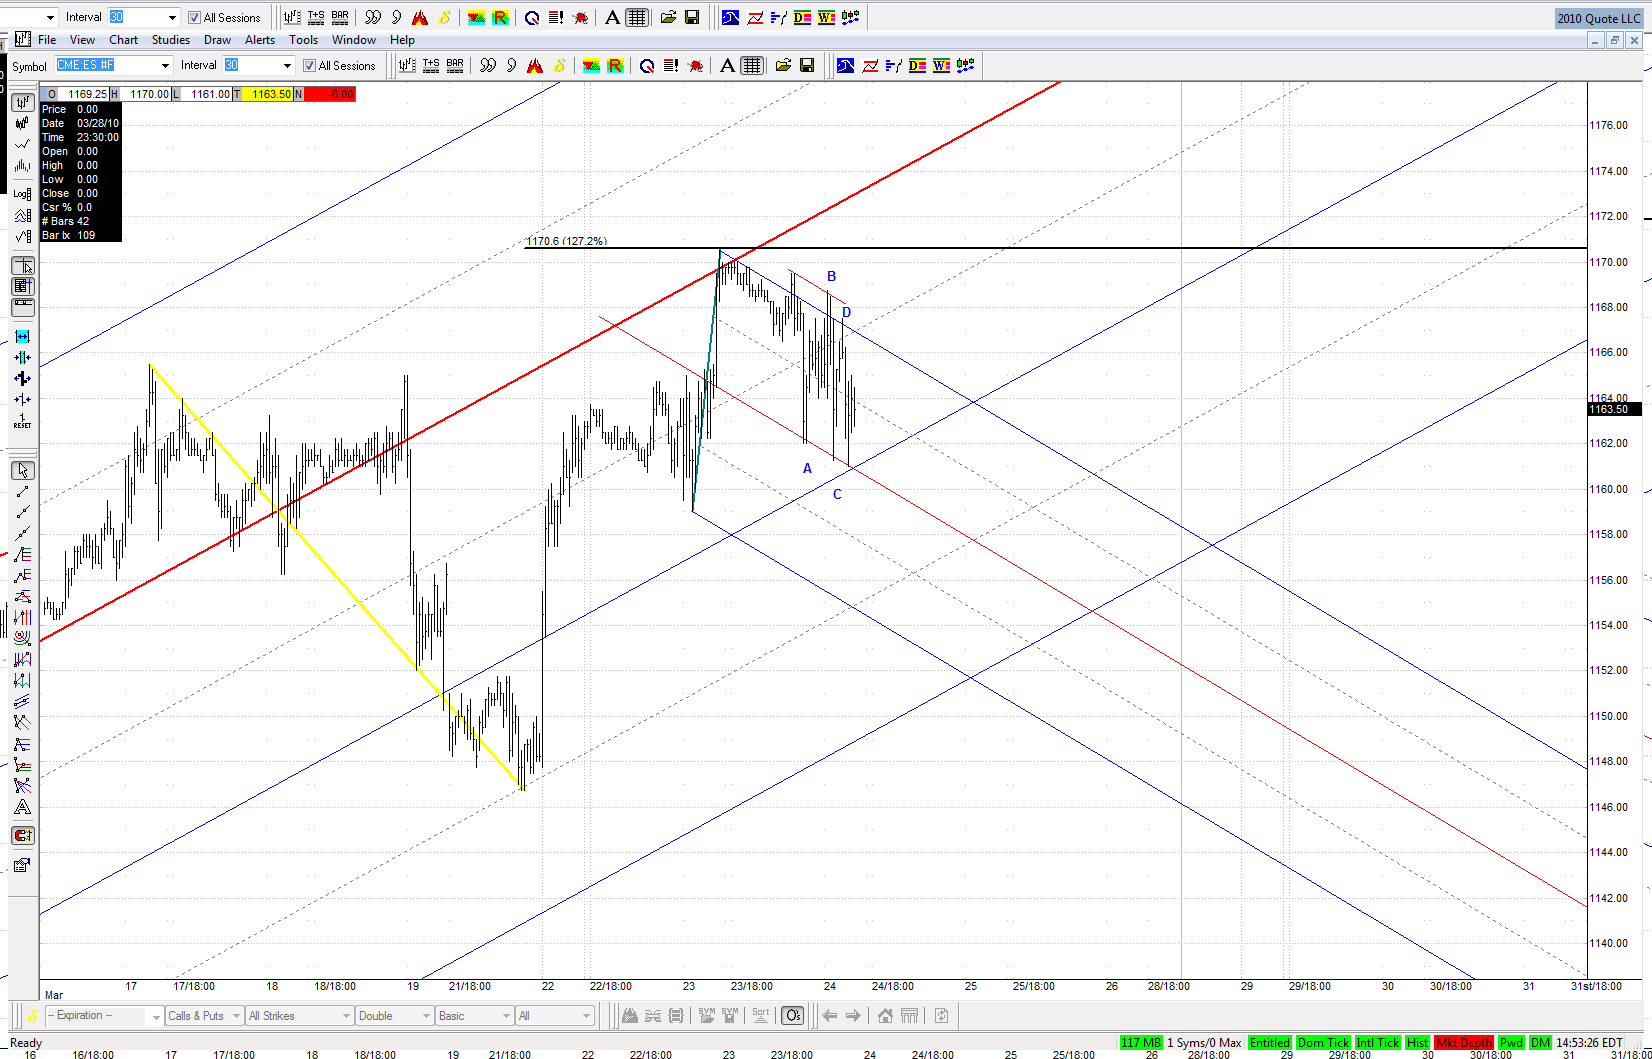
We will have a nice clue if it fails to hold.
TO
TonyC
Rep: 99
Posts: 471
Roofer, what u are alluding to with the multiple timeframes comments is that they are deliberately omitting the 'CONTEXT'?.They are just blind to the bigger picture within wich the current price action,indicators,geometry are set up?. That's a big time mistake to deny 'Context'. And Jim will tell you: quote:'without context you have nothing'...it is so true I believe.
As far as computers go with their millions of calc per nanosecond, they still can't beat a well trained human mind with anticipatory instincts,rock solid discipline and a real 'trading plan'. But these types don't come by often and the brain can only function at peak performance for just a finite period of time,unlike comps that can run forever.So I'd assume that's why only a small percentage of the trading population can consistently beat the comps at their own games. And I think those who run the comps are fine with this fact because in the long run they still take the money of the weaker minded masses anyway. So that cycle is perpetuating, making the market wheels go round and rewarding only those who work hard at their trading craft by whatever means and methods necessary.Indicators or not, whatever works is what matters.
Being consistently profitable is no easy task but feasible I think, or else I wouldn't be trading at all. How can one achieve that goal? it's like climbing Mont Everest, many try but only few make it and along the way up you just learn about your true self and deep down inside the only fight u have is with yourself not the mountain...
regards,
T