MyPivots
Sign In
JA
jarek
Rep: 94
Posts: 3,474
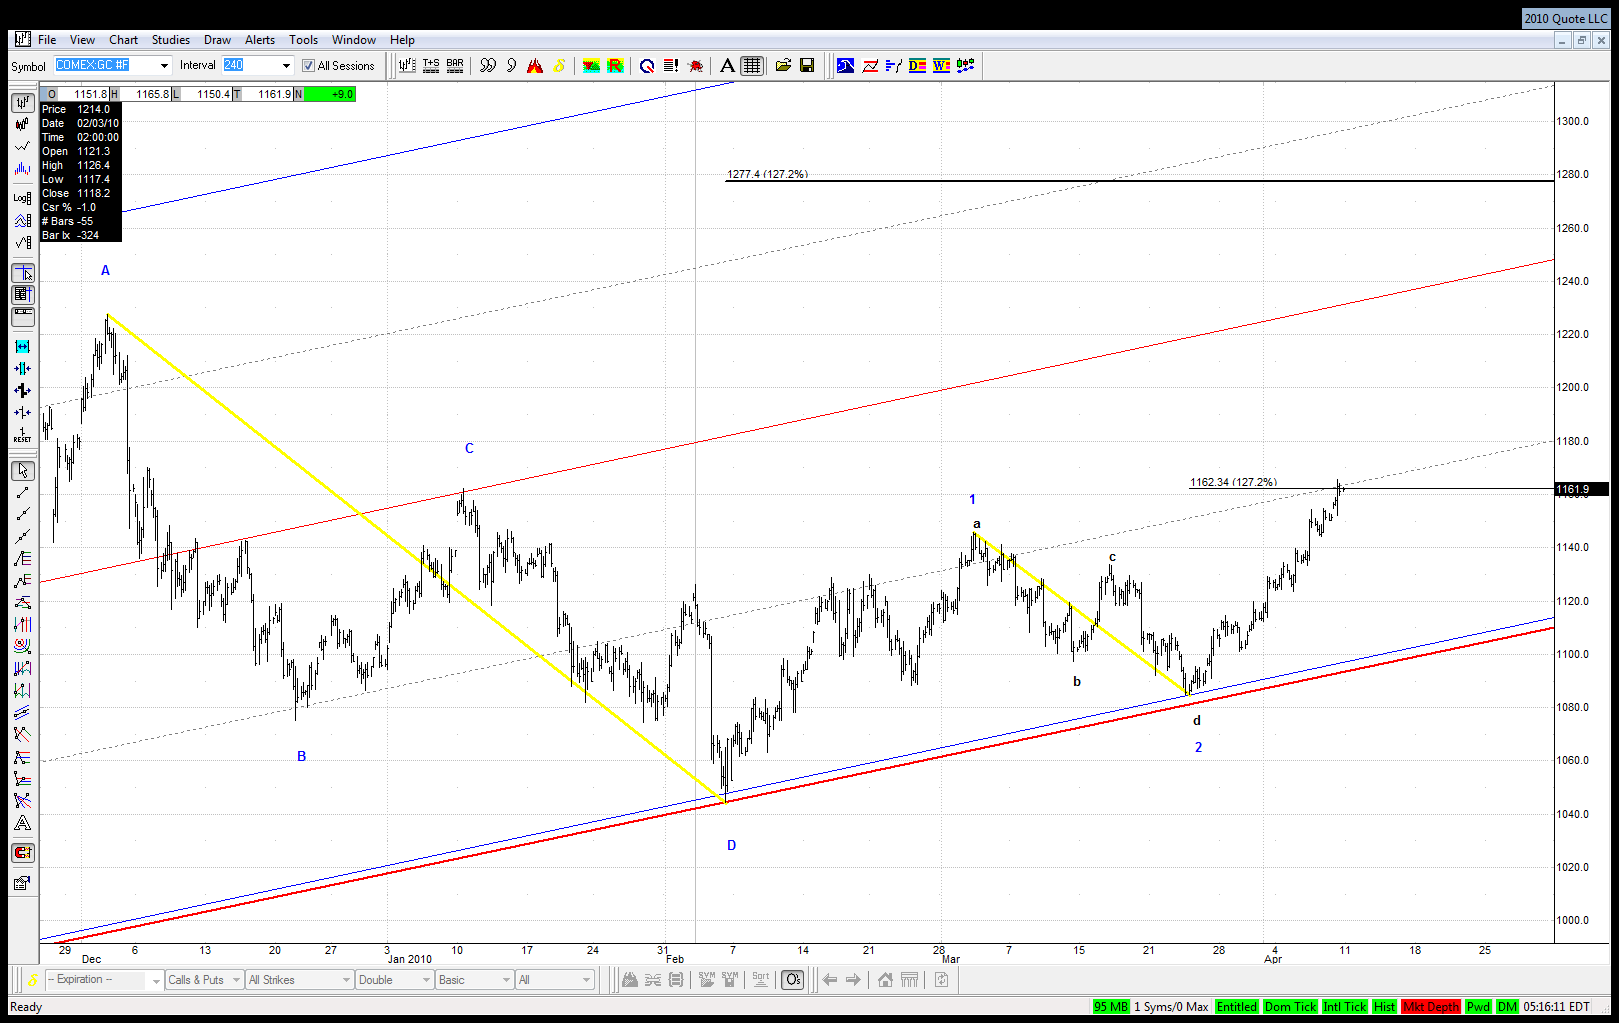
Here is the update of my recent charts for gold and rates:


Click image for original size

Click image for original size
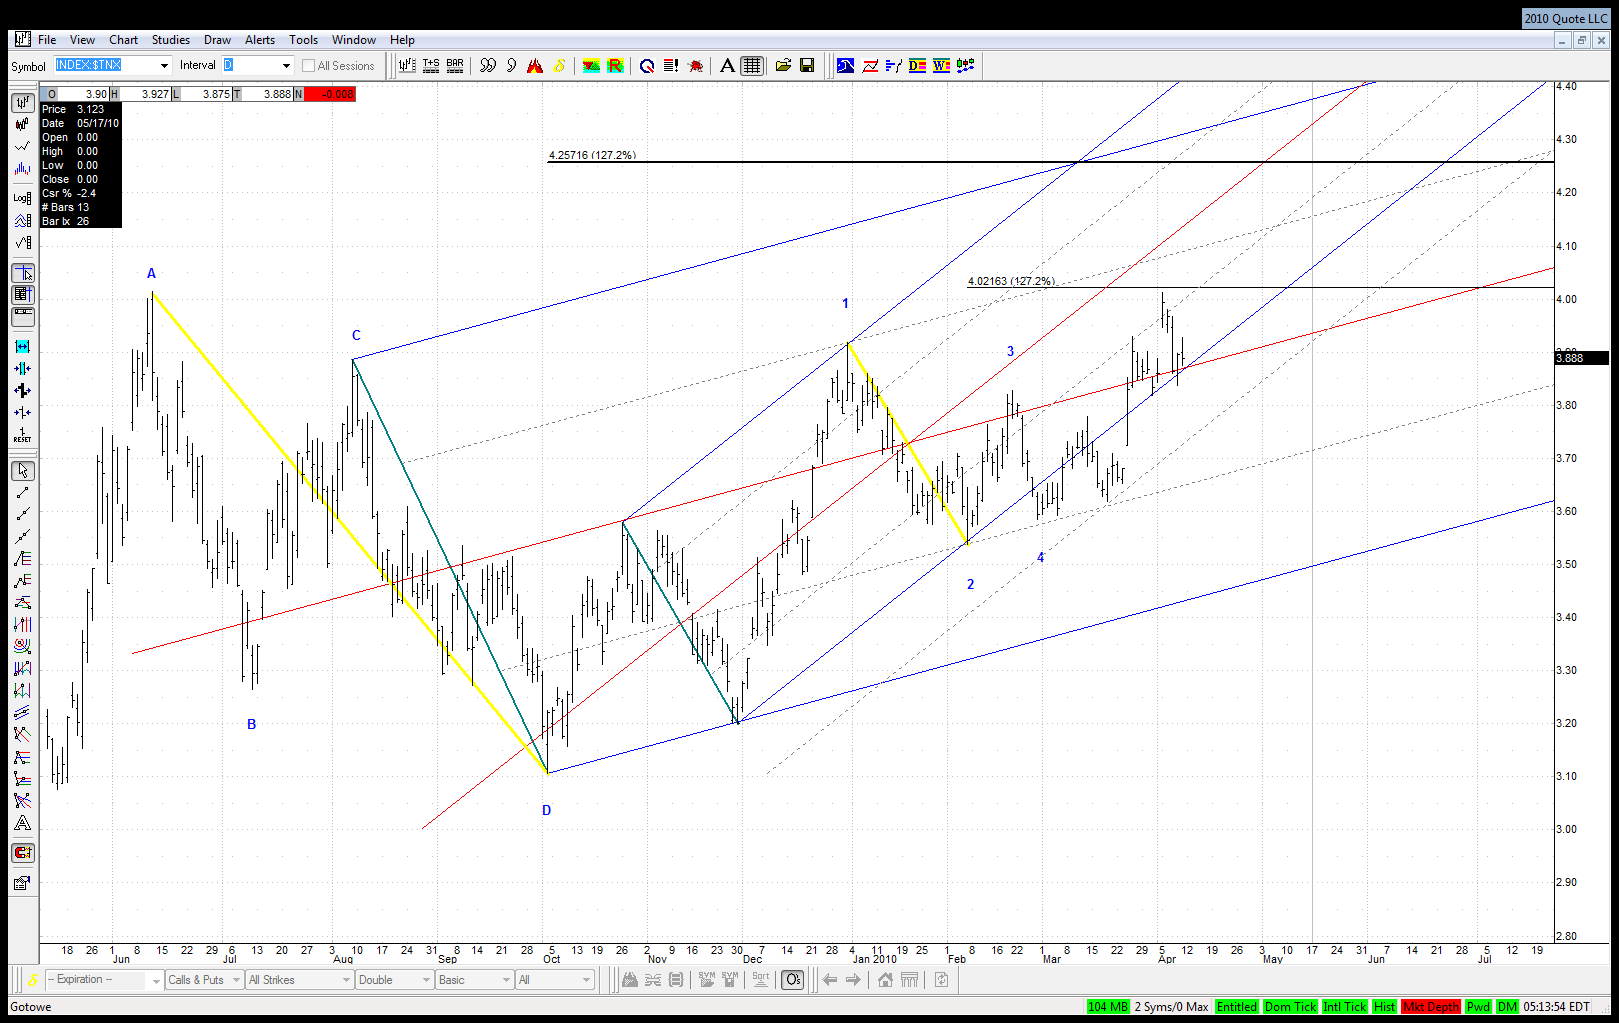

Interestingly they share pretty similar characteristics:
- both issues were recently rising strongly which may seem contradictory, but as Jim pointed out might suggest inflation expectations
- both reached 1.27 external retracement of their respective smaller Kane patterns
- in both cases 1.27 retracement of their bigger Kane patters is still much higher what suggests that gold and rates should continue to rise together for some time to come
RO
roofer
Rep: 3,689
Posts: 3,574
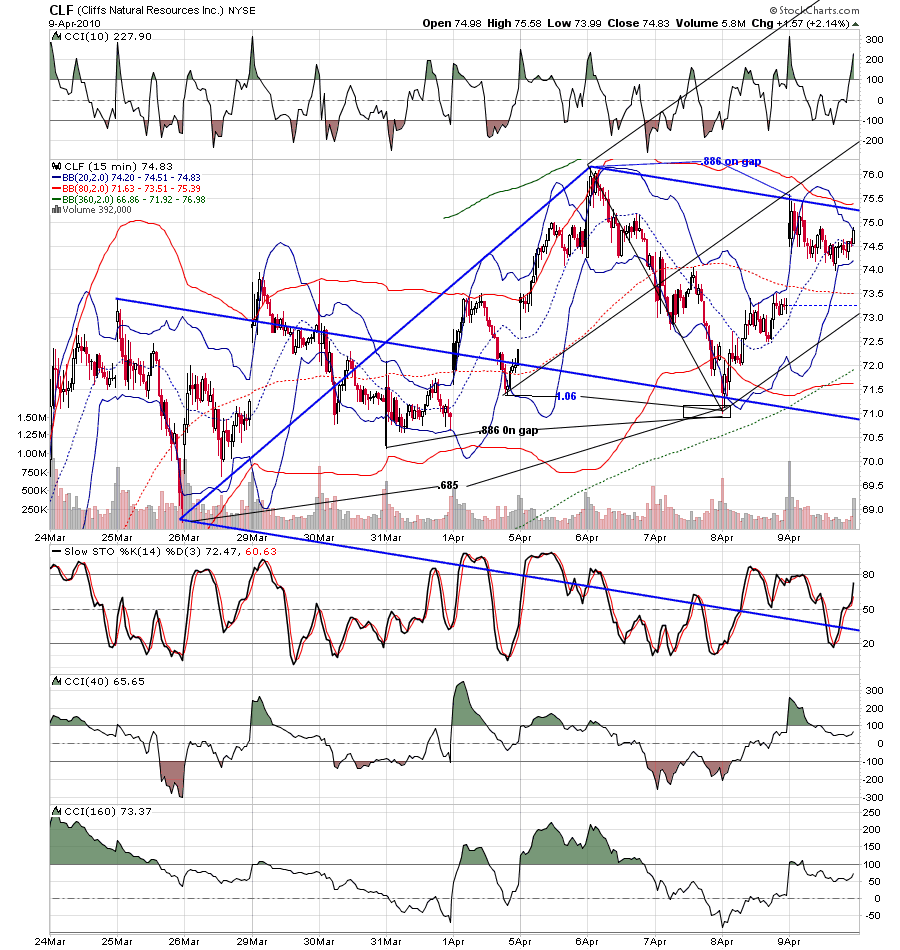
it is of interest that even in the far reaches of stock land, the game goes on.. chart of CLF....for what its worth... a forcast model i follow that was there with the geometry at july10th low, and the oct high and jan19th high and early feb low.... is present again tomorrow......i just do not see the geometry this time.... unless we first have a strong moveup.....
RO
roofer
Rep: 3,689
Posts: 3,574
Click image for original size
JI
jimkane
Rep: 3,058
Posts: 33,089
Nice charts, guys.

Well, another Sunday night and the futures are...drum roll...up! Wow, what a shocking surprise. A point and a half from 1200. I wonder what the chances are that they don't hit 1200 tonight? I'd say slim and none, but I think they are are a lot less than slim, so I'd say none and none? Just a hunch. Same market, different day. I wonder how many people are buying Friday closes now for an easy sell on Monday for a fat profit? Everyone? This is the longest I have ever seen anything persist in the market that everyone sees, knows about, and is on every blog and forum on earth. Very curious, eh?
RO
roofer
Rep: 3,689
Posts: 3,574
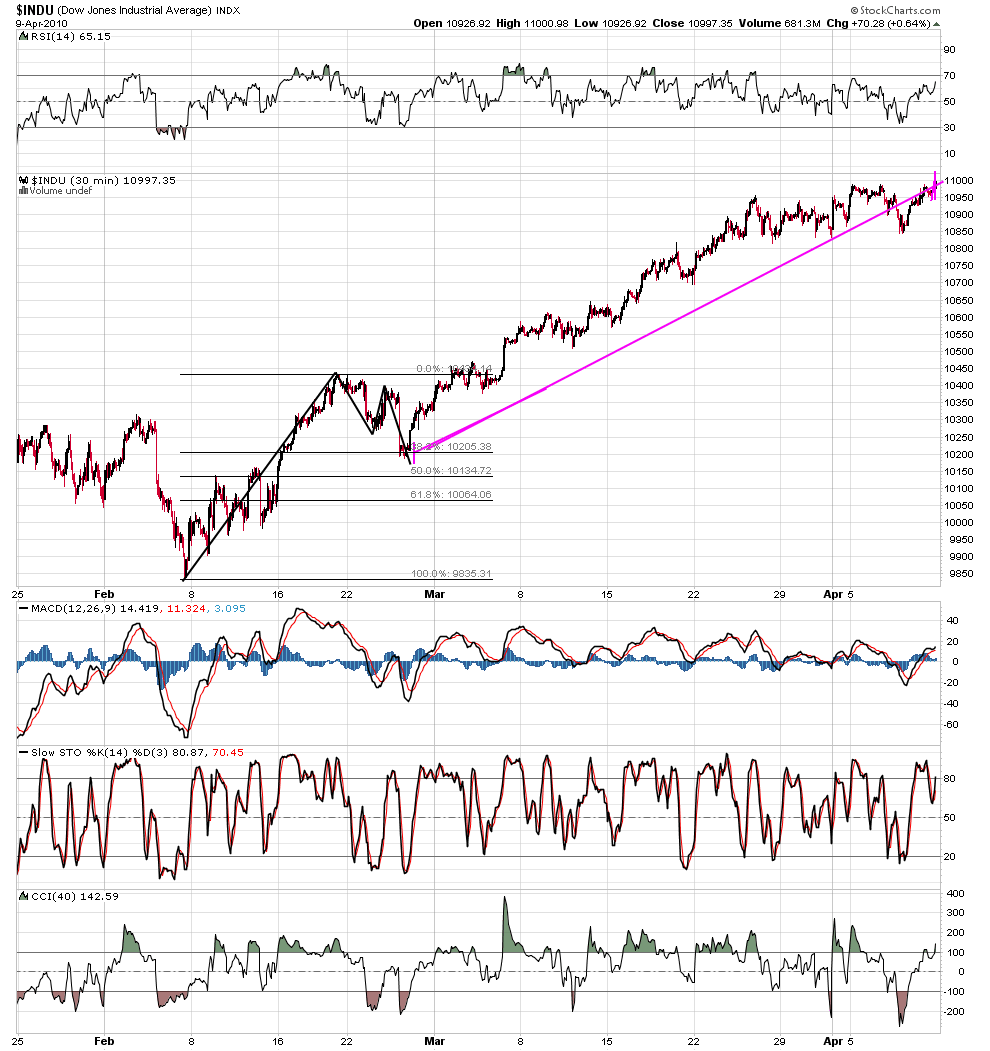
here is a picture relating forcast to geometry.... the forcast was for the time period feb26 to april 12th to be the most relentless rally period of year... note how the geometry agreed, the move being launched by the abcd at .382.....here it is april 12... i have no geometry yet.... many of my longest term index charts have upside targets right above market, approx 1219 spx....we can all have a good laugh if this falls flat....but i am on alert for my own trading...
Click image for original size
AL
albert
Rep: 99
Posts: 3,094
me too.

Al Kamego
JI
jimkane
Rep: 3,058
Posts: 33,089
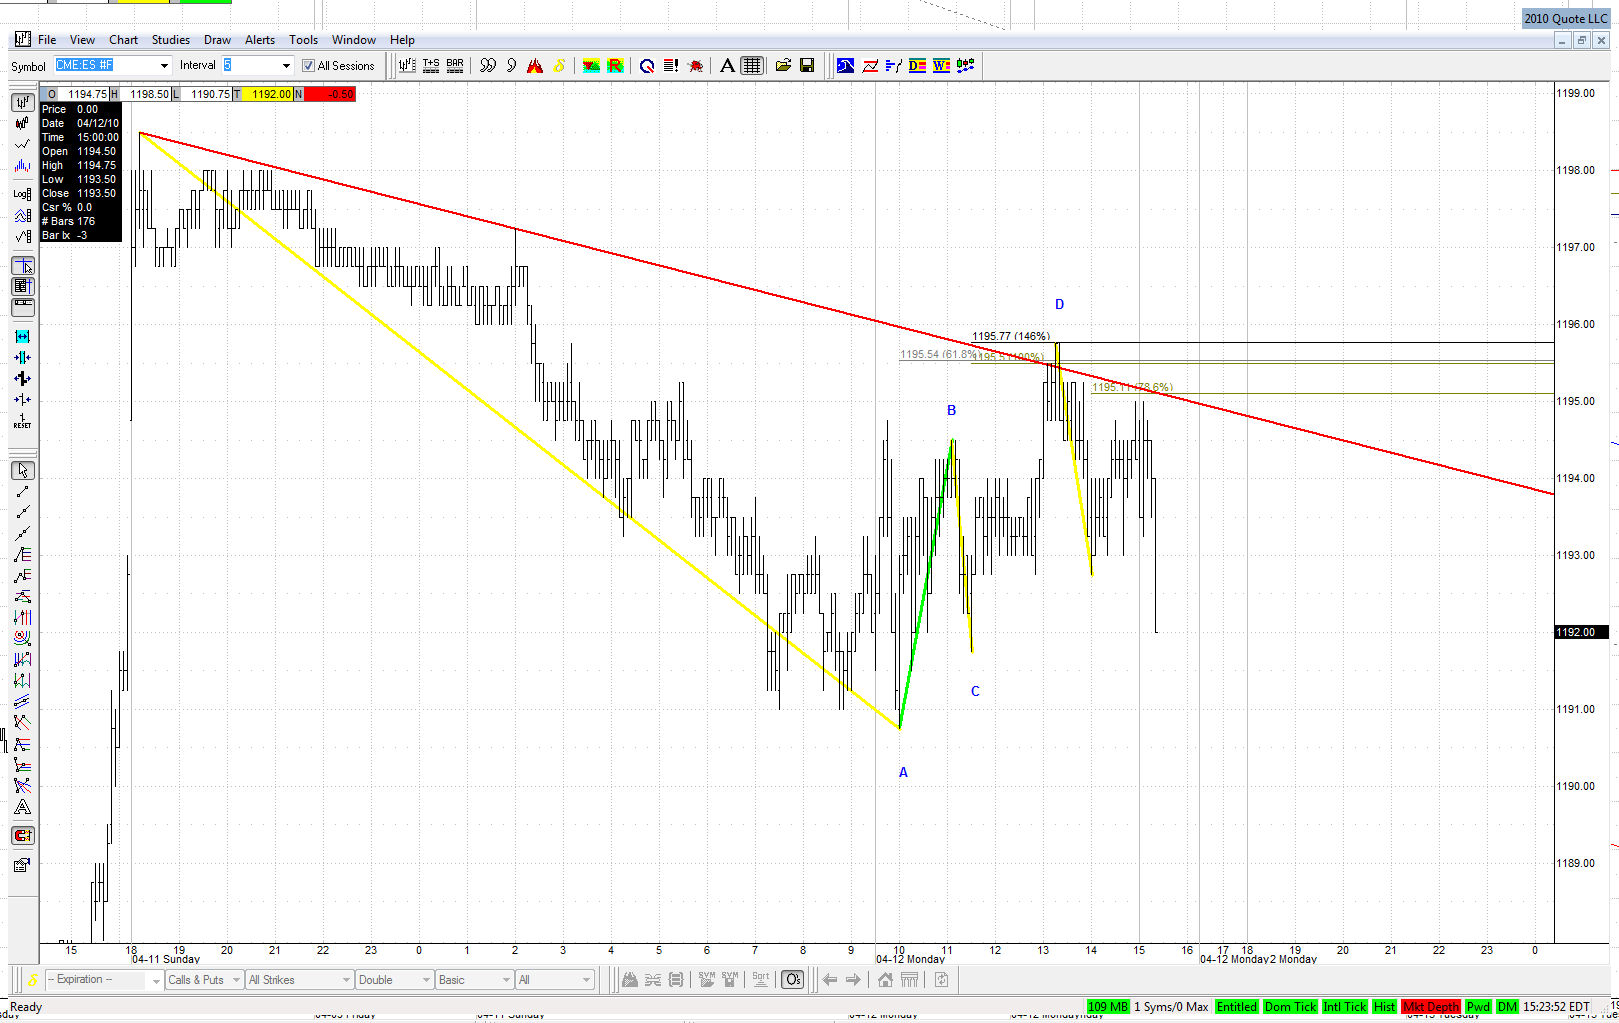
Watch what this does as it reacts off this ABCD here. It's now back to the area where it should jump up if the ABCD is not to play out. They may fool a lot of people, though, if this 'tops' without hitting 1200.
JA
jarek
Rep: 94
Posts: 3,474
Looks like it respects this ABCD. Pretty classic behaviour of the move off it:


Click image for original size
JI
jimkane
Rep: 3,058
Posts: 33,089
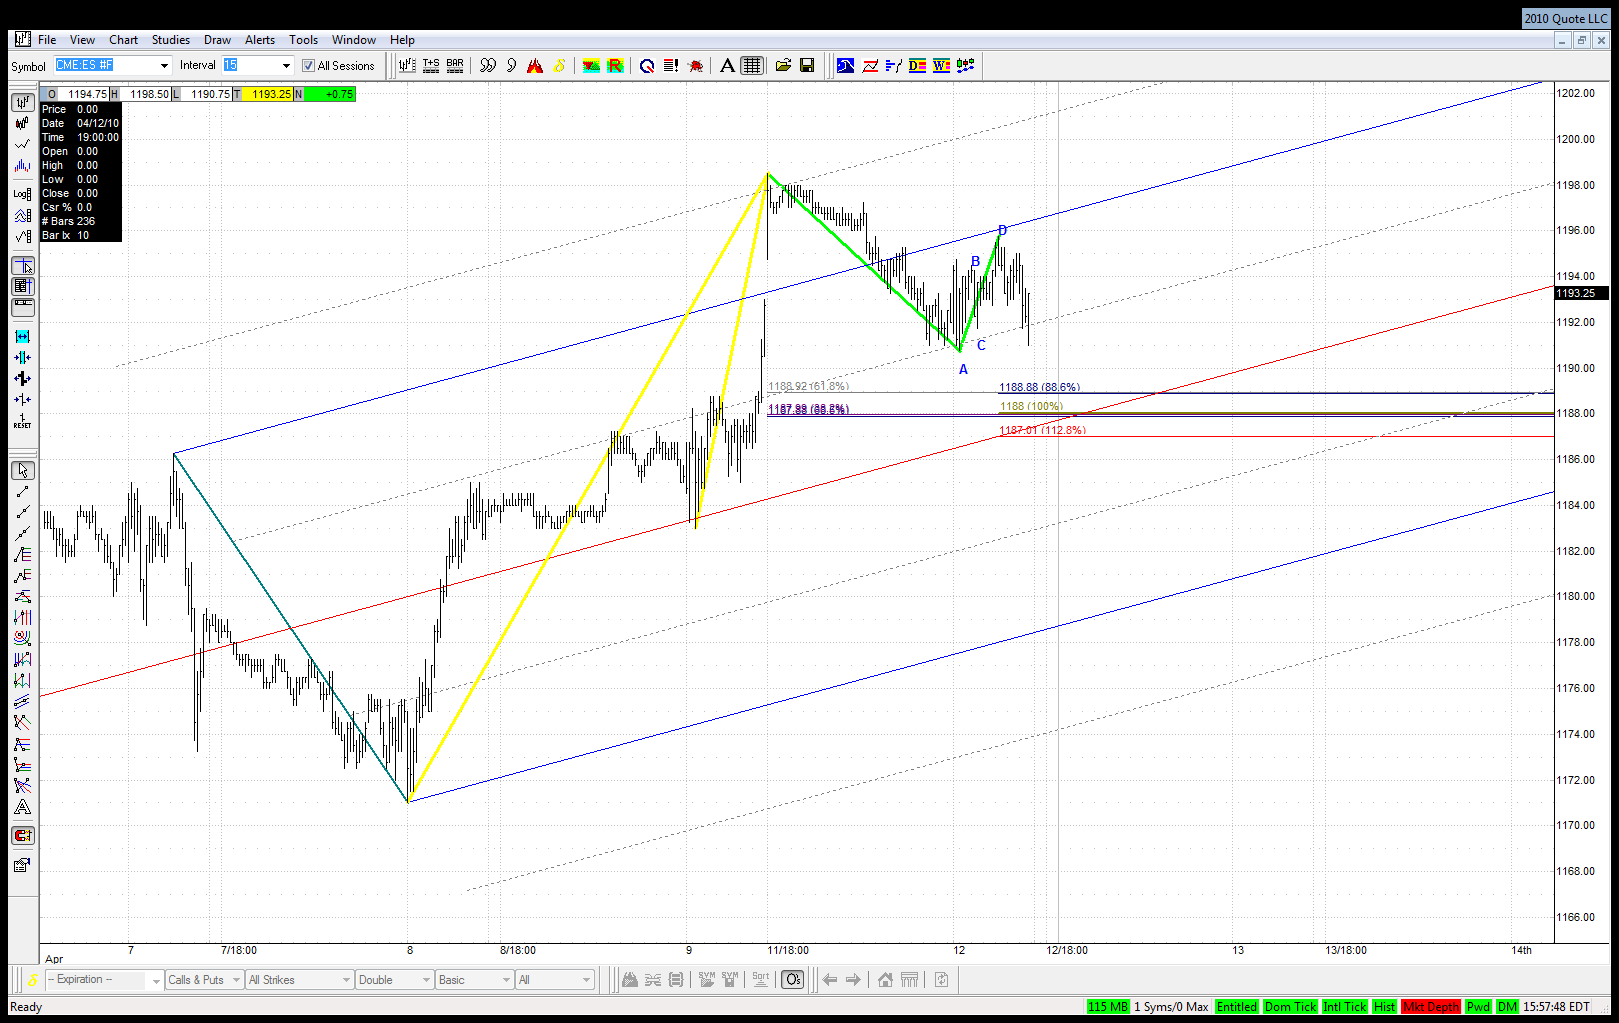
That's the one. Now, where are the next areas of interest?
JA
jarek
Rep: 94
Posts: 3,474
That should be the following potential bullish ABCD:


Click image for original size
JA
jarek
Rep: 94
Posts: 3,474
Originally posted by roofer

...the forcast was for the time period feb26 to april 12th to be the most relentless rally period of year...


Thanks for sharing Geo!
RO
roofer
Rep: 3,689
Posts: 3,574
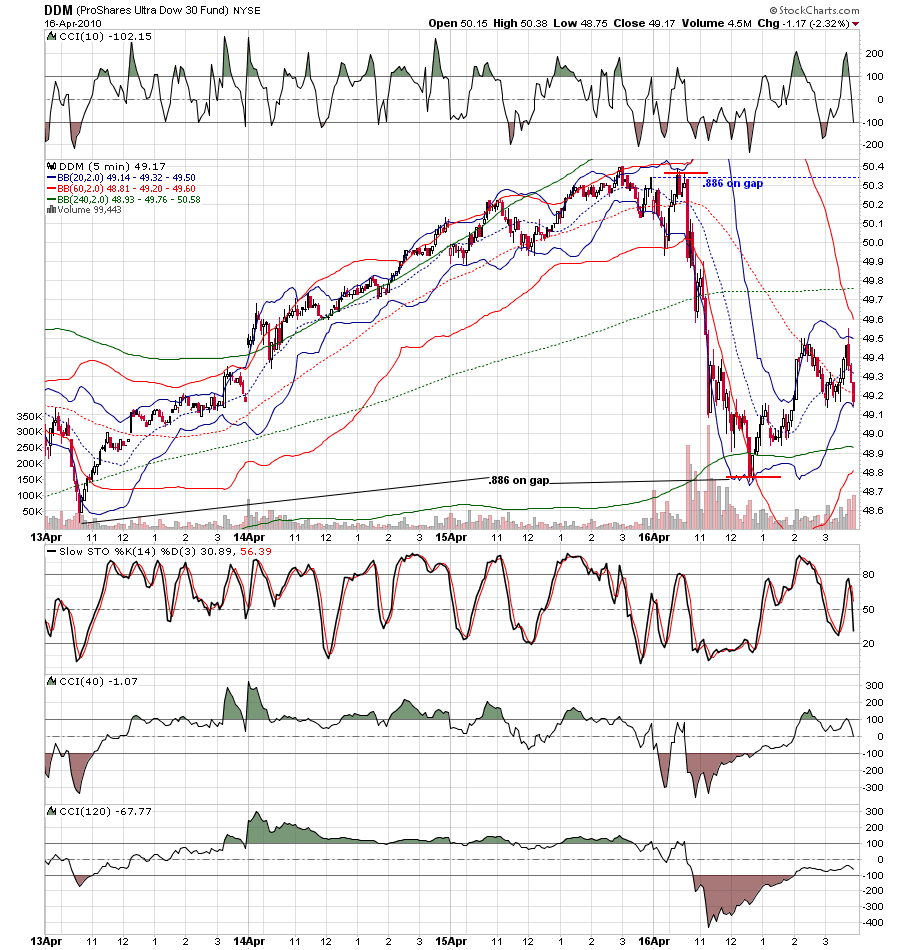
Click image for original size