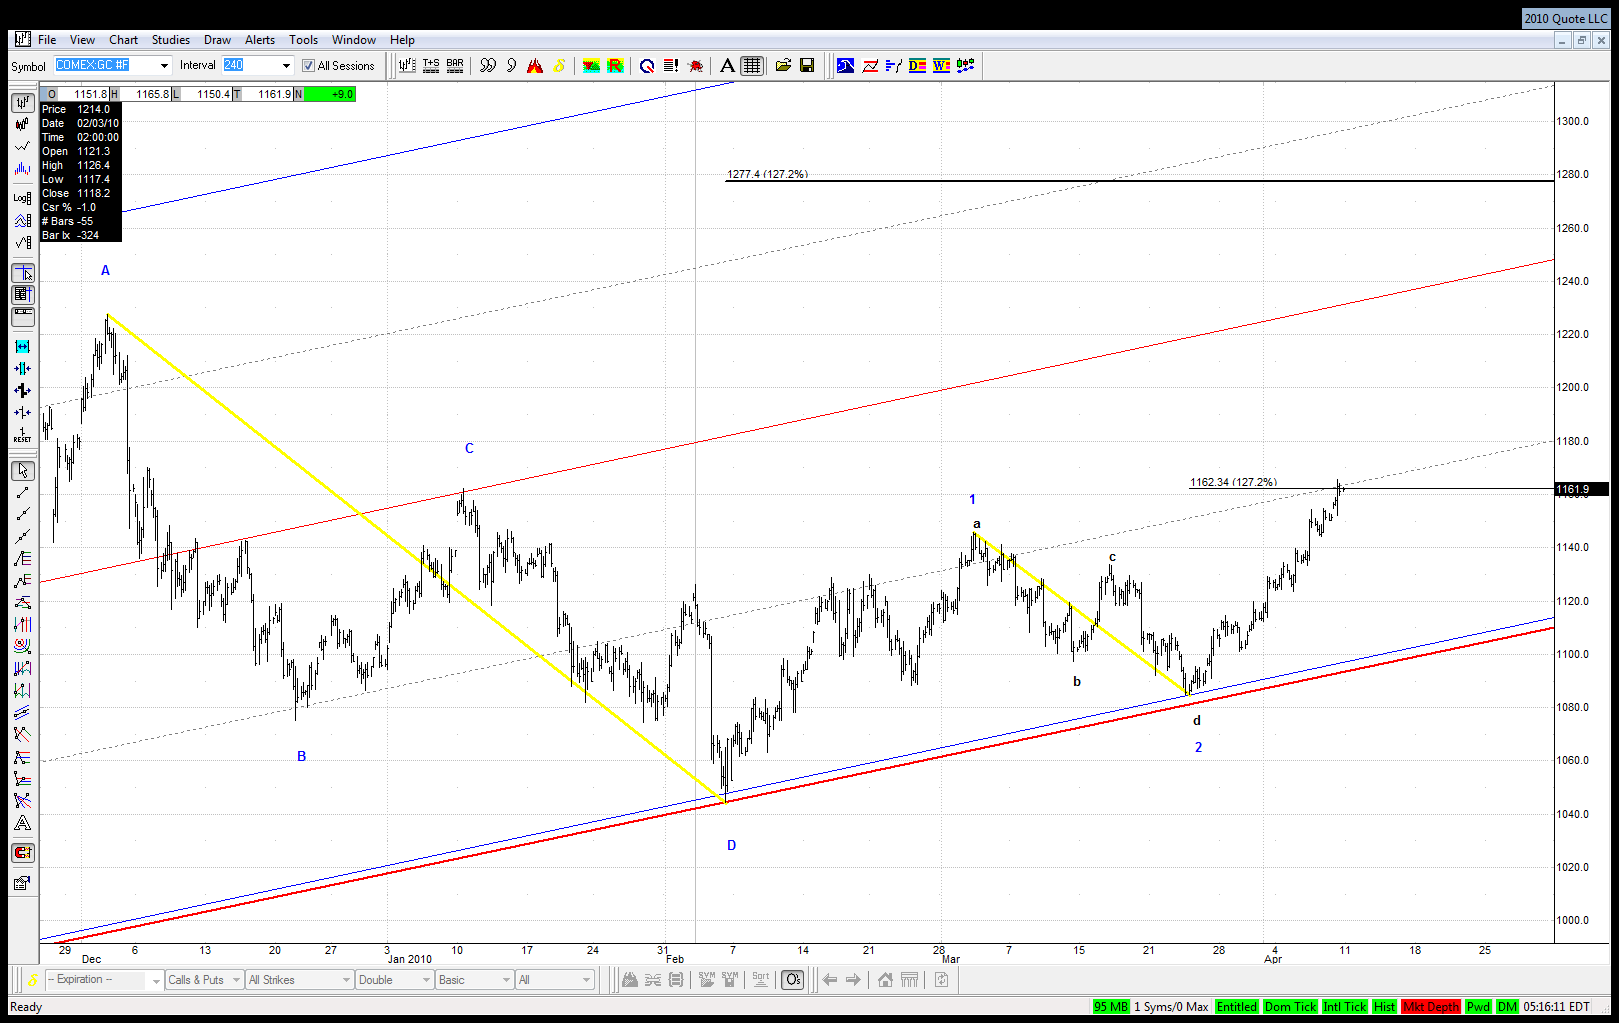
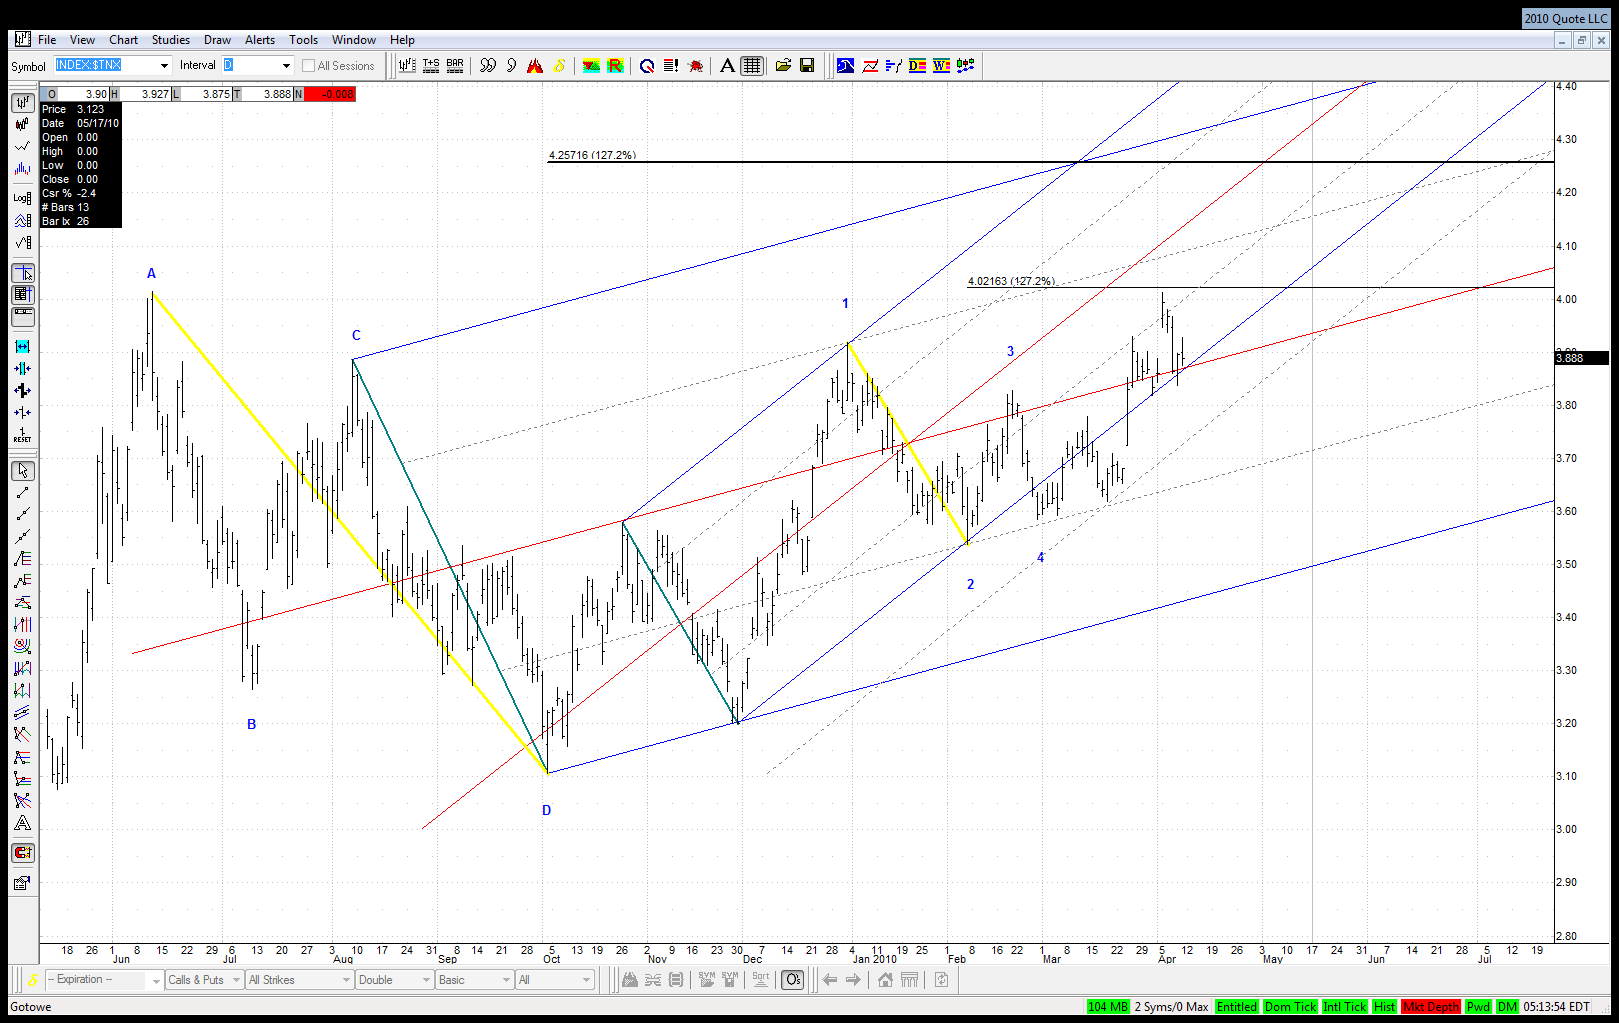
Here is the update of my recent charts for gold and rates:
Interestingly they share pretty similar characteristics:
- both issues were recently rising strongly which may seem contradictory, but as Jim pointed out might suggest inflation expectations
- both reached 1.27 external retracement of their respective smaller Kane patterns
- in both cases 1.27 retracement of their bigger Kane patters is still much higher what suggests that gold and rates should continue to rise together for some time to come
RO
roofer
Rep: 3,689
Posts: 3,574
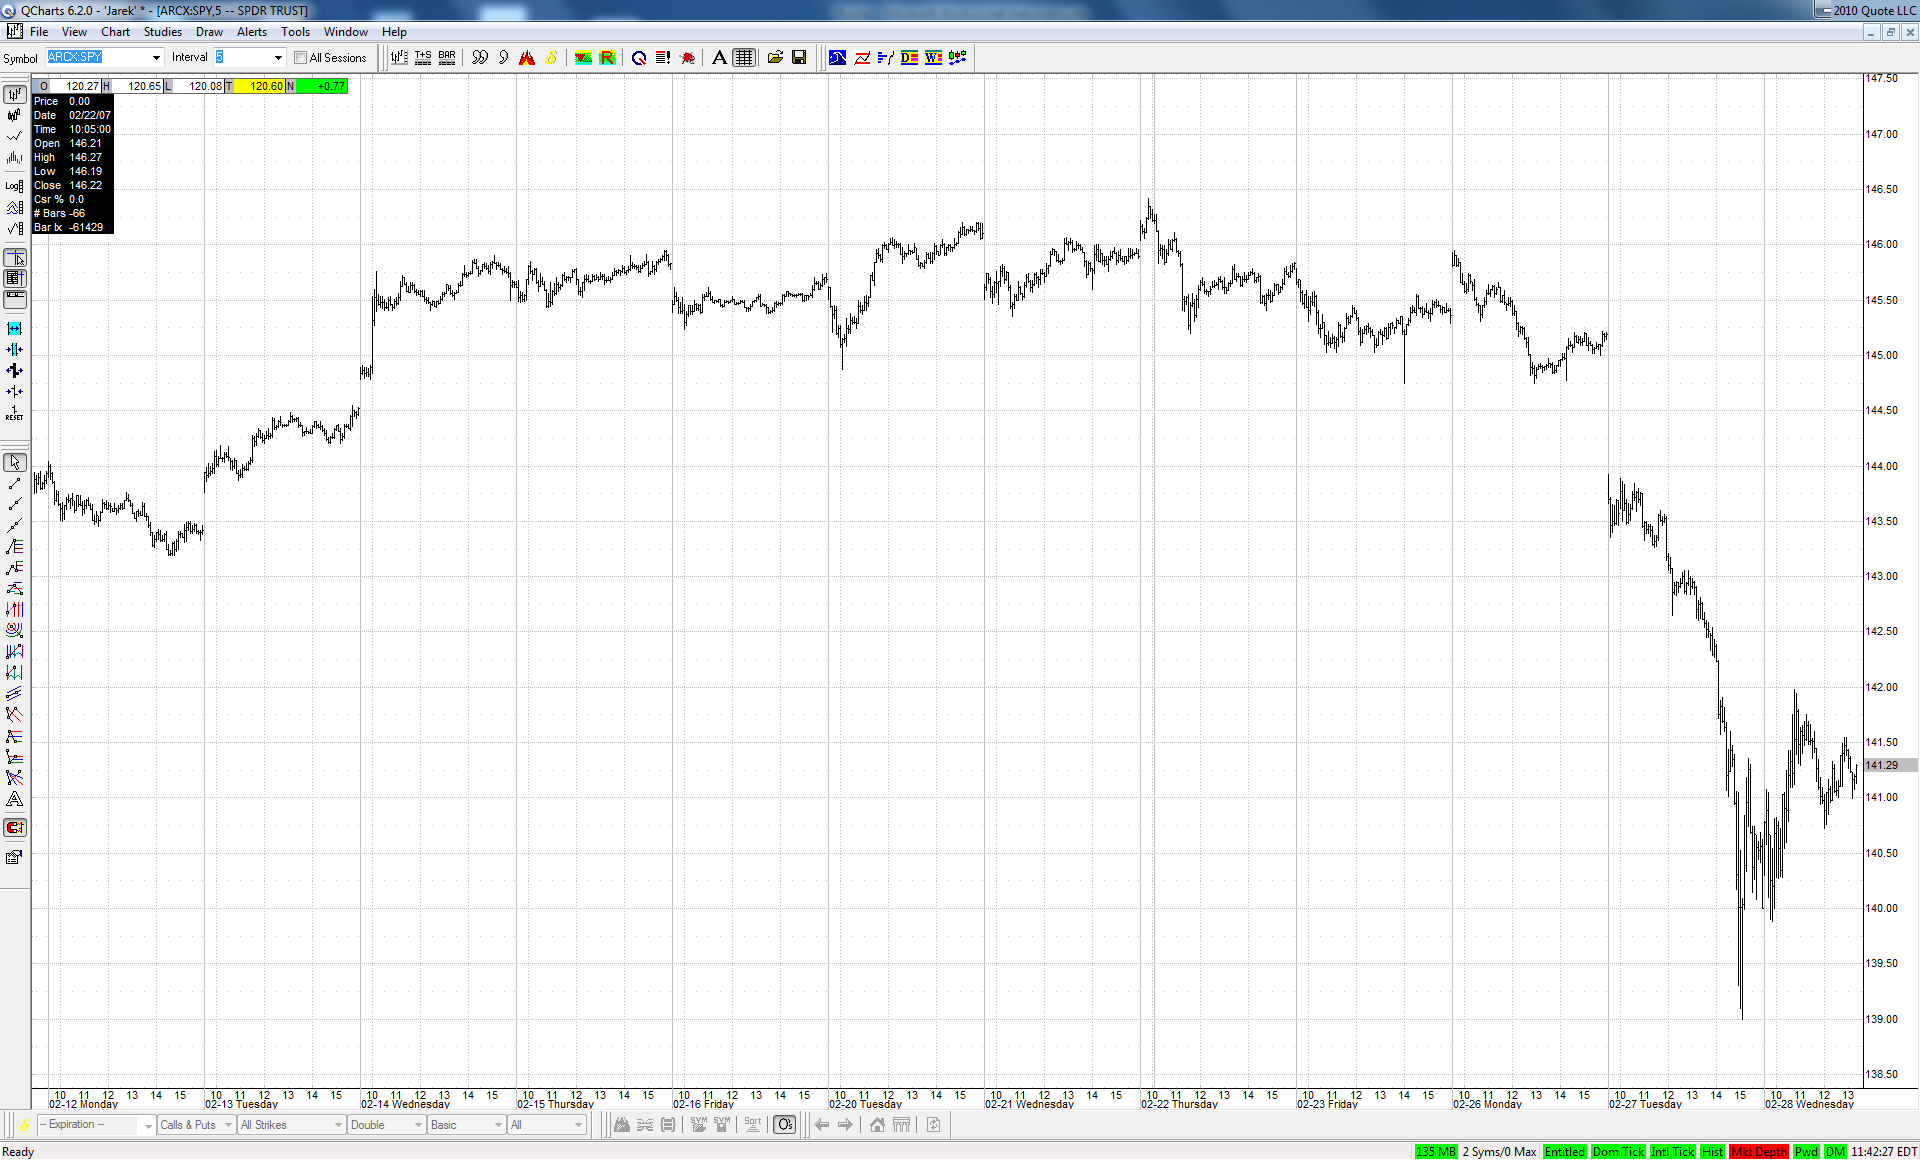
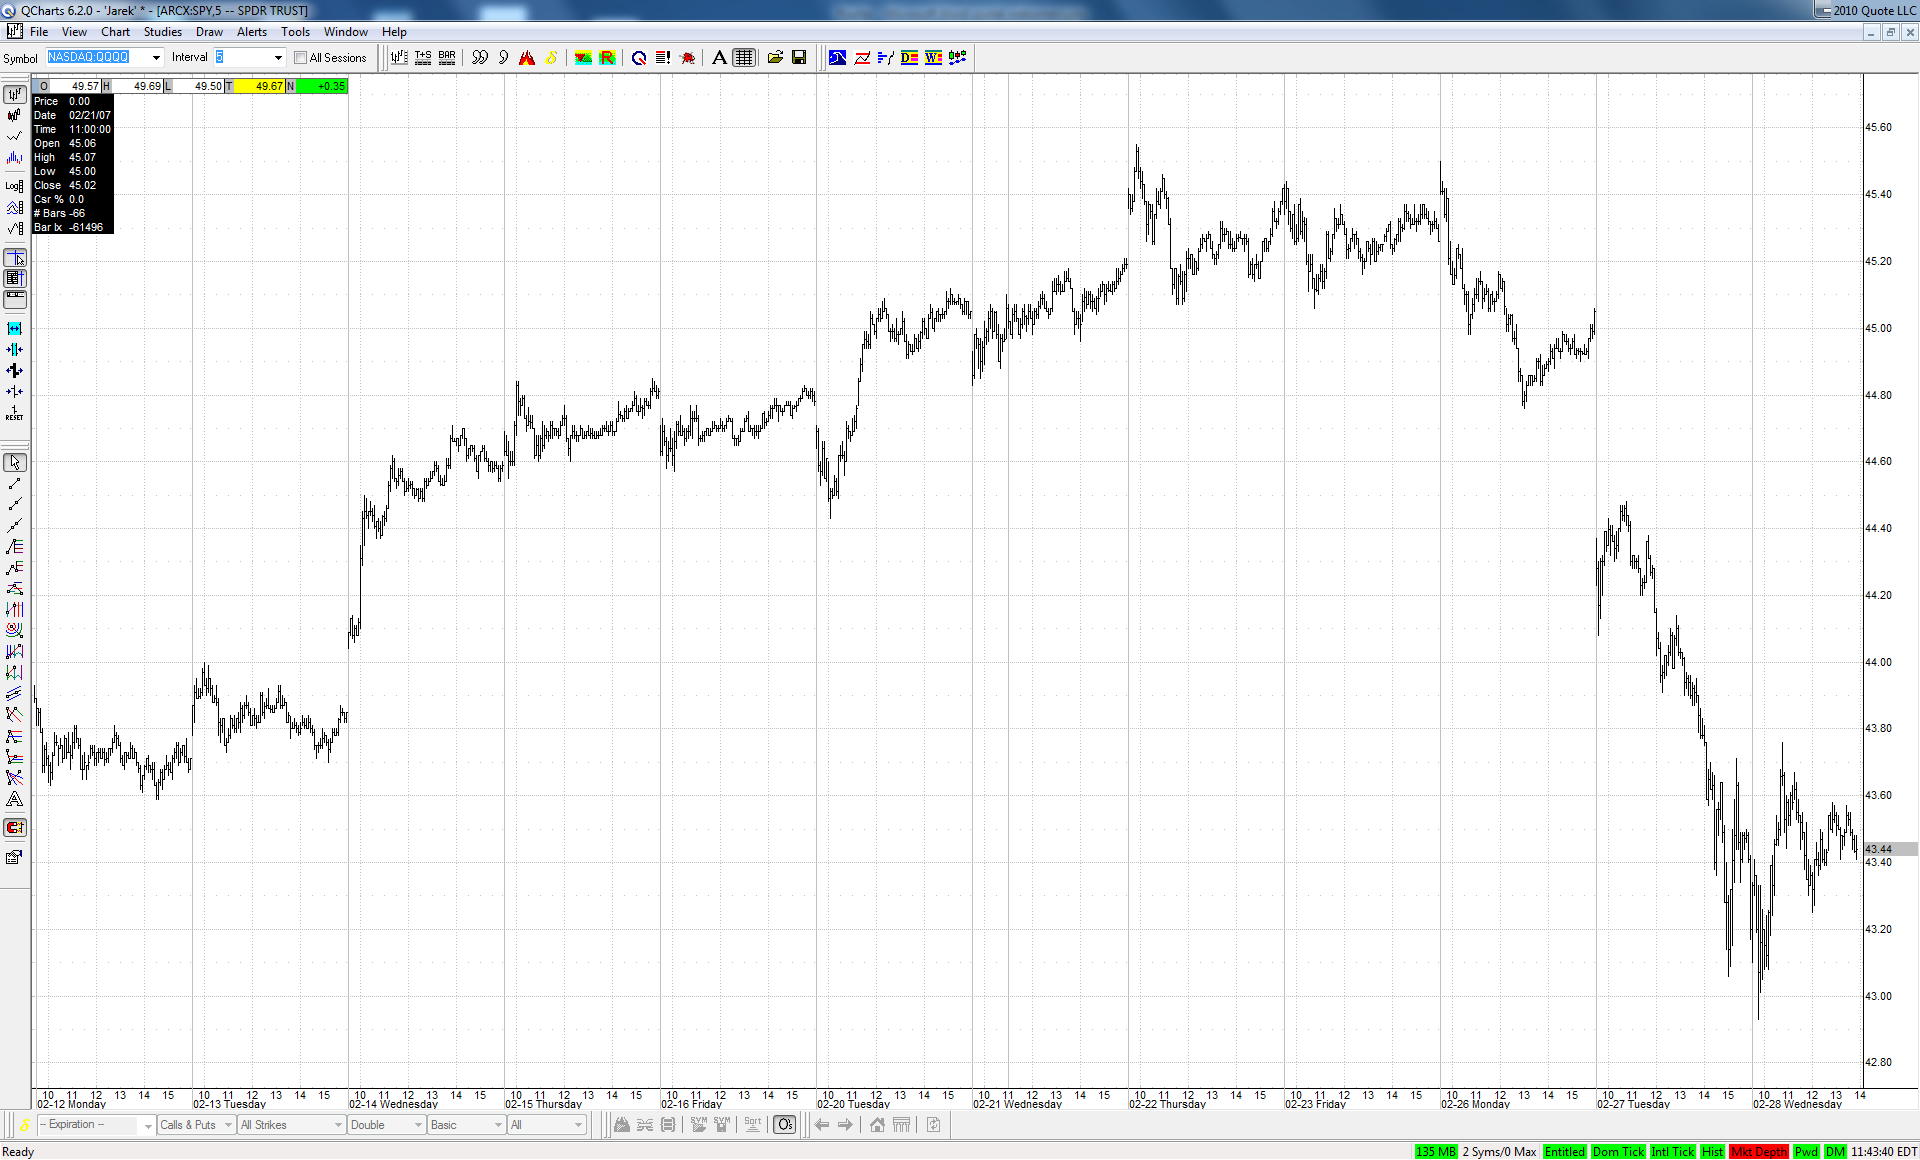
does anyone have the charts of the action before the 500 point selloff in feb 2007?mine were wiped on the last coimputer upgrade....
JI
jimkane
Rep: 3,058
Posts: 33,089
Just an interesting thing to watch here. INTC 'blew out' earnings, just knocked the cover off the ball, totally smoked 'em, real dot.com bubble type stuff. Just killed 'em. It jumped way up in the aftermarket. Curious, though, there's a key area I have been watching for in INTC for almost a year now. The gap up tomorrow, if it is at the aftermarket level, is right at my area.
Now, here's some thoughts. One, it will likely trade way up from here in the pre-market, and gap open well above my critical area, which ends the story right there. Two, it will likely smoke up from here big time even if it doesn't open up higher than this level. Three, it may lead the next leg of the meltup, as the market smokes way, way up from here. Betting against this trend has been fatal so far, and picking tops is a fool's game, as has been shown in here. Fourth, this area is not based on a pattern, as the market has simply been trending up for over a year. This means the area is nowhere near as significant to me as with a pattern. Look at all those nice ES lines and areas, which did nothing to even slow the market down. This area will likely do no more with INTC.
So, why even mention it? Well, the market is stretched and needs to come back in soon. I have been watching for this area for about a year now. It would make a nice spot for it to pull back from if the market pulls in. Gap and crap. Somehow I doubt it, but it is such a significant area, I'd be remiss not to even mention it so everyone can watch how it acts.
JI
jimkane
Rep: 3,058
Posts: 33,089
Futures look ready to 'Boink' up and over the RTH HOD any second now. Getting ready to run I suspect. 1200 will be history, and then more I think. We'll see. All I know is the play was long off that gift at the LOD area, and nothing has triggered a close yet.
JA
jarek
Rep: 94
Posts: 3,474
Originally posted by roofer
does anyone have the charts of the action before the 500 point selloff in feb 2007?mine were wiped on the last coimputer upgrade....
What symbol(s) are you interested in and what timeframe?
JA
jarek
Rep: 94
Posts: 3,474
Originally posted by jimkane
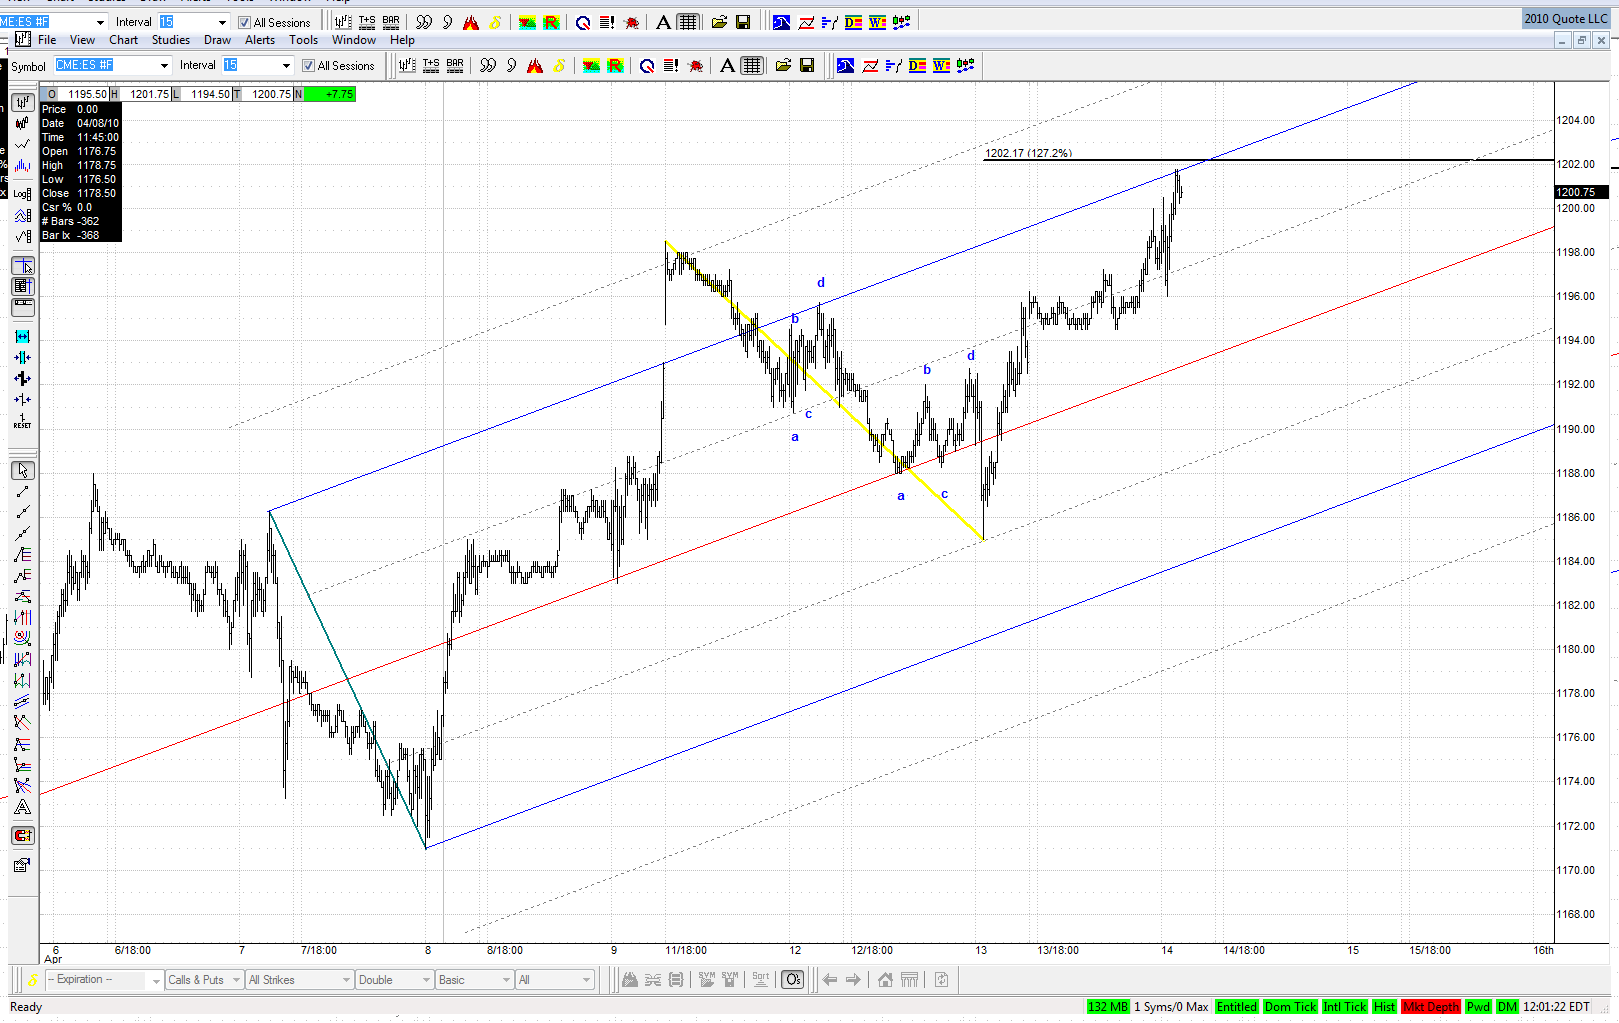
... 1200 will be history ...
Good call Jim in this tricky situation when after a failure of .382 ABCD instead of a selloff we have new highs. HOD lies exactly on the line from my earlier set and close to 1.272 ret of the last correction so there is a chance for at least a moment of rest for the bulls: