MyPivots
Sign In
JA
jarek
Rep: 94
Posts: 3,474
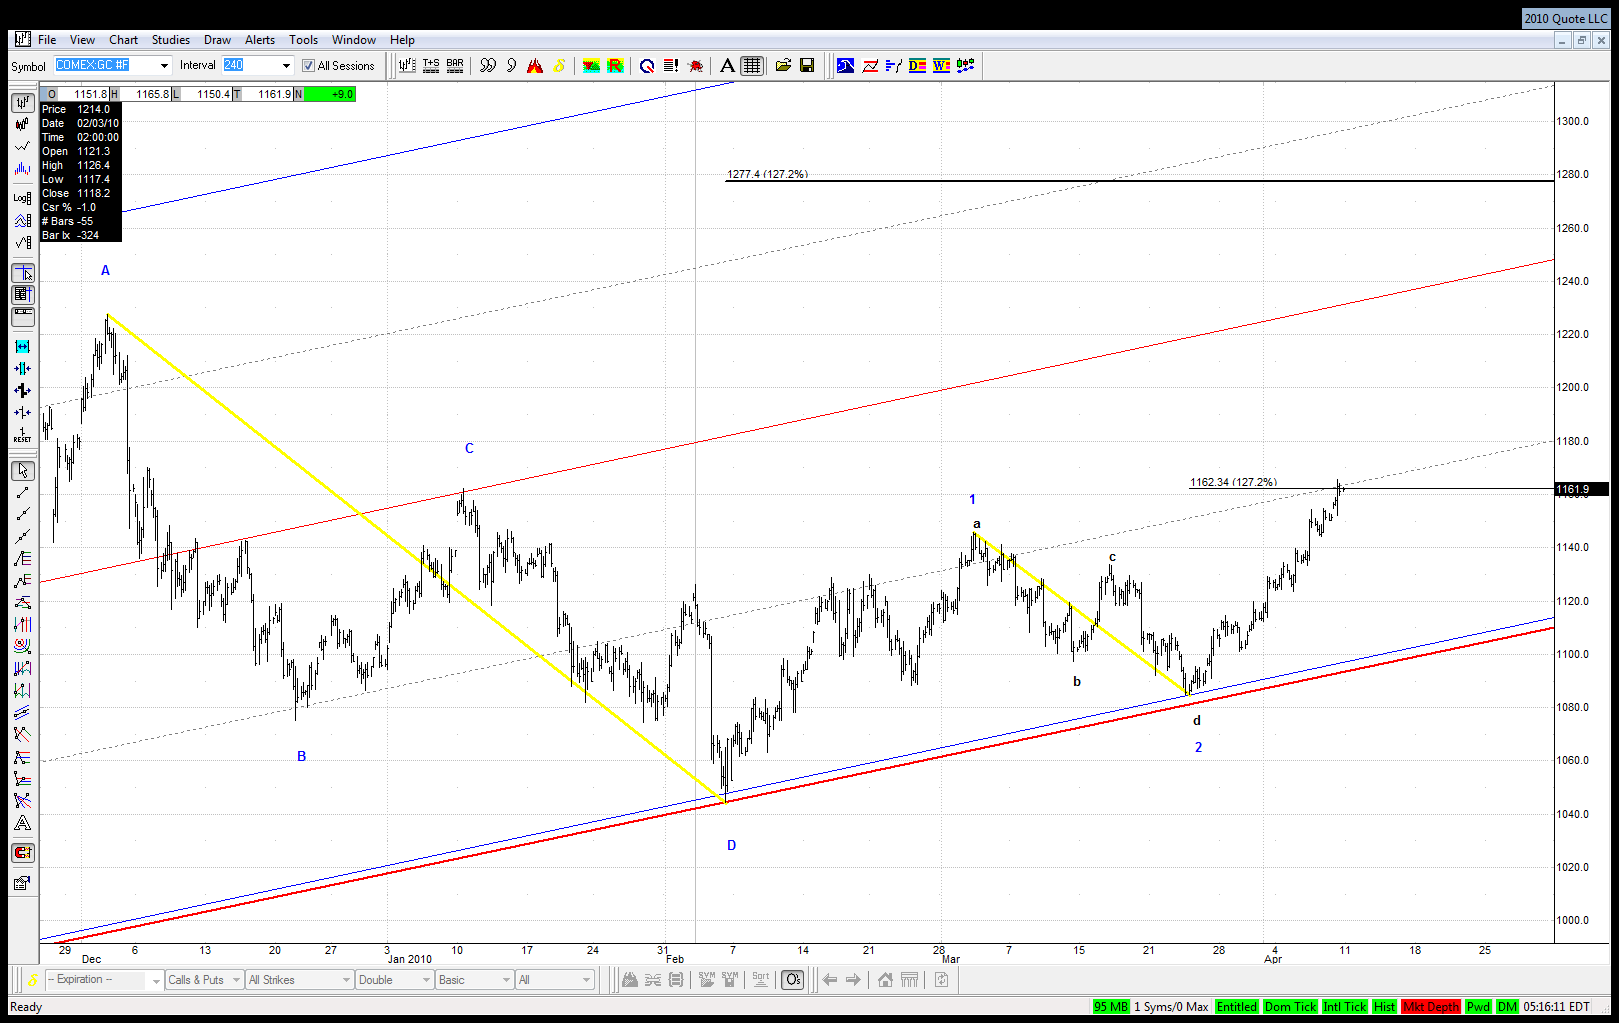
Here is the update of my recent charts for gold and rates:


Click image for original size

Click image for original size
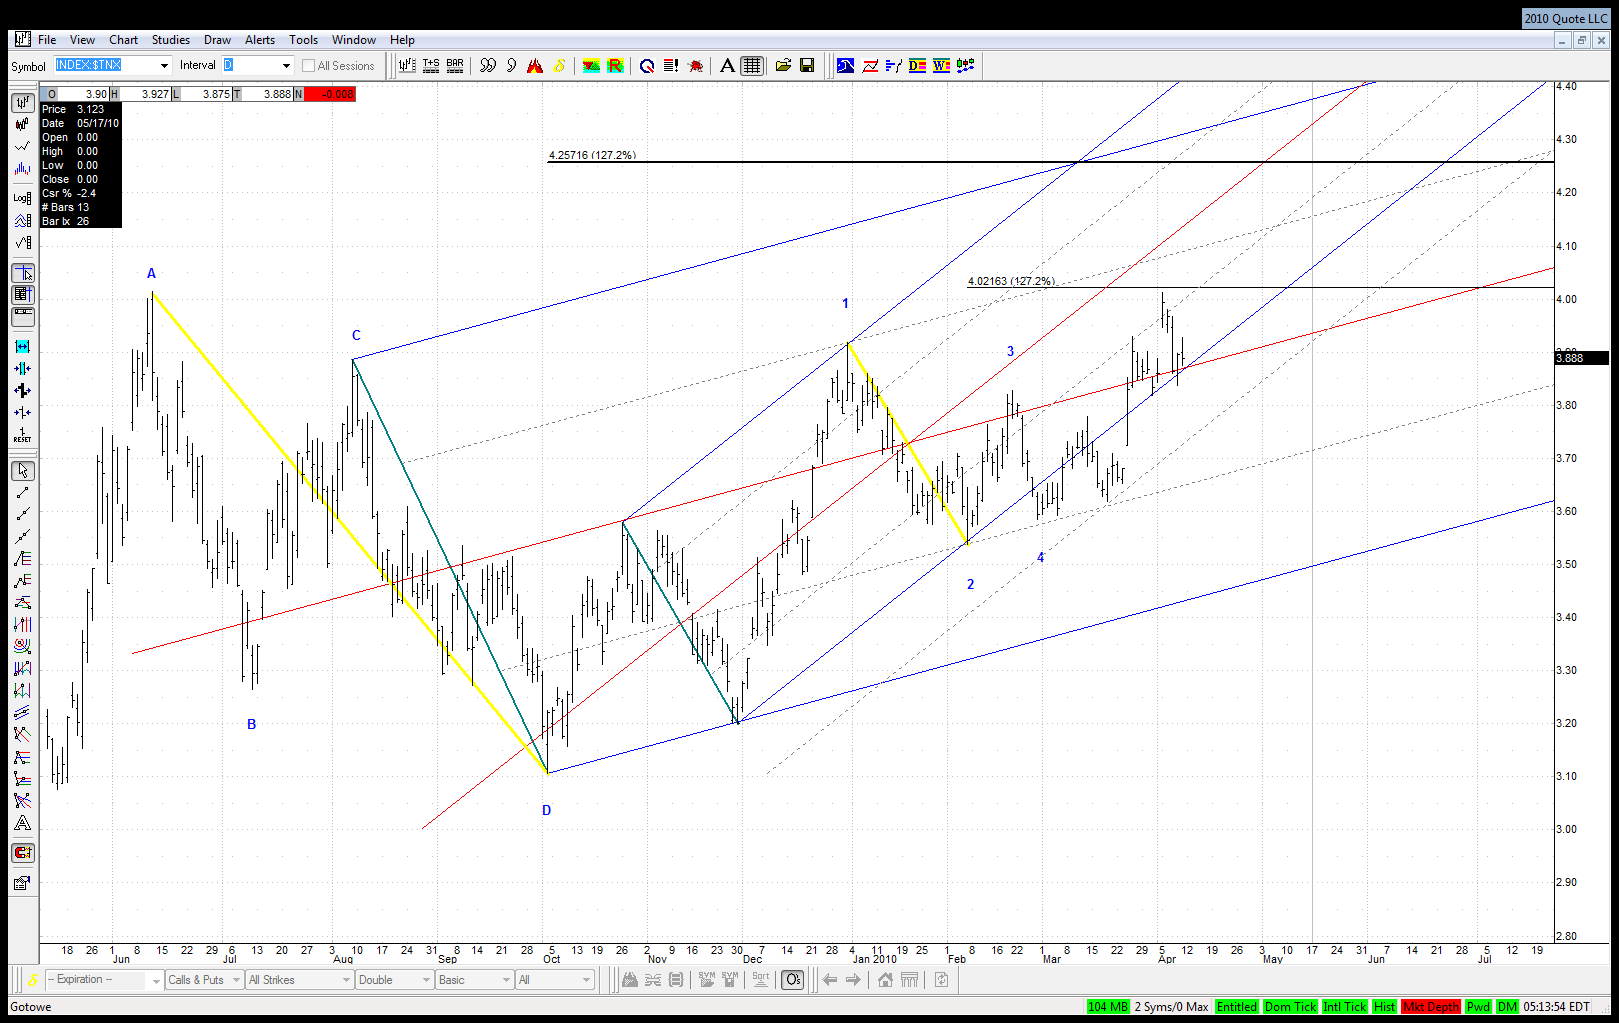

Interestingly they share pretty similar characteristics:
- both issues were recently rising strongly which may seem contradictory, but as Jim pointed out might suggest inflation expectations
- both reached 1.27 external retracement of their respective smaller Kane patterns
- in both cases 1.27 retracement of their bigger Kane patters is still much higher what suggests that gold and rates should continue to rise together for some time to come
JI
jimkane
Rep: 3,058
Posts: 33,089
Okay, GOOG gives me an opportunity to buy in the 565 area here. Will it do this big drop, which hasn't even dented the ES, and then run it right back up, and then gap up tomorrow? I'd be surprised by anything but that. So, did I load up the maximum allowable amount in that 565 area? I'll leave it to the readers to speculate on that.
RO
roofer
Rep: 3,689
Posts: 3,574
i share jim's sense of amazement at the disconnect. for a well thought out rigorous context for it all i turn to the analysis of tony caldaro. in a nutshell... that was THE bear market of our lifetimes.. the disconnects will be extreme , the real world will suck for at least a decade, the massive debt will be inflated out of.... he is on jim's side of pushing the long side until it plays out.please note, it was a gann based analysis that had the 12th at 1219 as important, not caldaro's work.of note, i have disagreed strongly with tony's work twice in private... both times based on jim's work.... both times jim's work was right....
JI
jimkane
Rep: 3,058
Posts: 33,089
Thanks for the post, roofer, in a way it makes me feel better (or should I say feel less bad?) about the lunacy. It's good to have you in here making your valuable contributions.
JA
jarek
Rep: 94
Posts: 3,474
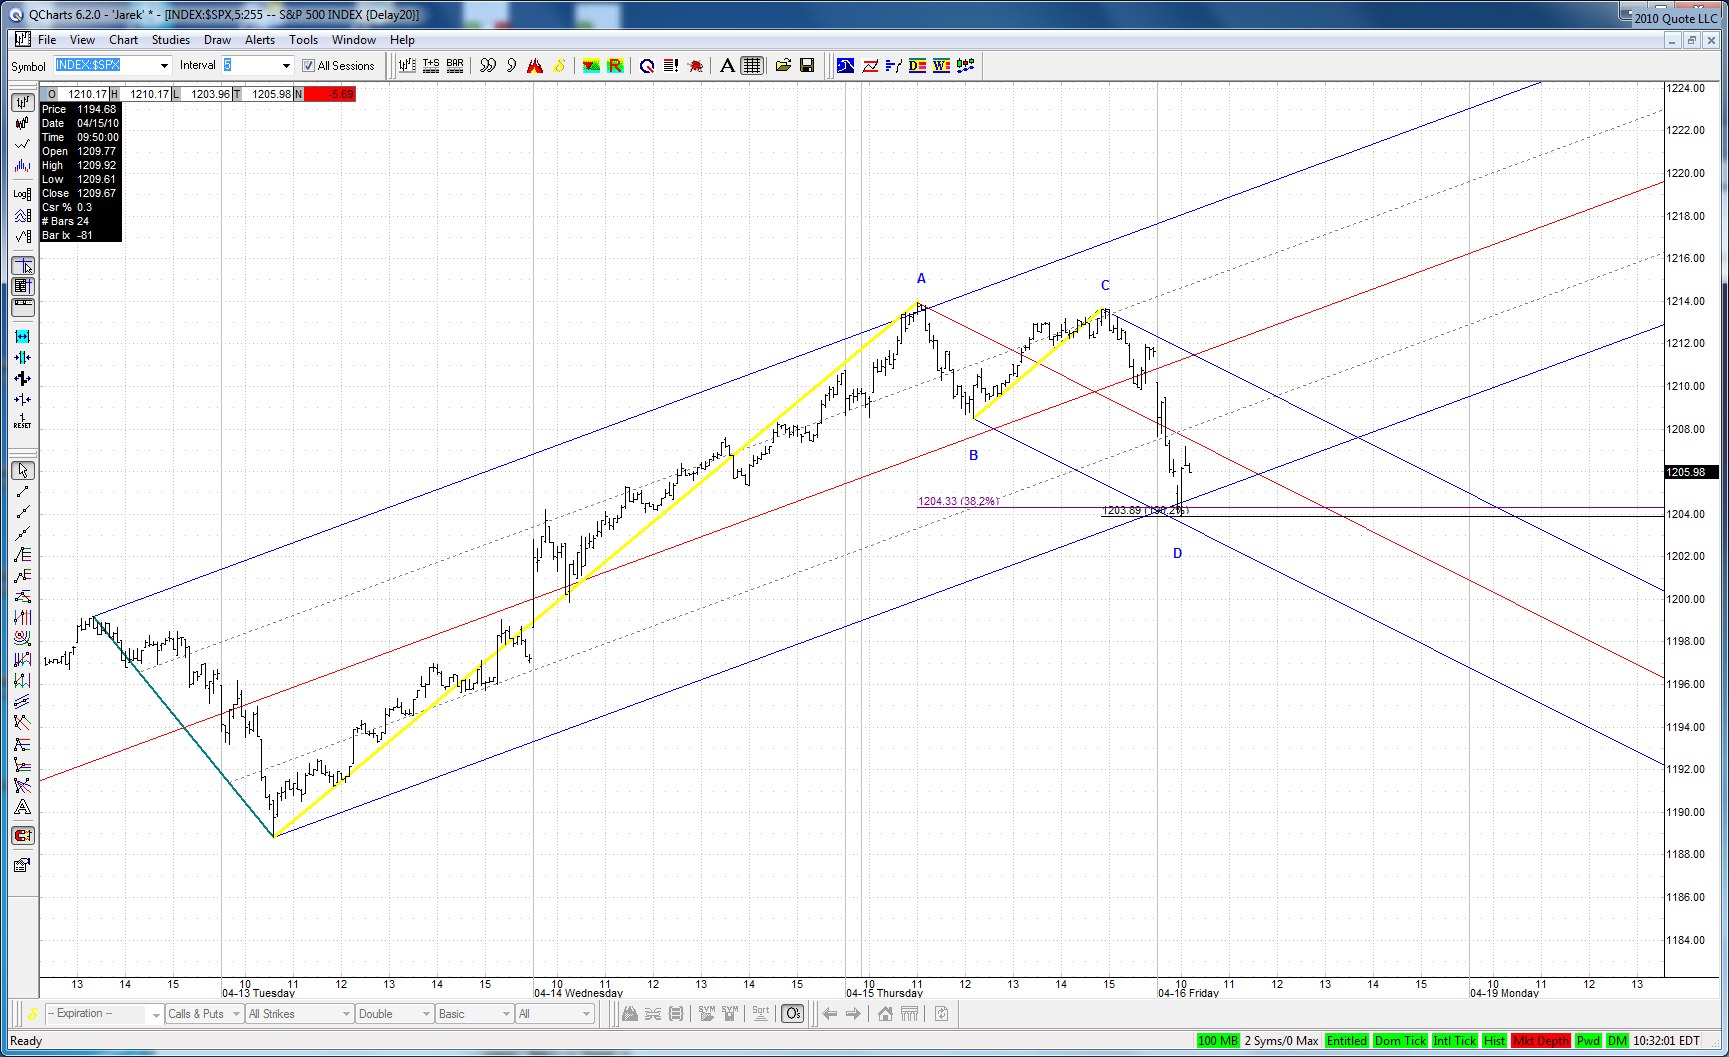
In SPX there is potential 1.902 DT ABCD right at .382. Thanks to Roofer we know what exactly are the chances for a new high with such setup. We also know that if it fails - it should fail badly. But few days ago such .382 ABCD in ES first failed and then ... ran to new highs. Strange market ...


Click image for original size
RO
roofer
Rep: 3,689
Posts: 3,574
i stand in the batter's box waiting for my pitch...... there it is.... i swing....this increased volatility has the feel of triangle starting or kane 4 pt before one more push up....
Click image for original size
RO
roofer
Rep: 3,689
Posts: 3,574
unless they can take out the swing lows with conviction, that may be it.....wonder who was holding the GS puts!
MR
mreiserer
Rep: 110
Posts: 2,220
Originally posted by jimkane

The point of my above post? Only to say that I've never seen such a disconnect with reality as this in the entire experience of my life. In any area, in or out of the stock market. Not even close during the dot.com mania. When I look at what I think is underlying the world economy right now, the ticking timebombs, I think this dwarfs the dot.com bubble. This is well into the end stages of tulip mania, South Seas bubble type stuff. And it is just bizarre to see it happen, to live in such a world, to see so many people not see this point. It's truly a 'Bizarro' world now. And I'm just blown away seeing it.


Jim, this doesn't surprise me one bit. You know we have discussed this aplenty. We are living in a fantasy world and the markets are an extension of that to the extreme. No surprise at all. We talk ourselves out of facing the reality of things, because it's too painful to deal with and choose fantasy instead. In my opinion we will see the Dow at 20K before we see it back down where it was over a year ago.
There is too much vested interest in protecting what is rather than bringing about real change. It's always been like that. The odds are just not in favor of that.
JI
jimkane
Rep: 3,058
Posts: 33,089
Sorry I haven't commented on what I think is the best action I have seen in months and months. Been a little busy :-)

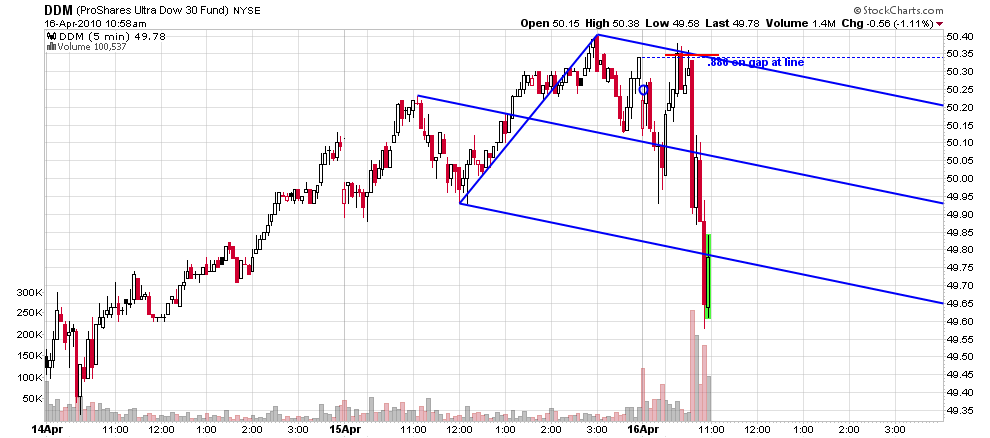
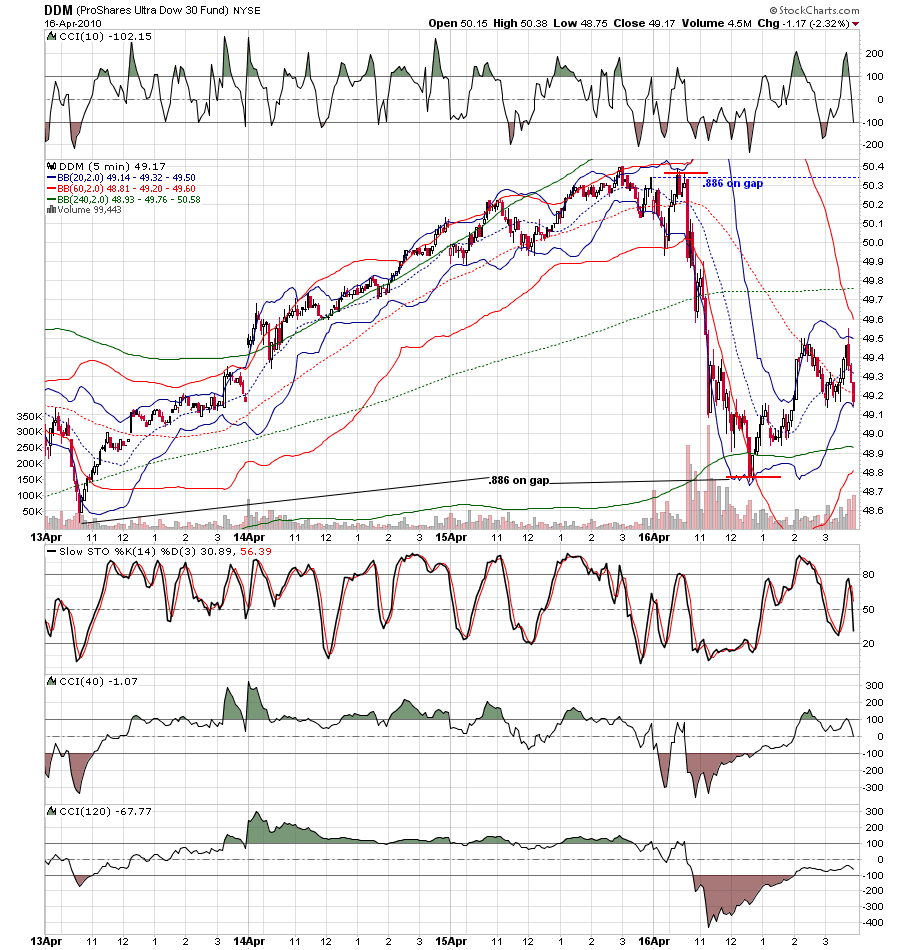
Anyway, is this the tipping event we have been waiting for? Or just a silly one day flash in the pan like all the others?

Now, I am not going to try to pick the end to this flush in one shot (in other words, the exact reversal point), but be aware there is a super-key support area right here. It is a six contact TL on the 60-min RTH chart. I would suspect the odds of this creating a bounce are very high. I'm not saying it has to be more than a bounce, but to sell this much to such an area and not bounce, that would be very curious, and odd, even if in the long run that was the end of the bull. Just something to watch here. I know I'm 'tight' on the management side right now.
JI
jimkane
Rep: 3,058
Posts: 33,089
I notice, after lots and lots of talk of the S&P hitting perhaps 1225, Carl Futia now upped his target to 1275. Every time he talks about a target and it gets hit, he just raises the target (this time he raised the target before it even got hit). Reminds me of all those analysts on TV and the market always being 20% undervalued no matter where it is trading. He's also calling for oil at 50. Very interesting guy, that Carl is.
JI
jimkane
Rep: 3,058
Posts: 33,089
I have some sub-levels I am watching on the way up here right off that key line area.

89.50 (right here, now)
91.25
93.25
95.25

Each area has a little tolerance in it, and given they are about every two points, the use of these areas really comes from the linework, which I will leave to everyone to do. Point is, there are some key layers coming in here for the next six points. I would expect the upper level is reached, and then it may roll down into an ABCD. I'd prefer a bigger bounce for an ABCD. But, who knows, it may roll off this first area and just keep selling, too.
RO
roofer
Rep: 3,689
Posts: 3,574
Click image for original size