ES Short Term Trading 4-21-10
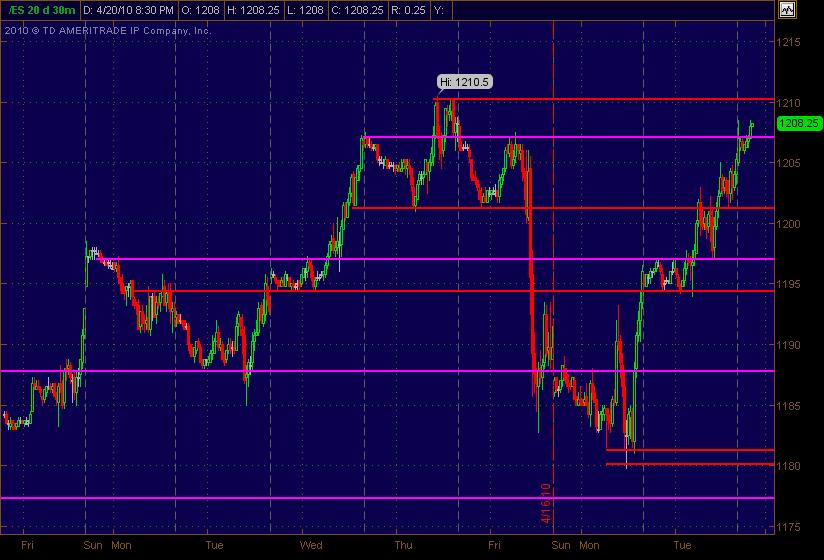
Here's my Monkey S/R price levels from what I see. The Red lines are the "regular" potentially significant ones while the Magenta ones are somewhat significant, but a step down from the Red ones. Here's the 30min chart of 'em ... a map for Wednesday.
If 1201 can hold 1207 possible
1205.75 is yesterday's high. A key number for today.
Originally posted by phileo
out 1205.5 on my remaining contract. Flat now.
I didn't see 1205 as anything significant when i did my homework, does anyone know what was so special about 1205 ???
1203.5 possible
I sure do...vendors tried to capitalize on it too...one guy Mohan or something like that had it part of his HIGH five or something...
I think this is why I like using the averages and the previous highs/ lows etc......they don't change in the sense that a component may change but the traders still watch the cumulative data that the index represents...
I think this is why I like using the averages and the previous highs/ lows etc......they don't change in the sense that a component may change but the traders still watch the cumulative data that the index represents...
Originally posted by day trading
Originally posted by BruceM
...Years ago Dell was the market buzzword stock...
Although I don't do it personally, I think it's a great idea to watch key market moving stocks...
Do you remember when Merrill Lynch was a key market barometer before it was delisted?
Originally posted by BruceM
here is the carryover chart from my post in yesterdays thread. They will attempt to fill in this area on the chart with the 1202 being the key price.....It would have been a good trade but I missed the short....anyway this is the area they will fill in and the volume histogram to the right of my chart should become bell shaped
Here is how today is shaping up and how they are filling in that area...note the sideways bell shape...like any consolidation it will only be good for so long until it breaks....the smart money was selling high and buying low anticipating it would go back to the middle....Seems like lots of us where smart here at the forum today...nice trades everyone!
As I type they are breaking the pattern down .....
Originally posted by ak1
As we are near the open so I think we are going to see a choppy open. So the oscilators are going to make money. Also SP yesterday open at 1186 needs to be tested. The only thing preventing it is the 1203 area which is a swing low
Will they make it to 1186
I don't think that will happen today Ak1 but if you are short then I hope ya get it..I'm thinking they are going back to 1200 - 1202 again but am not trading anymore today
Congrats to BruceM, MonkeyMeat, and KoolBlue - everyone got their fair share today, I take it!!
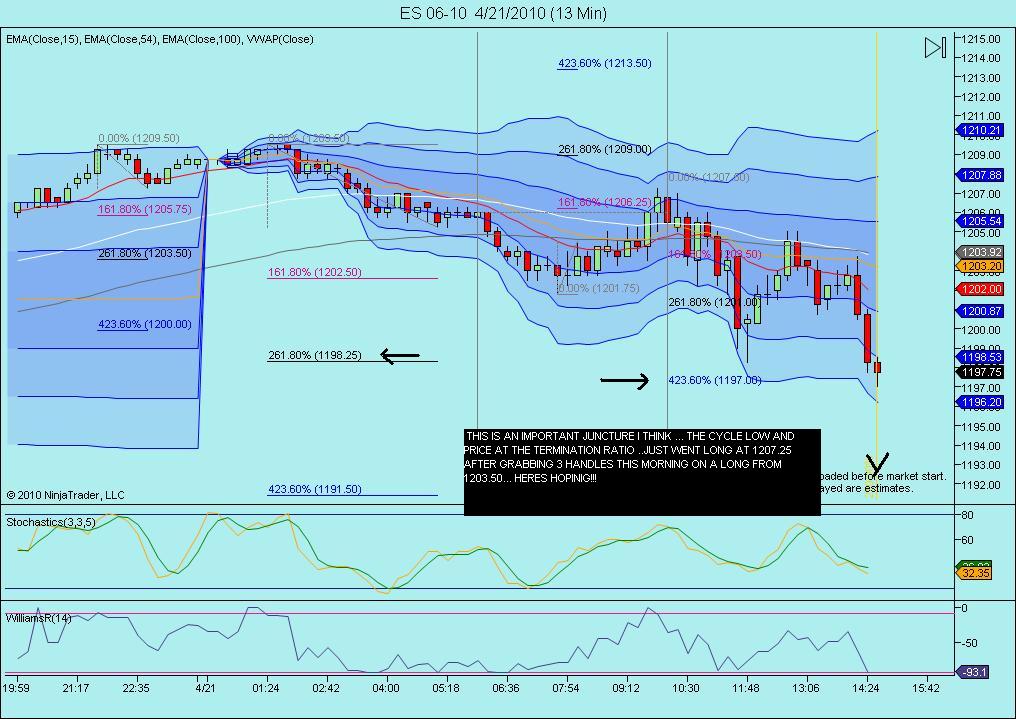
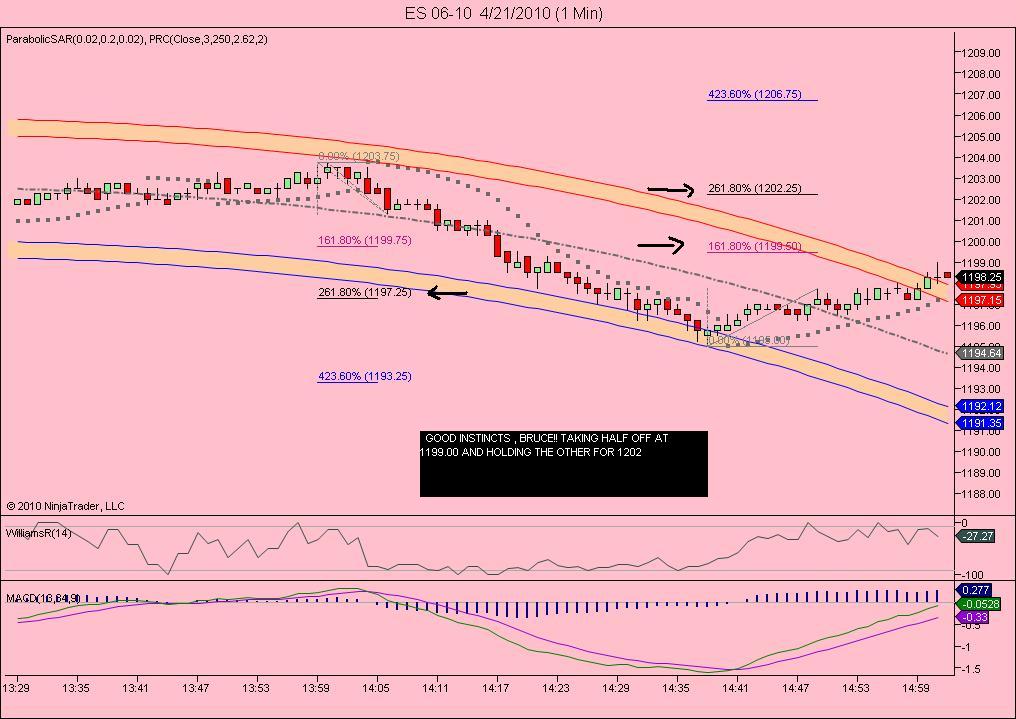
I saw that 1196 reversal, but was too scared to take the trade because:
1) I was already profitable from my first trade
2) that drop from 1203 - 1195 spooked me a little - I thought it might have enough momo to break below 1195. maybe I'm watching the screen too closely ?
Need to look up Dr. Brett (again)
Originally posted by ak1
As we are near the open so I think we are going to see a choppy open. So the oscilators are going to make money. Also SP yesterday open at 1186 needs to be tested. The only thing preventing it is the 1203 area which is a swing low
Originally posted by ak1
Oh!I meant in terms of touching open, highs and lows. If Dow touches one and SP doesn't then we have a divergence that is met the following day. Just a trading bias for the next day.
Sorry folks yesterday's (20/04) open was 1195.75 not 1186. This level was finally touched.So if we notice any diversion between SP and Dow and use it to enter we may profit.
Emini Day Trading /
Daily Notes /
Forecast /
Economic Events /
Search /
Terms and Conditions /
Disclaimer /
Books /
Online Books /
Site Map /
Contact /
Privacy Policy /
Links /
About /
Day Trading Forum /
Investment Calculators /
Pivot Point Calculator /
Market Profile Generator /
Fibonacci Calculator /
Mailing List /
Advertise Here /
Articles /
Financial Terms /
Brokers /
Software /
Holidays /
Stock Split Calendar /
Mortgage Calculator /
Donate
Copyright © 2004-2023, MyPivots. All rights reserved.
Copyright © 2004-2023, MyPivots. All rights reserved.


