ES short term trading 4-26-10
I'm not sure if we want a different thread outside of the Weekend preview for the current day but here it is anyway.
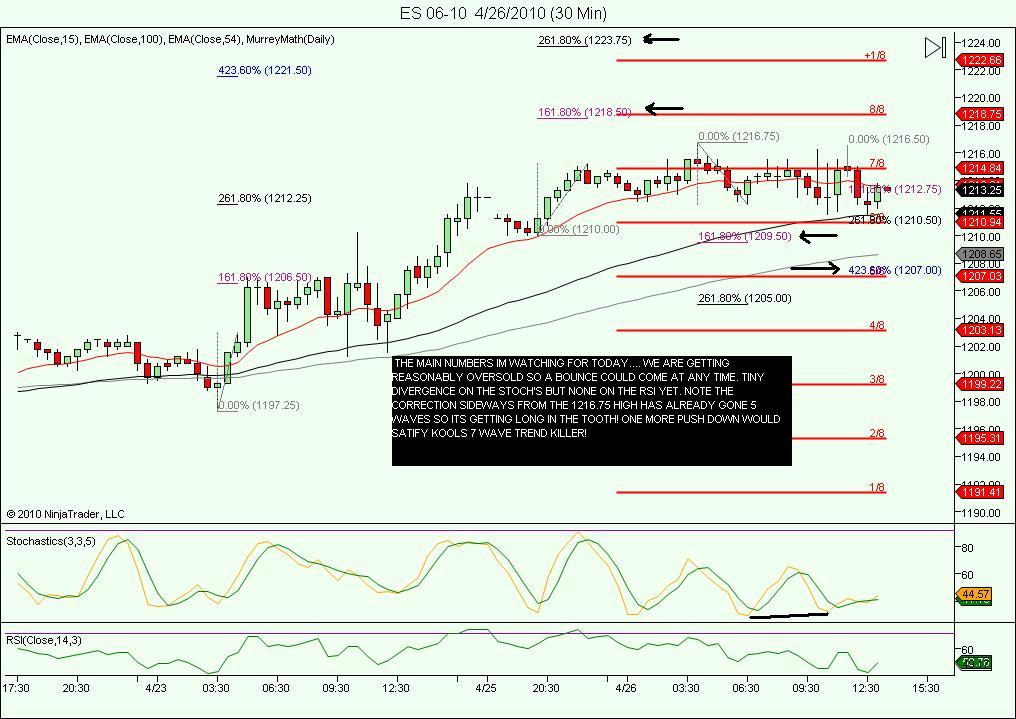
We have daily and weekly R1 levels at the 1224 area which goes well with one of Kools targets and the key number of 1225.
Fridays lows match up well with the weely Pivot and the daily S1 so 1202 -1200 needs to go the radar...another key number.
More current is the O/N low at the 1210 as that was also a low volume area from friday...I'm looking to get that run out today...the 1206 area was the other key breakout point
So far barely a 7 point range in the O/N so will be watching the open in RTH and the midpoint...I'll update later closer to the open...no time spent at 11.75 in the overnight so an obvious first attractor..and it currently sits just below a swing point....I think they will run that out..
Click image for original size
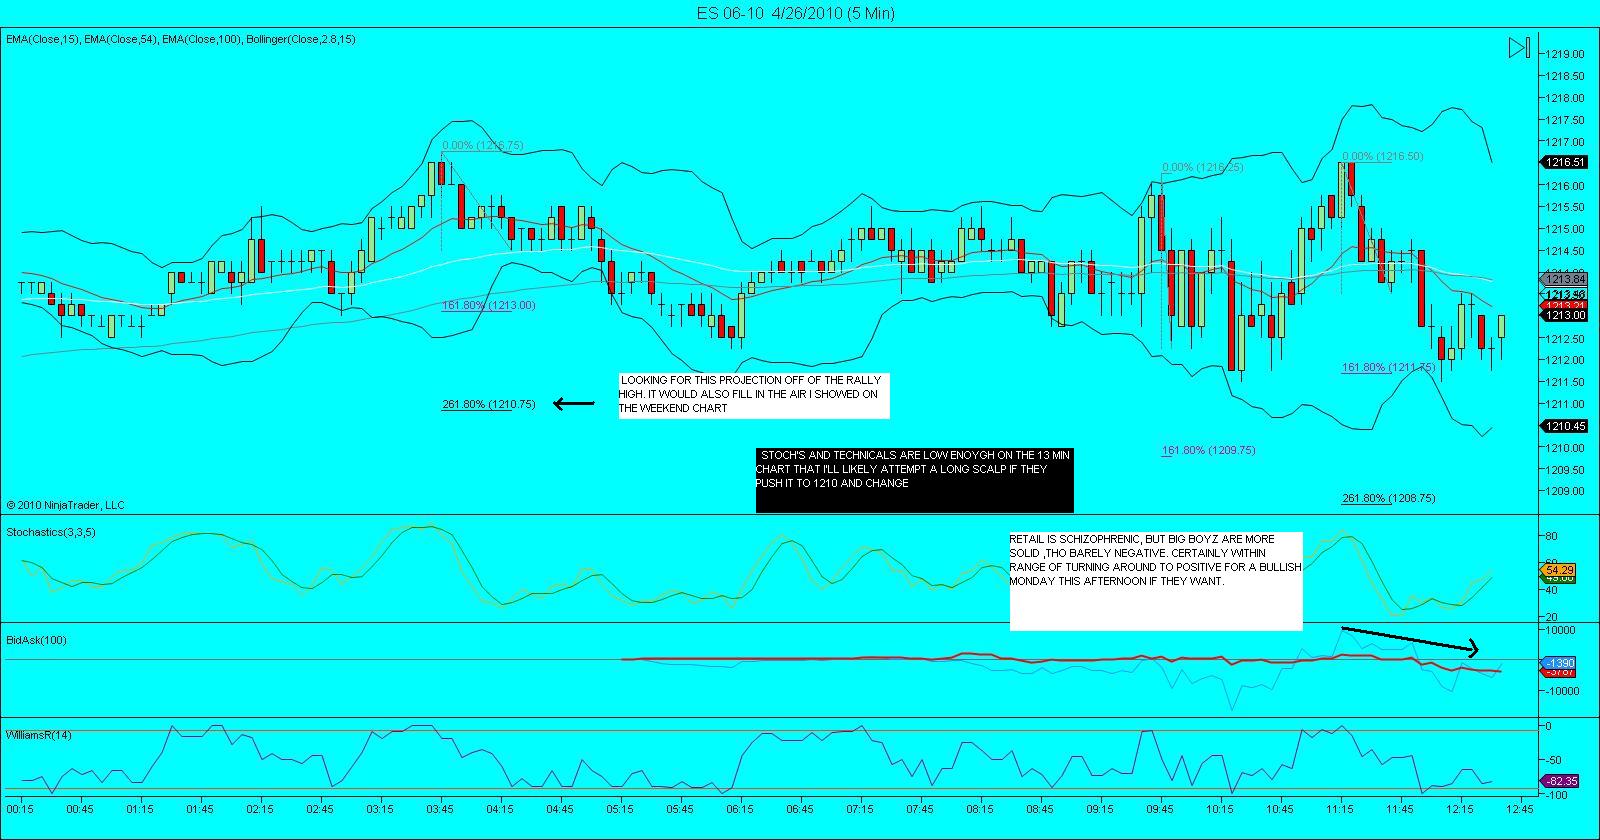
We are in a trading rge. 1211.50 - 1216.50. I'm long with 1216.50 objective. Stop right under support at 1112.25....now trading at 1212.75 One problem with it is that we are under Friday's high. the 1213.75. It is double the risk, but I'm all ready in........
Just a gut feeling, but i think we break to the upside later today. Still think it needs a little lower tho. Remember on the weekend update ,i showed the air at 1210.25 to 1211.75? Technically , we filled that on globex with the 1210.00 low. 1207 could be next, but i dont think so, yet. It just seems a little late in the trading session, in order to rebound above 1212 for a bullish Monday. Kools tools have cyles up thru today.
1209.50-75 is also a target along with 1210.75
hi everyone, I'm new to /es trading. Hope I can chime in and contribute.
I agree, it looks like a trading range day but market is really overbought here.
I'm short at 1213.
I agree, it looks like a trading range day but market is really overbought here.
I'm short at 1213.
Thanks guys. So far we have higher highs, higher lows in the 2m. chart. The price is respecting the support trend line... will see in due time the market will show me the way
Click image for original size
oh well it tag me. It was a mistake to buy below yesterday's high. The 2m chart also hit yesterday's high 5 times, a warning for me to move my stp to B.E. Staying on the side now for a bit.
Originally posted by koolblue
Click image for original size
I see why its taking so long to move. This thread is dated
for the 24th. That would make it a lagging indicator..
for the 24th. That would make it a lagging indicator..
ha ha, I was going to mention the same thing...
Bruce,
I noticed you did not mention the lowest volume price level of the Sunday night to Monday O/N at 1210.25-1210.00, was this becasue the price at this area had tests as opposed to non overlapping bars?
Bruce,
I noticed you did not mention the lowest volume price level of the Sunday night to Monday O/N at 1210.25-1210.00, was this becasue the price at this area had tests as opposed to non overlapping bars?
Originally posted by BruceM
...Hey DT how to edit a topic heading.....multi - tasking today...
Fixed the heading - sorry it took me so long to get to...
Emini Day Trading /
Daily Notes /
Forecast /
Economic Events /
Search /
Terms and Conditions /
Disclaimer /
Books /
Online Books /
Site Map /
Contact /
Privacy Policy /
Links /
About /
Day Trading Forum /
Investment Calculators /
Pivot Point Calculator /
Market Profile Generator /
Fibonacci Calculator /
Mailing List /
Advertise Here /
Articles /
Financial Terms /
Brokers /
Software /
Holidays /
Stock Split Calendar /
Mortgage Calculator /
Donate
Copyright © 2004-2023, MyPivots. All rights reserved.
Copyright © 2004-2023, MyPivots. All rights reserved.